Austria Chlorine Market (2026-2032) | Forecast, Size, Segmentation, Analysis, Revenue, Companies, Outlook, Growth, Share, Value, Industry & Trends
Market Forecast By Application (EDC/PVC, Isocyanates and Oxygenates, Chloromethanes, Solvents and Epichlorohydrin, Inorganic Chemicals, Other Applications), By End-user (Water Treatment, Pharmaceutical, Chemicals, Paper and Pulp, Plastic, Pesticides, Other) And Competitive Landscape
| Product Code: ETC4820584 | Publication Date: Nov 2023 | Updated Date: Mar 2026 | Product Type: Market Research Report | |
| Publisher: 6Wresearch | Author: Shubham Padhi | No. of Pages: 60 | No. of Figures: 30 | No. of Tables: 5 |
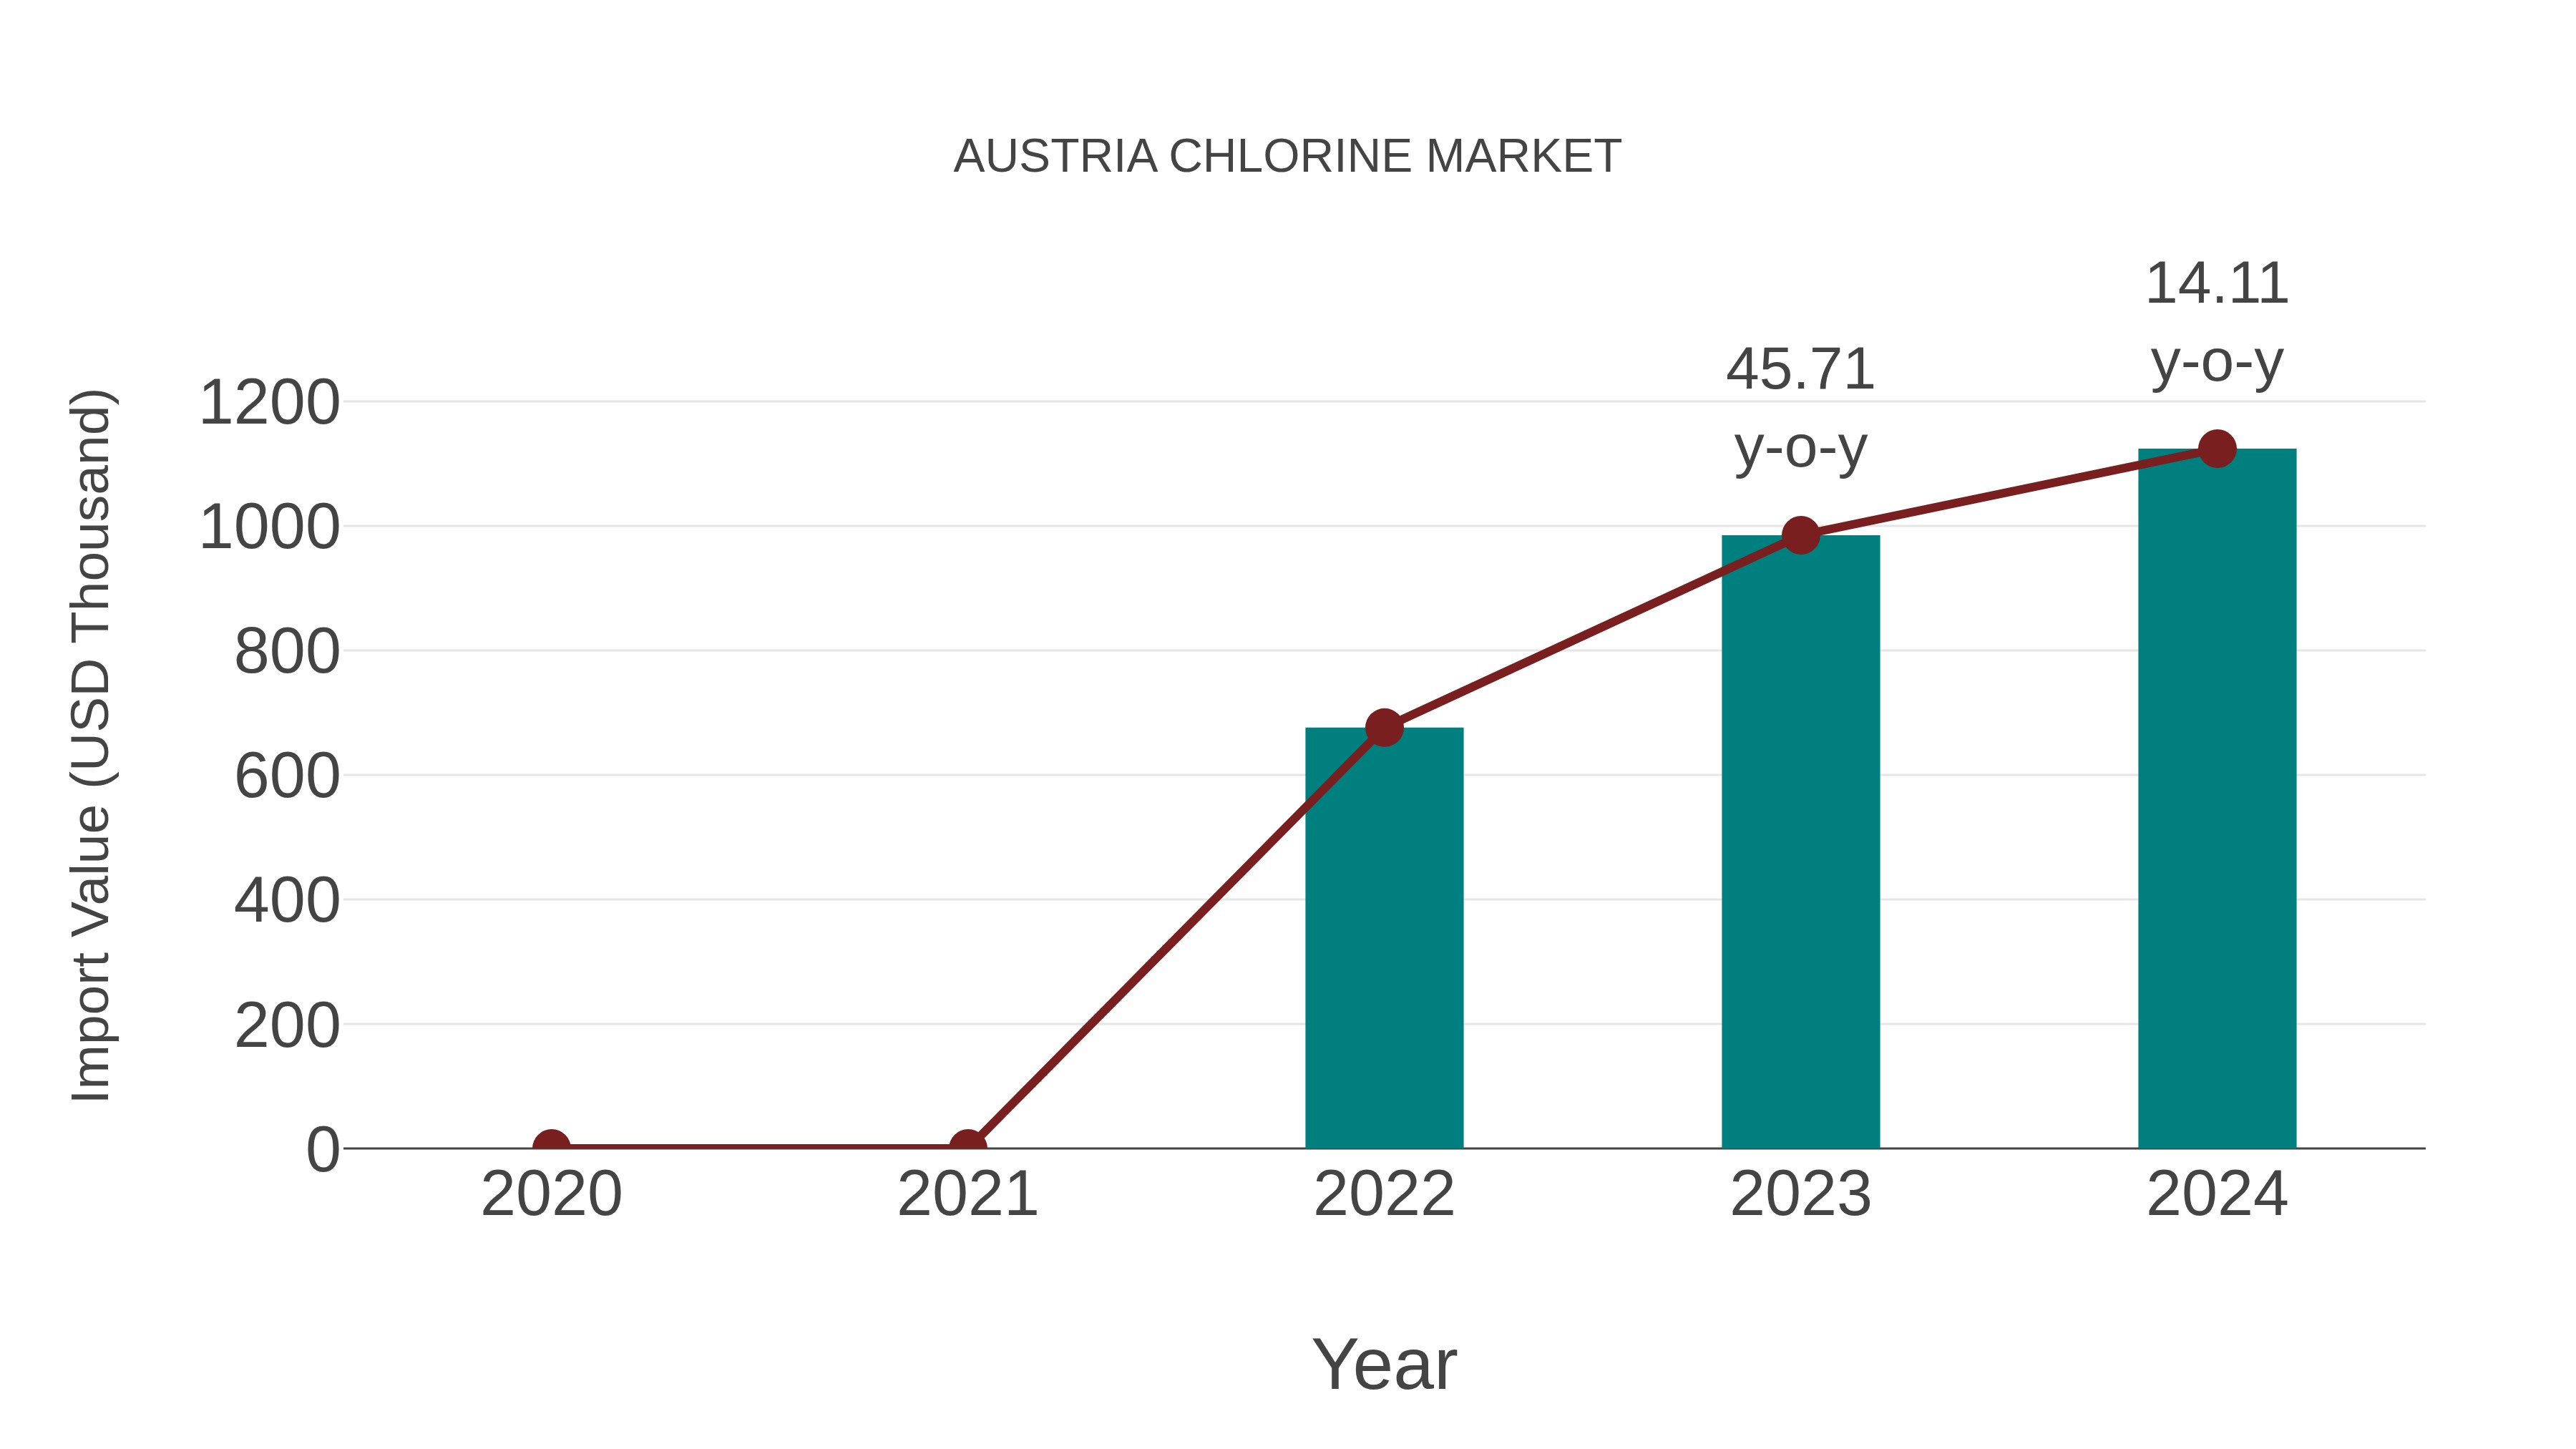
Austria Chlorine Market: Import Trend Analysis
In the Austria chlorine market, the import trend showed significant growth, with a 14.11% increase from 2023 to 2024. The compound annual growth rate (CAGR) for imports from 2020 to 2024 stood at 28.95%. This growth can be attributed to a notable demand shift towards chlorine-based products in various industries, driving import momentum in the market.
Austria Chlorine Market Overview
The chlorine market in Austria supplies elemental chlorine gas and chlorine compounds used in chemical synthesis, water disinfection, and polymer manufacturing. Chlorine products play crucial roles in PVC production, bleach manufacturing, and pharmaceutical synthesis, supporting global industries with essential chemical building blocks. Key applications include chlor-alkali production, pool sanitation, and textile bleaching. Key trends include the adoption of brine electrolysis technology for chlorine production, the development of chlorine-free water treatment alternatives, and the customization of chlorine derivatives for diverse industrial and consumer applications.
Drivers of the market
Austria`s chlorine market is primarily driven by its extensive use in water treatment, disinfection, and chemical manufacturing. The demand from these sectors, coupled with regulatory requirements for safe water and sanitation, supports market growth.
Challenges of the market
The chlorine market in Austria faces challenges related to the fluctuating prices and availability of raw materials, such as salt and electricity, which are influenced by global supply and demand dynamics. Ensuring the consistent quality, performance, and safety of chlorine for various applications, such as water treatment, chemical manufacturing, and disinfection, adds complexity to the market. Additionally, competition from alternative chlorine sources and technologies impacts market demand. Regulatory compliance with safety and environmental standards also poses challenges. Manufacturers must invest in sustainable sourcing practices, quality control systems, and research and development to maintain market competitiveness and meet industrial demands for high-quality chlorine.
Government Policy of the market
Government policies in Austria for the chlorine market emphasize supporting the chemical and water treatment sectors. Financial incentives are provided for companies producing chlorine used in various applications, including disinfection and chemical production. The government promotes research into improving the safety and environmental impact of chlorine production and use, fostering innovation and supporting public health and industrial processes.
Key Highlights of the Report:
- Austria Chlorine Market Outlook
- Market Size of Austria Chlorine Market, 2025
- Forecast of Austria Chlorine Market, 2032
- Historical Data and Forecast of Austria Chlorine Revenues & Volume for the Period 2022-2032F
- Austria Chlorine Market Trend Evolution
- Austria Chlorine Market Drivers and Challenges
- Austria Chlorine Price Trends
- Austria Chlorine Porter`s Five Forces
- Austria Chlorine Industry Life Cycle
- Historical Data and Forecast of Austria Chlorine Market Revenues & Volume By Application for the Period 2022-2032F
- Historical Data and Forecast of Austria Chlorine Market Revenues & Volume By EDC/PVC for the Period 2022-2032F
- Historical Data and Forecast of Austria Chlorine Market Revenues & Volume By Isocyanates and Oxygenates for the Period 2022-2032F
- Historical Data and Forecast of Austria Chlorine Market Revenues & Volume By Chloromethanes for the Period 2022-2032F
- Historical Data and Forecast of Austria Chlorine Market Revenues & Volume By Solvents and Epichlorohydrin for the Period 2022-2032F
- Historical Data and Forecast of Austria Chlorine Market Revenues & Volume By Inorganic Chemicals for the Period 2022-2032F
- Historical Data and Forecast of Austria Chlorine Market Revenues & Volume By Other Applications for the Period 2022-2032F
- Historical Data and Forecast of Austria Chlorine Market Revenues & Volume By End-user for the Period 2022-2032F
- Historical Data and Forecast of Austria Chlorine Market Revenues & Volume By Water Treatment for the Period 2022-2032F
- Historical Data and Forecast of Austria Chlorine Market Revenues & Volume By Pharmaceutical for the Period 2022-2032F
- Historical Data and Forecast of Austria Chlorine Market Revenues & Volume By Chemicals for the Period 2022-2032F
- Historical Data and Forecast of Austria Chlorine Market Revenues & Volume By Paper and Pulp for the Period 2022-2032F
- Historical Data and Forecast of Austria Chlorine Market Revenues & Volume By Plastic for the Period 2022-2032F
- Historical Data and Forecast of Austria Chlorine Market Revenues & Volume By Pesticides for the Period 2022-2032F
- Historical Data and Forecast of Austria Chlorine Market Revenues & Volume By Other for the Period 2022-2032F
- Austria Chlorine Import Export Trade Statistics
- Market Opportunity Assessment By Application
- Market Opportunity Assessment By End-user
- Austria Chlorine Top Companies Market Share
- Austria Chlorine Competitive Benchmarking By Technical and Operational Parameters
- Austria Chlorine Company Profiles
- Austria Chlorine Key Strategic Recommendations
Austria Chlorine Market (2026-2032): FAQs
6Wresearch actively monitors the Austria Chlorine Market and publishes its comprehensive annual report, highlighting emerging trends, growth drivers, revenue analysis, and forecast outlook. Our insights help businesses to make data-backed strategic decisions with ongoing market dynamics. Our analysts track relevent industries related to the Austria Chlorine Market, allowing our clients with actionable intelligence and reliable forecasts tailored to emerging regional needs.
Yes, we provide customisation as per your requirements. To learn more, feel free to contact us on sales@6wresearch.com
1 Executive Summary |
2 Introduction |
2.1 Key Highlights of the Report |
2.2 Report Description |
2.3 Market Scope & Segmentation |
2.4 Research Methodology |
2.5 Assumptions |
3 Austria Chlorine Market Overview |
3.1 Austria Country Macro Economic Indicators |
3.2 Austria Chlorine Market Revenues & Volume, 2022 & 2032F |
3.3 Austria Chlorine Market - Industry Life Cycle |
3.4 Austria Chlorine Market - Porter's Five Forces |
3.5 Austria Chlorine Market Revenues & Volume Share, By Application, 2022 & 2032F |
3.6 Austria Chlorine Market Revenues & Volume Share, By End-user, 2022 & 2032F |
4 Austria Chlorine Market Dynamics |
4.1 Impact Analysis |
4.2 Market Drivers |
4.2.1 Increasing demand for chlorine in water treatment and sanitation industries |
4.2.2 Growth of the chemical industry in Austria |
4.2.3 Rising awareness about the benefits of chlorine in maintaining hygiene and cleanliness |
4.3 Market Restraints |
4.3.1 Stringent regulations regarding the handling and disposal of chlorine |
4.3.2 Fluctuating prices of raw materials used in chlorine production |
4.3.3 Competition from alternative disinfection methods |
5 Austria Chlorine Market Trends |
6 Austria Chlorine Market Segmentations |
6.1 Austria Chlorine Market, By Application |
6.1.1 Overview and Analysis |
6.1.2 Austria Chlorine Market Revenues & Volume, By EDC/PVC, 2022-2032F |
6.1.3 Austria Chlorine Market Revenues & Volume, By Isocyanates and Oxygenates, 2022-2032F |
6.1.4 Austria Chlorine Market Revenues & Volume, By Chloromethanes, 2022-2032F |
6.1.5 Austria Chlorine Market Revenues & Volume, By Solvents and Epichlorohydrin, 2022-2032F |
6.1.6 Austria Chlorine Market Revenues & Volume, By Inorganic Chemicals, 2022-2032F |
6.1.7 Austria Chlorine Market Revenues & Volume, By Other Applications, 2022-2032F |
6.2 Austria Chlorine Market, By End-user |
6.2.1 Overview and Analysis |
6.2.2 Austria Chlorine Market Revenues & Volume, By Water Treatment, 2022-2032F |
6.2.3 Austria Chlorine Market Revenues & Volume, By Pharmaceutical, 2022-2032F |
6.2.4 Austria Chlorine Market Revenues & Volume, By Chemicals, 2022-2032F |
6.2.5 Austria Chlorine Market Revenues & Volume, By Paper and Pulp, 2022-2032F |
6.2.6 Austria Chlorine Market Revenues & Volume, By Plastic, 2022-2032F |
6.2.7 Austria Chlorine Market Revenues & Volume, By Pesticides, 2022-2032F |
7 Austria Chlorine Market Import-Export Trade Statistics |
7.1 Austria Chlorine Market Export to Major Countries |
7.2 Austria Chlorine Market Imports from Major Countries |
8 Austria Chlorine Market Key Performance Indicators |
8.1 Average selling price of chlorine in Austria |
8.2 Adoption rate of chlorine in new applications |
8.3 Investment in research and development for chlorine products |
8.4 Environmental impact of chlorine production and usage |
8.5 Import/export volume of chlorine in Austria |
9 Austria Chlorine Market - Opportunity Assessment |
9.1 Austria Chlorine Market Opportunity Assessment, By Application, 2022 & 2032F |
9.2 Austria Chlorine Market Opportunity Assessment, By End-user, 2022 & 2032F |
10 Austria Chlorine Market - Competitive Landscape |
10.1 Austria Chlorine Market Revenue Share, By Companies, 2025 |
10.2 Austria Chlorine Market Competitive Benchmarking, By Operating and Technical Parameters |
11 Company Profiles |
12 Recommendations | 13 Disclaimer |
Global Go To Market Strategy - 2030
Export potential enables firms to identify high-growth global markets with greater confidence by combining advanced trade intelligence with a structured quantitative methodology. The framework analyzes emerging demand trends and country-level import patterns while integrating macroeconomic and trade datasets such as GDP and population forecasts, bilateral import–export flows, tariff structures, elasticity differentials between developed and developing economies, geographic distance, and import demand projections. Using weighted trade values from 2020–2024 as the base period to project country-to-country export potential for 2030, these inputs are operationalized through calculated drivers such as gravity model parameters, tariff impact factors, and projected GDP per-capita growth. Through an analysis of hidden potentials, demand hotspots, and market conditions that are most favorable to success, this method enables firms to focus on target countries, maximize returns, and global expansion with data, backed by accuracy.
By factoring in the projected importer demand gap that is currently unmet and could be potential opportunity, it identifies the potential for the Exporter (Country) among 190 countries, against the general trade analysis, which identifies the biggest importer or exporter.
To discover high-growth global markets and optimize your business strategy:
Click Here
Pricing
- Single User License$ 1,995
- Department License$ 2,400
- Site License$ 3,120
- Global License$ 3,795

Leadership Perspectives from Industry Events
Search
Thought Leadership and Analyst Meet


Our Clients
6WResearch In News
- Doha a strategic location for EV manufacturing hub: IPA Qatar
- Demand for luxury TVs surging in the GCC, says Samsung
- Empowering Growth: The Thriving Journey of Bangladesh’s Cable Industry
- Demand for luxury TVs surging in the GCC, says Samsung
- Video call with a traditional healer? Once unthinkable, it’s now common in South Africa
- Intelligent Buildings To Smooth GCC’s Path To Net Zero
Latest Reports
- Cape Verde Portable Hand-Thrown Extinguisher Market (2026-2032)
- Canada Portable Hand-Thrown Extinguisher Market (2026-2032)
- Cameroon Portable Hand-Thrown Extinguisher Market (2026-2032)
- Burundi Portable Hand-Thrown Extinguisher Market (2026-2032)
- Burkina Faso Portable Hand-Thrown Extinguisher Market (2026-2032)
- Bulgaria Portable Hand-Thrown Extinguisher Market (2026-2032)
- Brunei Portable Hand-Thrown Extinguisher Market (2026-2032)
- Botswana Portable Hand-Thrown Extinguisher Market (2026-2032)
- Bosnia and Herzegovina Portable Hand-Thrown Extinguisher Market (2026-2032)
- Bolivia Portable Hand-Thrown Extinguisher Market (2026-2032)
Industry Events and Analyst Meet

HIMTEX 2026

India Refining Summit 2026

India EV Show 2026

EV tech India Expo 2026

Auto Tech Asia 2026
Whitepaper
- Middle East & Africa Commercial Security Market Click here to view more.
- Middle East & Africa Fire Safety Systems & Equipment Market Click here to view more.
- GCC Drone Market Click here to view more.
- Middle East Lighting Fixture Market Click here to view more.
- GCC Physical & Perimeter Security Market Click here to view more.