Austria Palmitic Acid Market (2026-2032) | Revenue, Trends, Outlook, Industry, Size, Value, Growth, Analysis, Segmentation, Share, Forecast & Companies
Market Forecast By Type (Distilled Type, Fractionated Type), By Application (Soap & Detergent, Cosmetics, Grease & Lubricant, Others) And Competitive Landscape
| Product Code: ETC5297522 | Publication Date: Nov 2023 | Updated Date: Apr 2026 | Product Type: Market Research Report | |
| Publisher: 6Wresearch | Author: Ravi Bhandari | No. of Pages: 60 | No. of Figures: 30 | No. of Tables: 5 |
Austria Palmitic Acid Market Size (2020-2030)
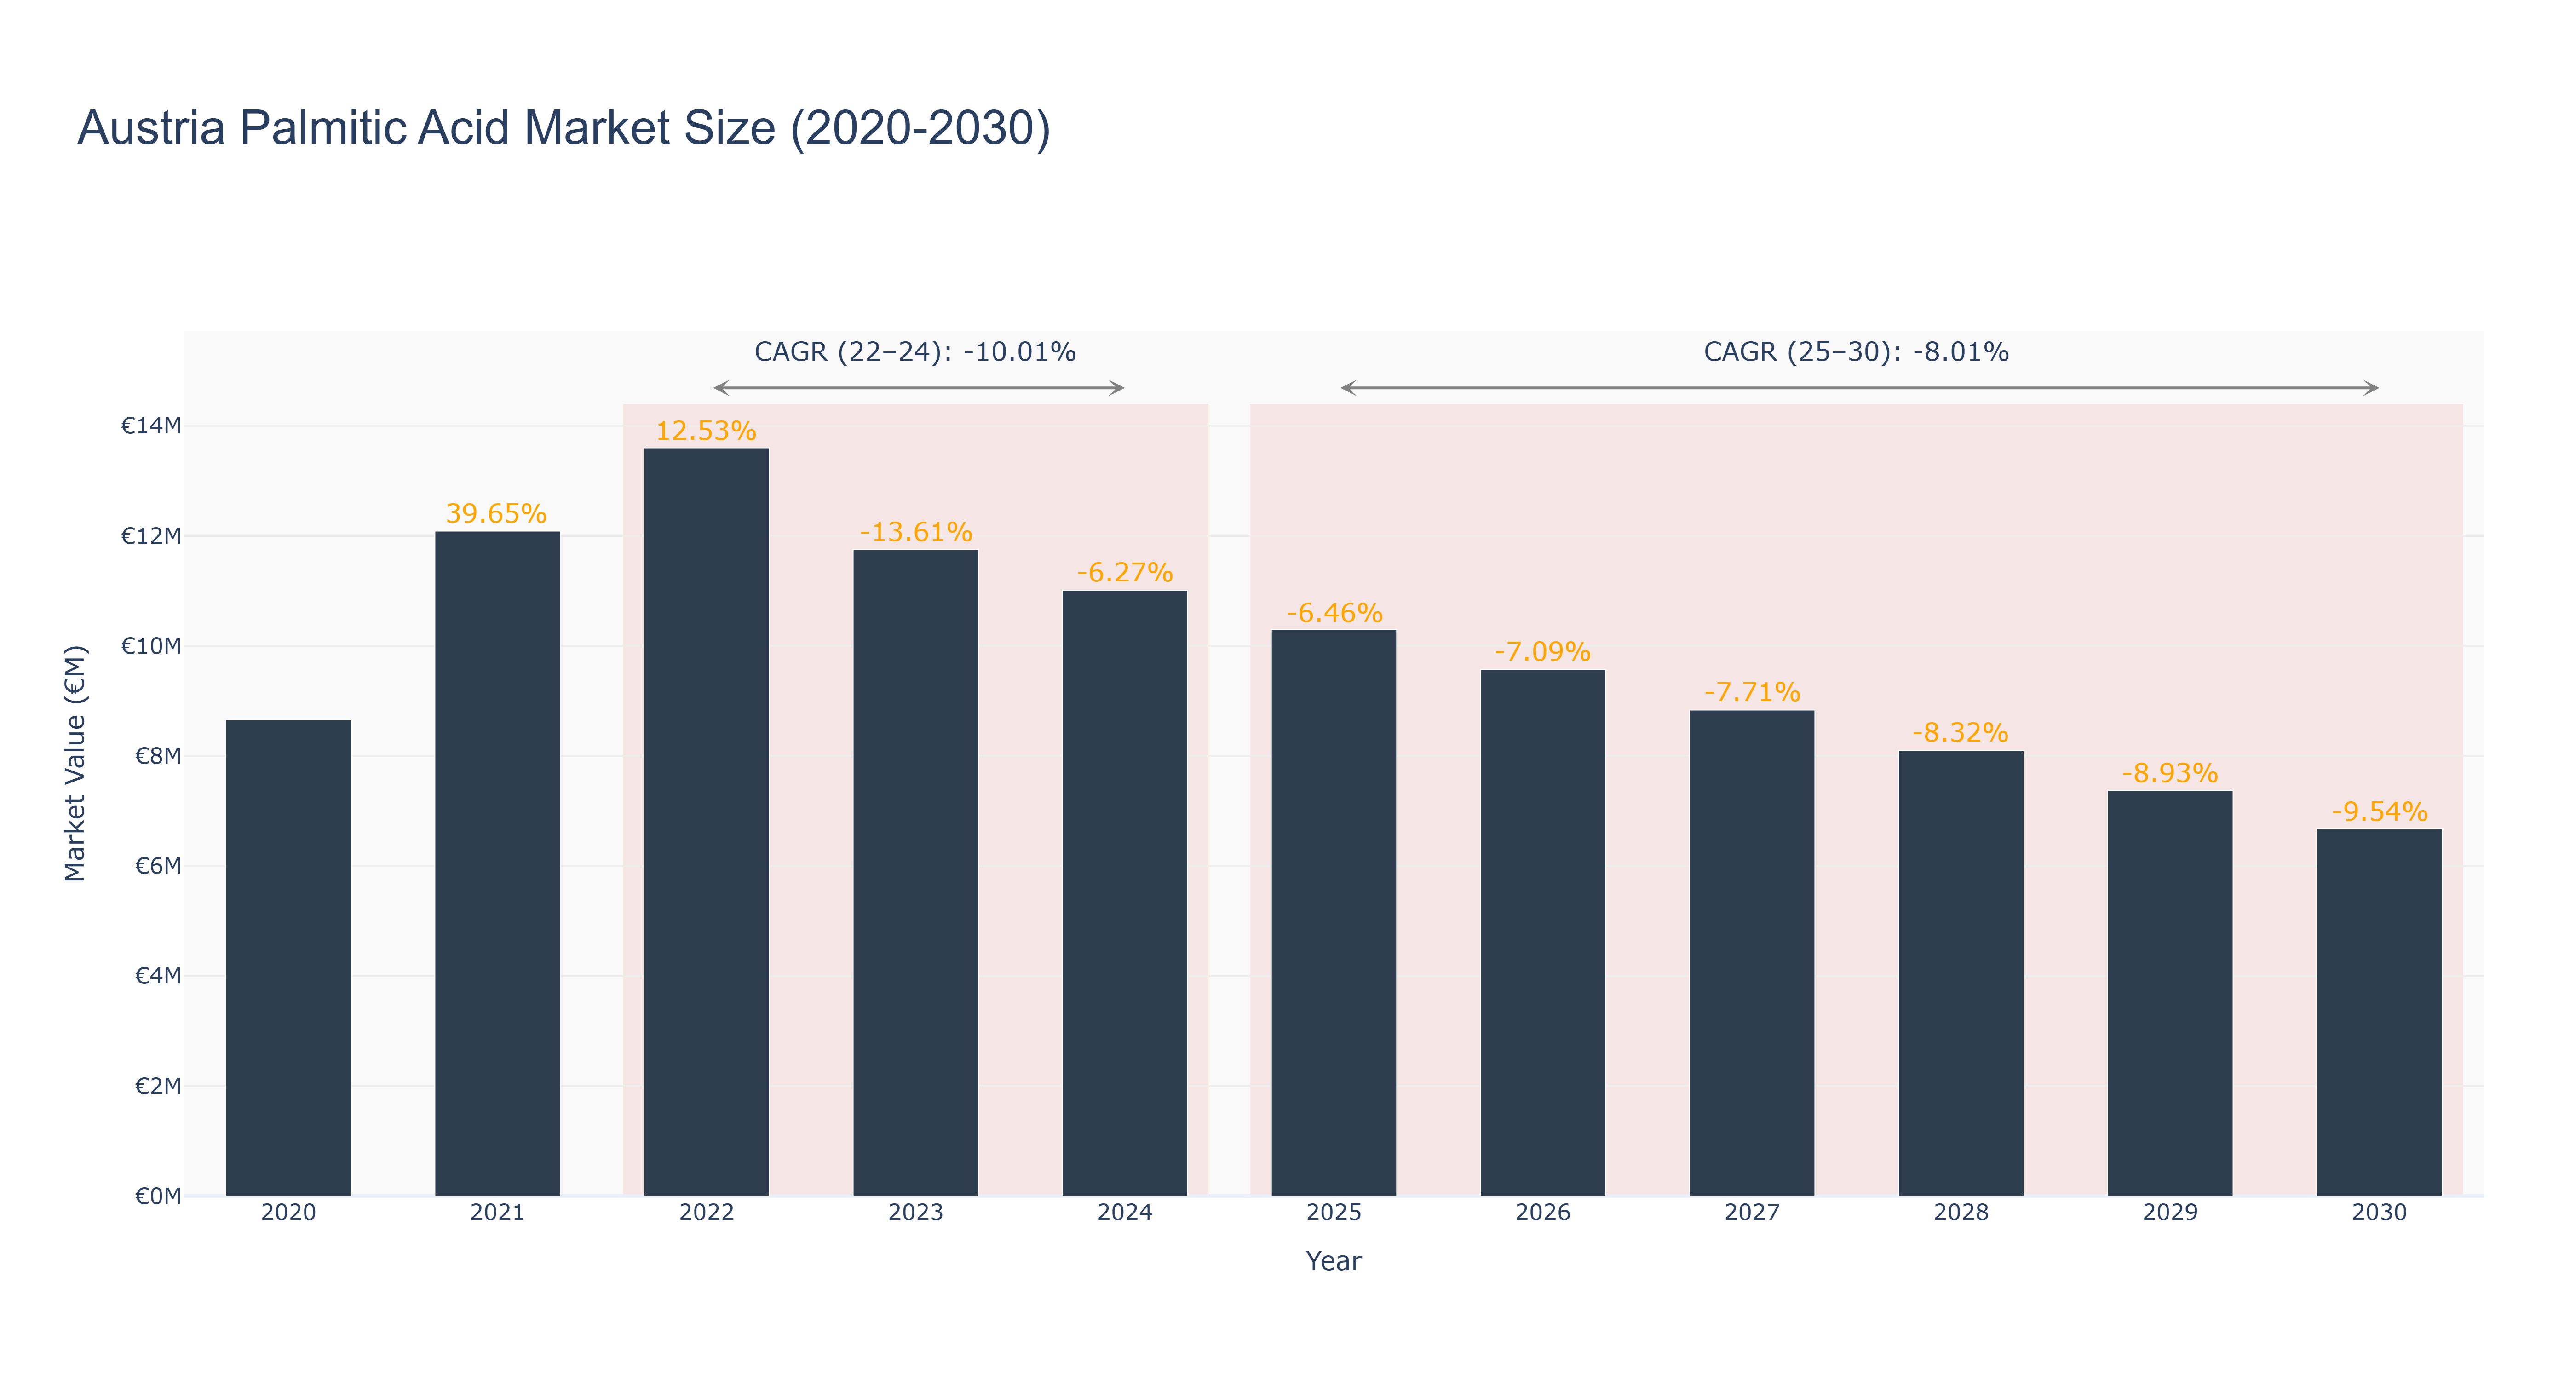
The Austria Palmitic Acid Market experienced significant fluctuations from 2020 to 2024, with a peak market size of €13.60 million in 2022, followed by a decline to €11.01 million in 2024, reflecting a compound annual growth rate (CAGR) of -10.01% for the actual period. Notable growth in 2021 was primarily driven by increased demand in the food and cosmetic sectors, while subsequent years saw a downturn due to market saturation and shifting consumer preferences towards alternative ingredients. Looking ahead, the forecasted period from 2025 to 2030 suggests a continued decline, with projected market sizes decreasing from €10.30 million in 2025 to €6.67 million by 2030, reflecting a CAGR of -8.01%. This downward trend may be influenced by ongoing sustainability initiatives and regulatory changes favoring eco-friendly substitutes, potentially reshaping the industry landscape.
Austria Palmitic Acid Market: Production & Trade Performance (2019-2025)
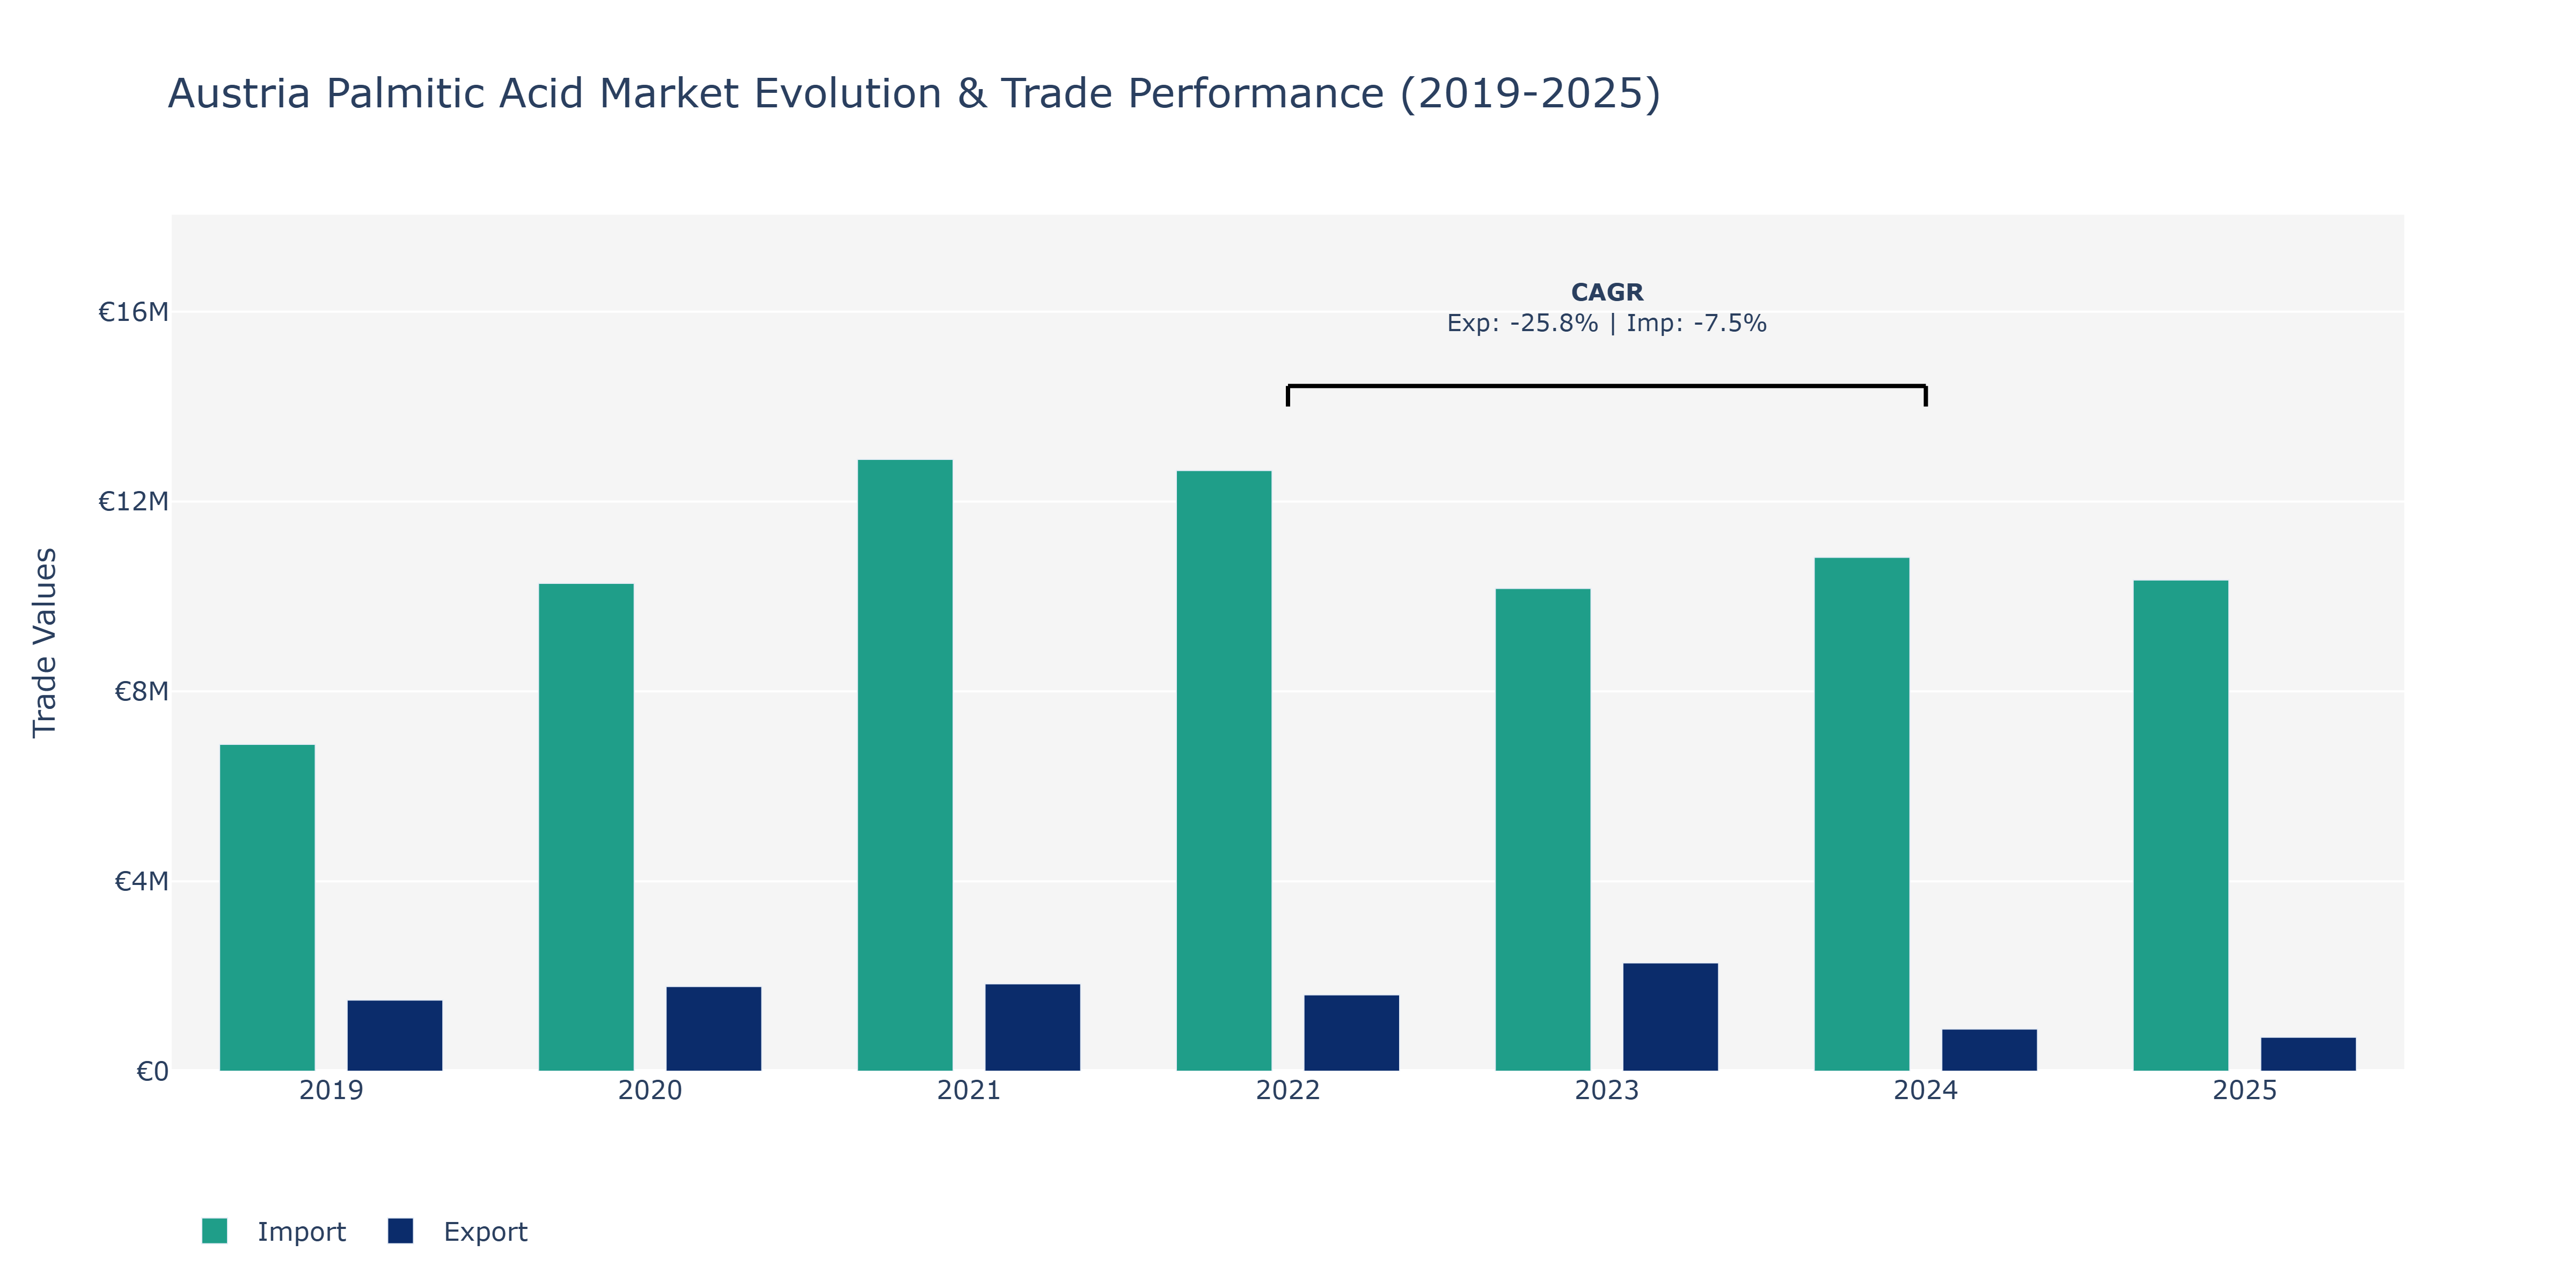
The Austria Palmitic Acid Market witnessed notable fluctuations in both exports and imports from 2019 to 2025. Exports started at €1.5 million in 2019, experienced a peak in 2023 reaching €2.28 million, and then dropped significantly to €887.32 thousand in 2024 and further to €714.26 thousand in 2025. On the other hand, imports began at €6.88 million in 2019, increased consistently until 2021 to €12.89 million, and then fluctuated around the €10 million mark in the following years. The sharp decline in exports can be attributed to changing global demand patterns for palmitic acid, possibly influenced by shifts towards alternative products or market saturation in certain regions. Conversely, the stable imports suggest a steady demand within Austria for this essential chemical compound, emphasizing the country's position as a key player in the global supply chain for palmitic acid. This dynamic market behavior underscores the need for producers to adapt to evolving market conditions and explore new growth opportunities to maintain competitiveness in the industry.
Key Highlights of the Report:
- Austria Palmitic Acid Market Outlook
- Market Size of Austria Palmitic Acid Market, 2025
- Forecast of Austria Palmitic Acid Market, 2032
- Historical Data and Forecast of Austria Palmitic Acid Revenues & Volume for the Period 2022-2032F
- Austria Palmitic Acid Market Trend Evolution
- Austria Palmitic Acid Market Drivers and Challenges
- Austria Palmitic Acid Price Trends
- Austria Palmitic Acid Porter`s Five Forces
- Austria Palmitic Acid Industry Life Cycle
- Historical Data and Forecast of Austria Palmitic Acid Market Revenues & Volume By Type for the Period 2022-2032F
- Historical Data and Forecast of Austria Palmitic Acid Market Revenues & Volume By Distilled Type for the Period 2022-2032F
- Historical Data and Forecast of Austria Palmitic Acid Market Revenues & Volume By Fractionated Type for the Period 2022-2032F
- Historical Data and Forecast of Austria Palmitic Acid Market Revenues & Volume By Application for the Period 2022-2032F
- Historical Data and Forecast of Austria Palmitic Acid Market Revenues & Volume By Soap & Detergent for the Period 2022-2032F
- Historical Data and Forecast of Austria Palmitic Acid Market Revenues & Volume By Cosmetics for the Period 2022-2032F
- Historical Data and Forecast of Austria Palmitic Acid Market Revenues & Volume By Grease & Lubricant for the Period 2022-2032F
- Historical Data and Forecast of Austria Palmitic Acid Market Revenues & Volume By Others for the Period 2022-2032F
- Austria Palmitic Acid Import Export Trade Statistics
- Market Opportunity Assessment By Type
- Market Opportunity Assessment By Application
- Austria Palmitic Acid Top Companies Market Share
- Austria Palmitic Acid Competitive Benchmarking By Technical and Operational Parameters
- Austria Palmitic Acid Company Profiles
- Austria Palmitic Acid Key Strategic Recommendations
Frequently Asked Questions About the Market Study (FAQs):
6Wresearch actively monitors the Austria Palmitic Acid Market and publishes its comprehensive annual report, highlighting emerging trends, growth drivers, revenue analysis, and forecast outlook. Our insights help businesses to make data-backed strategic decisions with ongoing market dynamics. Our analysts track relevent industries related to the Austria Palmitic Acid Market, allowing our clients with actionable intelligence and reliable forecasts tailored to emerging regional needs.
Yes, we provide customisation as per your requirements. To learn more, feel free to contact us on sales@6wresearch.com
1 Executive Summary |
2 Introduction |
2.1 Key Highlights of the Report |
2.2 Report Description |
2.3 Market Scope & Segmentation |
2.4 Research Methodology |
2.5 Assumptions |
3 Austria Palmitic Acid Market Overview |
3.1 Austria Country Macro Economic Indicators |
3.2 Austria Palmitic Acid Market Revenues & Volume, 2022 & 2032F |
3.3 Austria Palmitic Acid Market - Industry Life Cycle |
3.4 Austria Palmitic Acid Market - Porter's Five Forces |
3.5 Austria Palmitic Acid Market Revenues & Volume Share, By Type, 2022 & 2032F |
3.6 Austria Palmitic Acid Market Revenues & Volume Share, By Application, 2022 & 2032F |
4 Austria Palmitic Acid Market Dynamics |
4.1 Impact Analysis |
4.2 Market Drivers |
4.2.1 Growing demand for personal care and cosmetics products in Austria |
4.2.2 Increasing use of palmitic acid in the food industry for emulsifying and stabilizing agents |
4.2.3 Rising awareness about the benefits of palmitic acid in pharmaceuticals and healthcare products |
4.3 Market Restraints |
4.3.1 Fluctuating prices of raw materials like palm oil, a primary source of palmitic acid |
4.3.2 Stringent regulations related to the use of palmitic acid in certain industries in Austria |
5 Austria Palmitic Acid Market Trends |
6 Austria Palmitic Acid Market Segmentations |
6.1 Austria Palmitic Acid Market, By Type |
6.1.1 Overview and Analysis |
6.1.2 Austria Palmitic Acid Market Revenues & Volume, By Distilled Type, 2022-2032F |
6.1.3 Austria Palmitic Acid Market Revenues & Volume, By Fractionated Type, 2022-2032F |
6.2 Austria Palmitic Acid Market, By Application |
6.2.1 Overview and Analysis |
6.2.2 Austria Palmitic Acid Market Revenues & Volume, By Soap & Detergent, 2022-2032F |
6.2.3 Austria Palmitic Acid Market Revenues & Volume, By Cosmetics, 2022-2032F |
6.2.4 Austria Palmitic Acid Market Revenues & Volume, By Grease & Lubricant, 2022-2032F |
6.2.5 Austria Palmitic Acid Market Revenues & Volume, By Others, 2022-2032F |
7 Austria Palmitic Acid Market Import-Export Trade Statistics |
7.1 Austria Palmitic Acid Market Export to Major Countries |
7.2 Austria Palmitic Acid Market Imports from Major Countries |
8 Austria Palmitic Acid Market Key Performance Indicators |
8.1 Research and development investment in palmitic acid-based product innovation |
8.2 Adoption rate of palmitic acid in new applications in Austria |
8.3 Number of partnerships and collaborations within the palmitic acid value chain in the Austrian market. |
9 Austria Palmitic Acid Market - Opportunity Assessment |
9.1 Austria Palmitic Acid Market Opportunity Assessment, By Type, 2022 & 2032F |
9.2 Austria Palmitic Acid Market Opportunity Assessment, By Application, 2022 & 2032F |
10 Austria Palmitic Acid Market - Competitive Landscape |
10.1 Austria Palmitic Acid Market Revenue Share, By Companies, 2025 |
10.2 Austria Palmitic Acid Market Competitive Benchmarking, By Operating and Technical Parameters |
11 Company Profiles |
12 Recommendations | 13 Disclaimer |
Global Go To Market Strategy - 2030
Export potential enables firms to identify high-growth global markets with greater confidence by combining advanced trade intelligence with a structured quantitative methodology. The framework analyzes emerging demand trends and country-level import patterns while integrating macroeconomic and trade datasets such as GDP and population forecasts, bilateral import–export flows, tariff structures, elasticity differentials between developed and developing economies, geographic distance, and import demand projections. Using weighted trade values from 2020–2024 as the base period to project country-to-country export potential for 2030, these inputs are operationalized through calculated drivers such as gravity model parameters, tariff impact factors, and projected GDP per-capita growth. Through an analysis of hidden potentials, demand hotspots, and market conditions that are most favorable to success, this method enables firms to focus on target countries, maximize returns, and global expansion with data, backed by accuracy.
By factoring in the projected importer demand gap that is currently unmet and could be potential opportunity, it identifies the potential for the Exporter (Country) among 190 countries, against the general trade analysis, which identifies the biggest importer or exporter.
To discover high-growth global markets and optimize your business strategy:
Click Here
Pricing
- Single User License$ 1,995
- Department License$ 2,400
- Site License$ 3,120
- Global License$ 3,795

Leadership Perspectives from Industry Events
Search
Thought Leadership and Analyst Meet


Our Clients
6WResearch In News
- Doha a strategic location for EV manufacturing hub: IPA Qatar
- Demand for luxury TVs surging in the GCC, says Samsung
- Empowering Growth: The Thriving Journey of Bangladesh’s Cable Industry
- Demand for luxury TVs surging in the GCC, says Samsung
- Video call with a traditional healer? Once unthinkable, it’s now common in South Africa
- Intelligent Buildings To Smooth GCC’s Path To Net Zero
Latest Reports
- Cape Verde Portable Hand-Thrown Extinguisher Market (2026-2032)
- Canada Portable Hand-Thrown Extinguisher Market (2026-2032)
- Cameroon Portable Hand-Thrown Extinguisher Market (2026-2032)
- Burundi Portable Hand-Thrown Extinguisher Market (2026-2032)
- Burkina Faso Portable Hand-Thrown Extinguisher Market (2026-2032)
- Bulgaria Portable Hand-Thrown Extinguisher Market (2026-2032)
- Brunei Portable Hand-Thrown Extinguisher Market (2026-2032)
- Botswana Portable Hand-Thrown Extinguisher Market (2026-2032)
- Bosnia and Herzegovina Portable Hand-Thrown Extinguisher Market (2026-2032)
- Bolivia Portable Hand-Thrown Extinguisher Market (2026-2032)
Industry Events and Analyst Meet

HIMTEX 2026

India Refining Summit 2026

India EV Show 2026

EV tech India Expo 2026

Auto Tech Asia 2026
Whitepaper
- Middle East & Africa Commercial Security Market Click here to view more.
- Middle East & Africa Fire Safety Systems & Equipment Market Click here to view more.
- GCC Drone Market Click here to view more.
- Middle East Lighting Fixture Market Click here to view more.
- GCC Physical & Perimeter Security Market Click here to view more.