Austria Recloser Market (2026-2032) | Analysis, Industry, Size, Outlook, Revenue, Segmentation, Share, Value, Companies, Trends, Forecast & Growth
Market Forecast By Phase Type (Three Phase, Single Phase, Triple-single Phase), By Control Type (Electronic , Hydraulic), By Voltage Rating (Up to 15 kV, 16-27 kV, 28-38 kV) And Competitive Landscape
| Product Code: ETC5760875 | Publication Date: Nov 2023 | Updated Date: Mar 2026 | Product Type: Market Research Report | |
| Publisher: 6Wresearch | Author: Ravi Bhandari | No. of Pages: 60 | No. of Figures: 30 | No. of Tables: 5 |
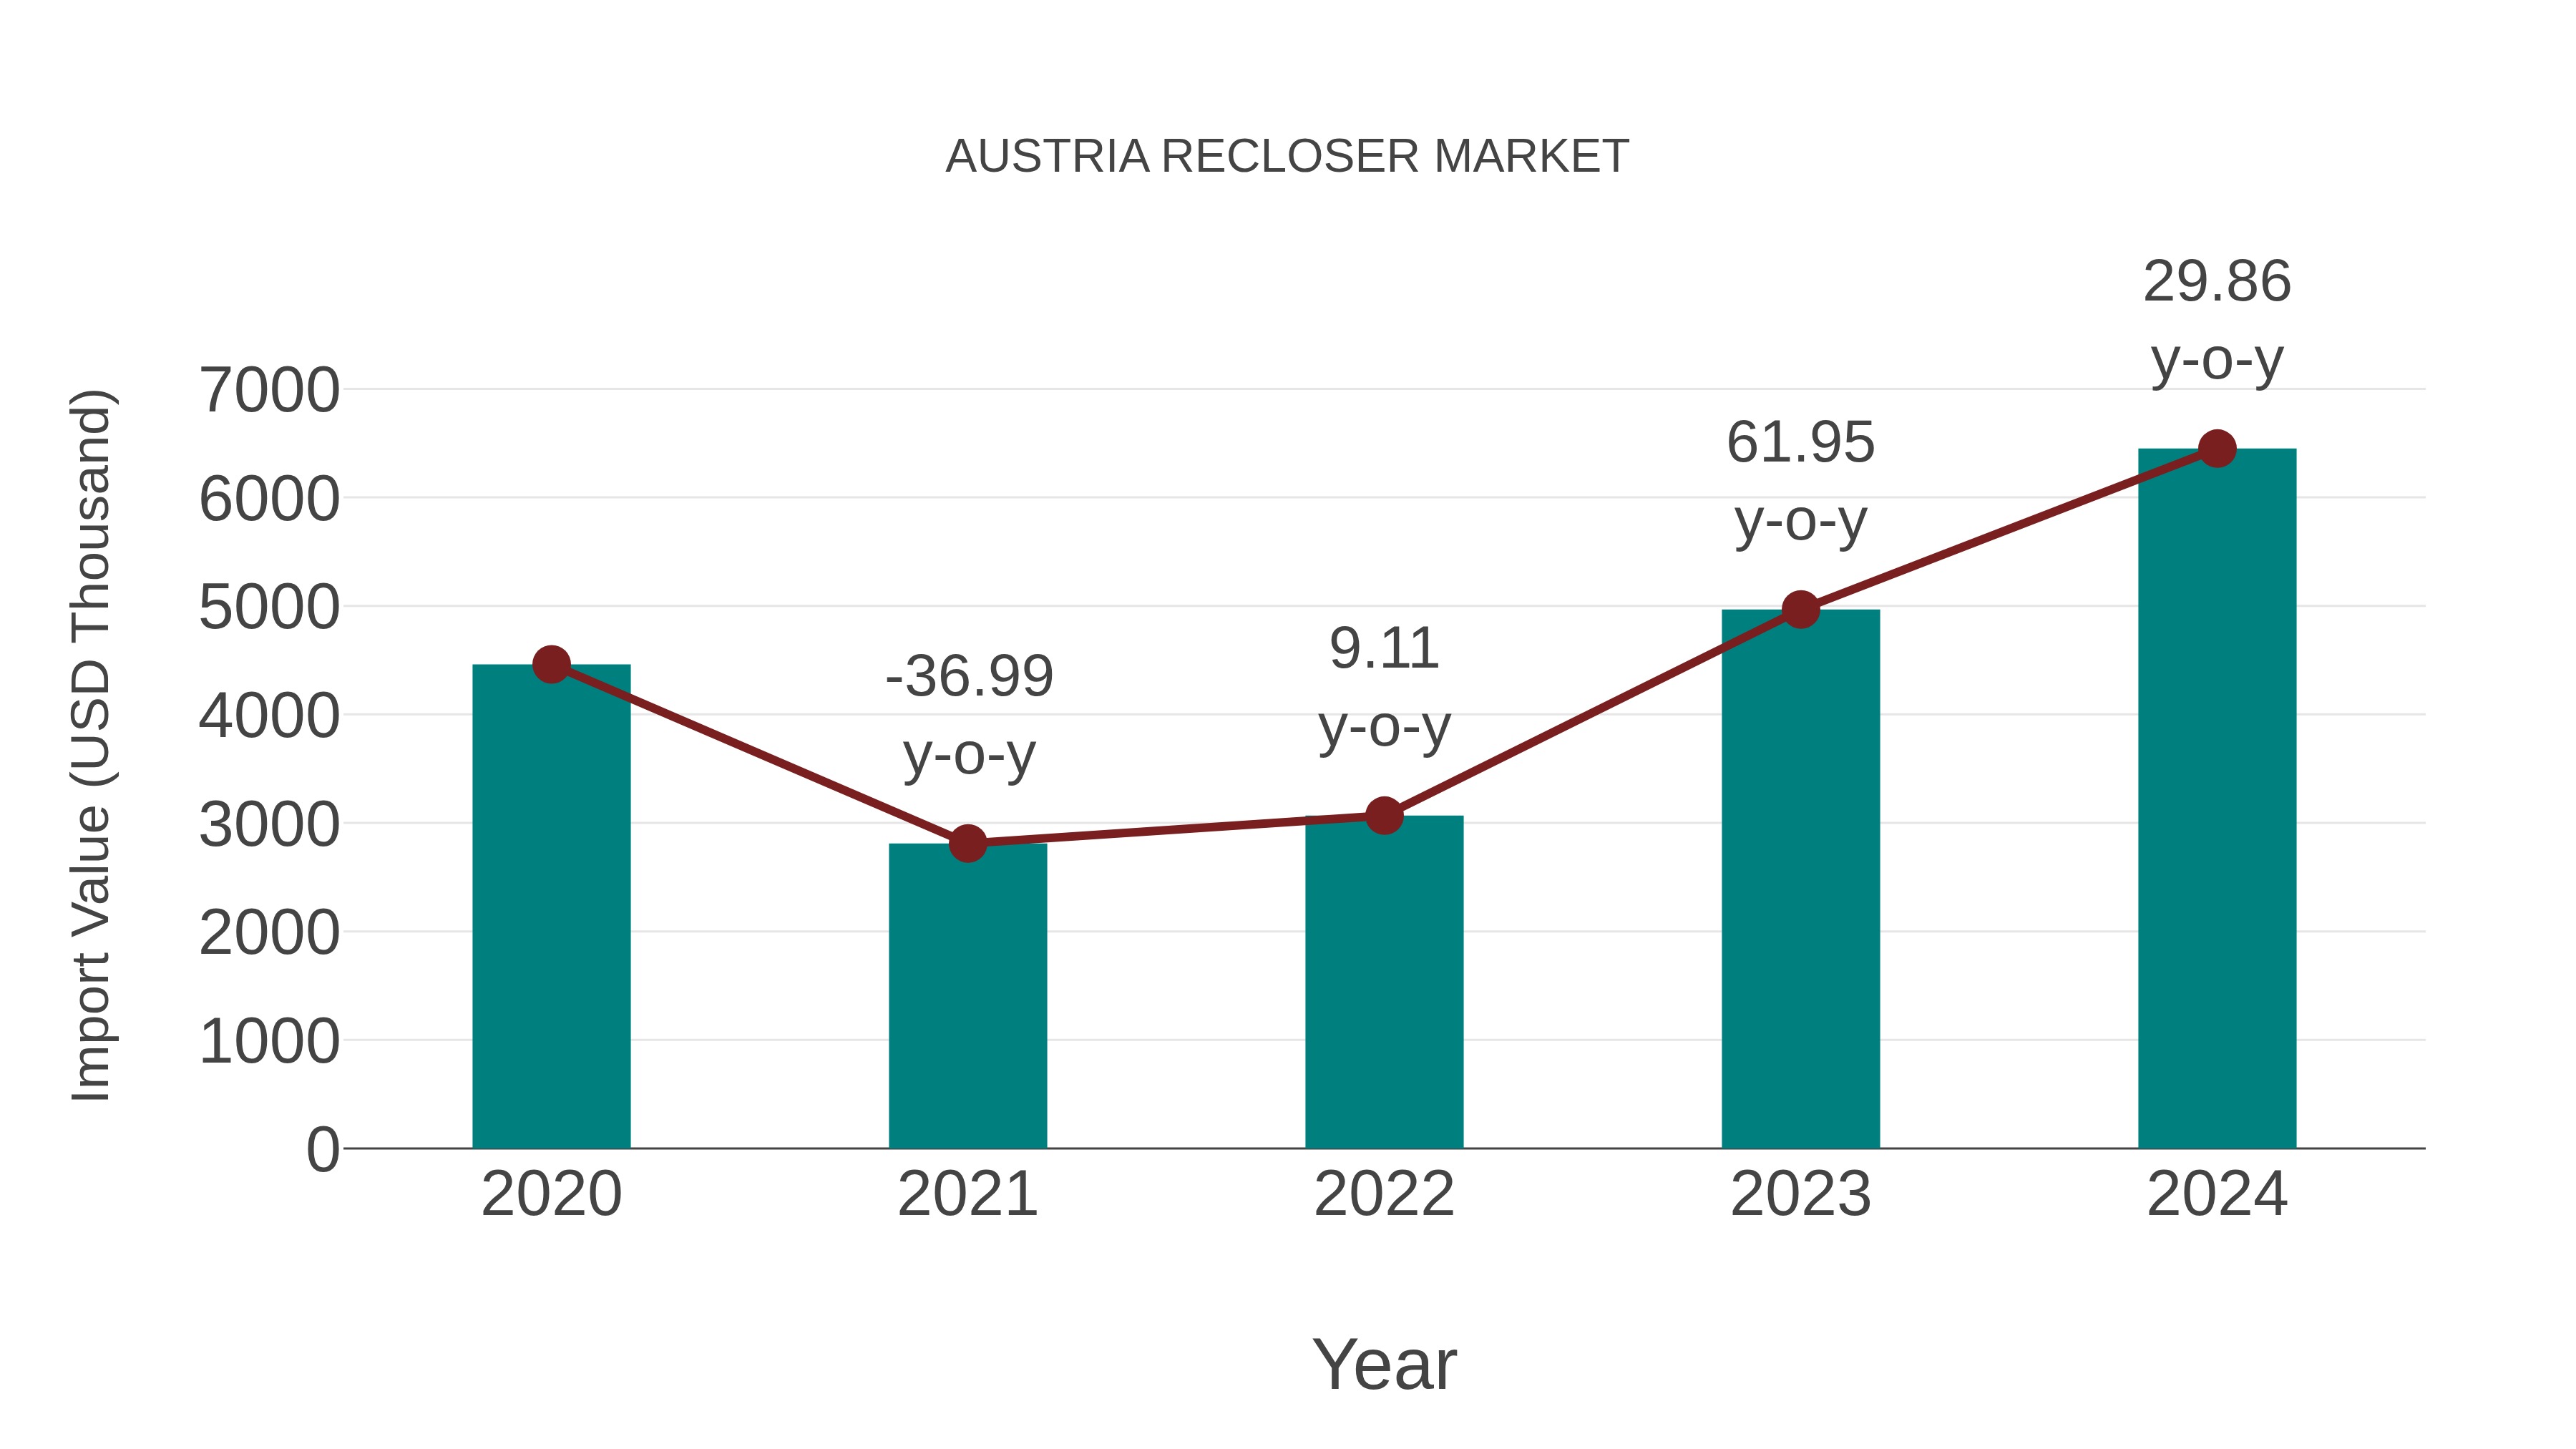
Austria Recloser Market: Import Trend Analysis
The import trend of Austria`s recloser market from 2020 to 2024 saw a Compound Annual Growth Rate (CAGR) of 9.66%. Notably, in 2023-2024, there was a significant year-on-year growth rate of 29.86%. These figures indicate a steady increase in imports over the specified period.
Austria Recloser Market Overview
Austria`s recloser market supports the country`s electrical infrastructure by providing automatic switching devices that protect power lines from short circuits and overloads. Reclosers are crucial for maintaining power quality and reliability in distribution networks. The market is driven by the modernization of the electrical grid and the integration of renewable energy sources.
Drivers of the market
The drivers of the Austria Recloser Market include the growing focus on enhancing the reliability and efficiency of power distribution networks. Reclosers play a crucial role in minimizing power outages by automatically isolating faulted sections of the grid and restoring service quickly. The increasing investments in smart grid projects and the expansion of renewable energy installations necessitate advanced recloser solutions. Additionally, regulatory mandates aimed at improving grid resilience and reducing downtime drive the adoption of reclosers. The development of technologically advanced and remotely controllable reclosers further propels market growth.
Challenges of the market
The recloser market in Austria is challenged by the need for continuous innovation to enhance the reliability and efficiency of recloser devices. The integration of smart grid technologies requires significant investment and technical expertise. Regulatory requirements and standards for safety and performance must be met, which can increase production and operational costs. The market also faces competition from substitute technologies and the need to educate and convince utility companies of the benefits of upgrading to modern recloser systems.
Government Policy of the market
Austrias recloser market is driven by government policies promoting the modernization and resilience of the national electricity infrastructure. Incentives for upgrading aging electrical networks and integrating smart grid technologies have boosted the adoption of reclosers. Additionally, safety and reliability standards set by the government ensure the continuous improvement and deployment of advanced recloser systems to enhance grid stability and minimize outage times.
Key Highlights of the Report:
- Austria Recloser Market Outlook
- Market Size of Austria Recloser Market, 2025
- Forecast of Austria Recloser Market, 2032
- Historical Data and Forecast of Austria Recloser Revenues & Volume for the Period 2022-2032F
- Austria Recloser Market Trend Evolution
- Austria Recloser Market Drivers and Challenges
- Austria Recloser Price Trends
- Austria Recloser Porter`s Five Forces
- Austria Recloser Industry Life Cycle
- Historical Data and Forecast of Austria Recloser Market Revenues & Volume By Phase Type for the Period 2022-2032F
- Historical Data and Forecast of Austria Recloser Market Revenues & Volume By Three Phase for the Period 2022-2032F
- Historical Data and Forecast of Austria Recloser Market Revenues & Volume By Single Phase for the Period 2022-2032F
- Historical Data and Forecast of Austria Recloser Market Revenues & Volume By Triple-single Phase for the Period 2022-2032F
- Historical Data and Forecast of Austria Recloser Market Revenues & Volume By Control Type for the Period 2022-2032F
- Historical Data and Forecast of Austria Recloser Market Revenues & Volume By Electronic for the Period 2022-2032F
- Historical Data and Forecast of Austria Recloser Market Revenues & Volume By Hydraulic for the Period 2022-2032F
- Historical Data and Forecast of Austria Recloser Market Revenues & Volume By Voltage Rating for the Period 2022-2032F
- Historical Data and Forecast of Austria Recloser Market Revenues & Volume By Up to 15 kV for the Period 2022-2032F
- Historical Data and Forecast of Austria Recloser Market Revenues & Volume By 16-27 kV for the Period 2022-2032F
- Historical Data and Forecast of Austria Recloser Market Revenues & Volume By 28-38 kV for the Period 2022-2032F
- Austria Recloser Import Export Trade Statistics
- Market Opportunity Assessment By Phase Type
- Market Opportunity Assessment By Control Type
- Market Opportunity Assessment By Voltage Rating
- Austria Recloser Top Companies Market Share
- Austria Recloser Competitive Benchmarking By Technical and Operational Parameters
- Austria Recloser Company Profiles
- Austria Recloser Key Strategic Recommendations
Austria Recloser Market (2026-2032): FAQs
6Wresearch actively monitors the Austria Recloser Market and publishes its comprehensive annual report, highlighting emerging trends, growth drivers, revenue analysis, and forecast outlook. Our insights help businesses to make data-backed strategic decisions with ongoing market dynamics. Our analysts track relevent industries related to the Austria Recloser Market, allowing our clients with actionable intelligence and reliable forecasts tailored to emerging regional needs.
Yes, we provide customisation as per your requirements. To learn more, feel free to contact us on sales@6wresearch.com
1 Executive Summary |
2 Introduction |
2.1 Key Highlights of the Report |
2.2 Report Description |
2.3 Market Scope & Segmentation |
2.4 Research Methodology |
2.5 Assumptions |
3 Austria Recloser Market Overview |
3.1 Austria Country Macro Economic Indicators |
3.2 Austria Recloser Market Revenues & Volume, 2022 & 2032F |
3.3 Austria Recloser Market - Industry Life Cycle |
3.4 Austria Recloser Market - Porter's Five Forces |
3.5 Austria Recloser Market Revenues & Volume Share, By Phase Type, 2022 & 2032F |
3.6 Austria Recloser Market Revenues & Volume Share, By Control Type, 2022 & 2032F |
3.7 Austria Recloser Market Revenues & Volume Share, By Voltage Rating, 2022 & 2032F |
4 Austria Recloser Market Dynamics |
4.1 Impact Analysis |
4.2 Market Drivers |
4.2.1 Increasing focus on grid reliability and efficiency |
4.2.2 Growing investments in smart grid infrastructure |
4.2.3 Technological advancements in recloser systems |
4.3 Market Restraints |
4.3.1 High initial costs associated with recloser installation |
4.3.2 Limited awareness and adoption of recloser technologies |
4.3.3 Regulatory challenges in the energy sector |
5 Austria Recloser Market Trends |
6 Austria Recloser Market Segmentations |
6.1 Austria Recloser Market, By Phase Type |
6.1.1 Overview and Analysis |
6.1.2 Austria Recloser Market Revenues & Volume, By Three Phase, 2022-2032F |
6.1.3 Austria Recloser Market Revenues & Volume, By Single Phase, 2022-2032F |
6.1.4 Austria Recloser Market Revenues & Volume, By Triple-single Phase, 2022-2032F |
6.2 Austria Recloser Market, By Control Type |
6.2.1 Overview and Analysis |
6.2.2 Austria Recloser Market Revenues & Volume, By Electronic , 2022-2032F |
6.2.3 Austria Recloser Market Revenues & Volume, By Hydraulic, 2022-2032F |
6.3 Austria Recloser Market, By Voltage Rating |
6.3.1 Overview and Analysis |
6.3.2 Austria Recloser Market Revenues & Volume, By Up to 15 kV, 2022-2032F |
6.3.3 Austria Recloser Market Revenues & Volume, By 16-27 kV, 2022-2032F |
6.3.4 Austria Recloser Market Revenues & Volume, By 28-38 kV, 2022-2032F |
7 Austria Recloser Market Import-Export Trade Statistics |
7.1 Austria Recloser Market Export to Major Countries |
7.2 Austria Recloser Market Imports from Major Countries |
8 Austria Recloser Market Key Performance Indicators |
8.1 Average age of recloser installations in Austria |
8.2 Frequency of grid disruptions and downtime |
8.3 Adoption rate of smart grid solutions in the country |
9 Austria Recloser Market - Opportunity Assessment |
9.1 Austria Recloser Market Opportunity Assessment, By Phase Type, 2022 & 2032F |
9.2 Austria Recloser Market Opportunity Assessment, By Control Type, 2022 & 2032F |
9.3 Austria Recloser Market Opportunity Assessment, By Voltage Rating, 2022 & 2032F |
10 Austria Recloser Market - Competitive Landscape |
10.1 Austria Recloser Market Revenue Share, By Companies, 2025 |
10.2 Austria Recloser Market Competitive Benchmarking, By Operating and Technical Parameters |
11 Company Profiles |
12 Recommendations | 13 Disclaimer |
Global Go To Market Strategy - 2030
Export potential enables firms to identify high-growth global markets with greater confidence by combining advanced trade intelligence with a structured quantitative methodology. The framework analyzes emerging demand trends and country-level import patterns while integrating macroeconomic and trade datasets such as GDP and population forecasts, bilateral import–export flows, tariff structures, elasticity differentials between developed and developing economies, geographic distance, and import demand projections. Using weighted trade values from 2020–2024 as the base period to project country-to-country export potential for 2030, these inputs are operationalized through calculated drivers such as gravity model parameters, tariff impact factors, and projected GDP per-capita growth. Through an analysis of hidden potentials, demand hotspots, and market conditions that are most favorable to success, this method enables firms to focus on target countries, maximize returns, and global expansion with data, backed by accuracy.
By factoring in the projected importer demand gap that is currently unmet and could be potential opportunity, it identifies the potential for the Exporter (Country) among 190 countries, against the general trade analysis, which identifies the biggest importer or exporter.
To discover high-growth global markets and optimize your business strategy:
Click Here
Pricing
- Single User License$ 1,995
- Department License$ 2,400
- Site License$ 3,120
- Global License$ 3,795

Leadership Perspectives from Industry Events
Search
Thought Leadership and Analyst Meet


Our Clients
6WResearch In News
- Doha a strategic location for EV manufacturing hub: IPA Qatar
- Demand for luxury TVs surging in the GCC, says Samsung
- Empowering Growth: The Thriving Journey of Bangladesh’s Cable Industry
- Demand for luxury TVs surging in the GCC, says Samsung
- Video call with a traditional healer? Once unthinkable, it’s now common in South Africa
- Intelligent Buildings To Smooth GCC’s Path To Net Zero
Latest Reports
- Cape Verde Portable Hand-Thrown Extinguisher Market (2026-2032)
- Canada Portable Hand-Thrown Extinguisher Market (2026-2032)
- Cameroon Portable Hand-Thrown Extinguisher Market (2026-2032)
- Burundi Portable Hand-Thrown Extinguisher Market (2026-2032)
- Burkina Faso Portable Hand-Thrown Extinguisher Market (2026-2032)
- Bulgaria Portable Hand-Thrown Extinguisher Market (2026-2032)
- Brunei Portable Hand-Thrown Extinguisher Market (2026-2032)
- Botswana Portable Hand-Thrown Extinguisher Market (2026-2032)
- Bosnia and Herzegovina Portable Hand-Thrown Extinguisher Market (2026-2032)
- Bolivia Portable Hand-Thrown Extinguisher Market (2026-2032)
Industry Events and Analyst Meet

HIMTEX 2026

India Refining Summit 2026

India EV Show 2026

EV tech India Expo 2026

Auto Tech Asia 2026
Whitepaper
- Middle East & Africa Commercial Security Market Click here to view more.
- Middle East & Africa Fire Safety Systems & Equipment Market Click here to view more.
- GCC Drone Market Click here to view more.
- Middle East Lighting Fixture Market Click here to view more.
- GCC Physical & Perimeter Security Market Click here to view more.