Austria Sodium Thiosulfate Market (2026-2032) | Competitive, Share, Value, Size, Drivers, Segmentation, Trends, Pricing Analysis, Companies, Forecast, Analysis, Supply, Competition, Challenges, Strategic Insights, Consumer Insights, Opportunities, Restraints, Demand, Investment Trends, Segments, Strategy, Growth, Industry, Outlook, Revenue
Market Forecast By Form (Powder, Granular, Liquid, Crystalline), By Application (Medical Detoxification, Water Dechlorination, Photography, Gold Extraction), By Manufacturing Process (Sulfur Reduction, Electrolytic Process, Chemical Synthesis, Sulfite Process), By End User (Pharmaceuticals, Water Treatment, Photography Industry, Mining Industry), By Packaging Type (Bags, Drums, Containers, Bulk Storage) And Competitive Landscape
| Product Code: ETC10860606 | Publication Date: Apr 2025 | Updated Date: Apr 2026 | Product Type: Market Research Report | |
| Publisher: 6Wresearch | No. of Pages: 65 | No. of Figures: 34 | No. of Tables: 19 | |
Austria Sodium Thiosulfate Market Size (2020-2030)
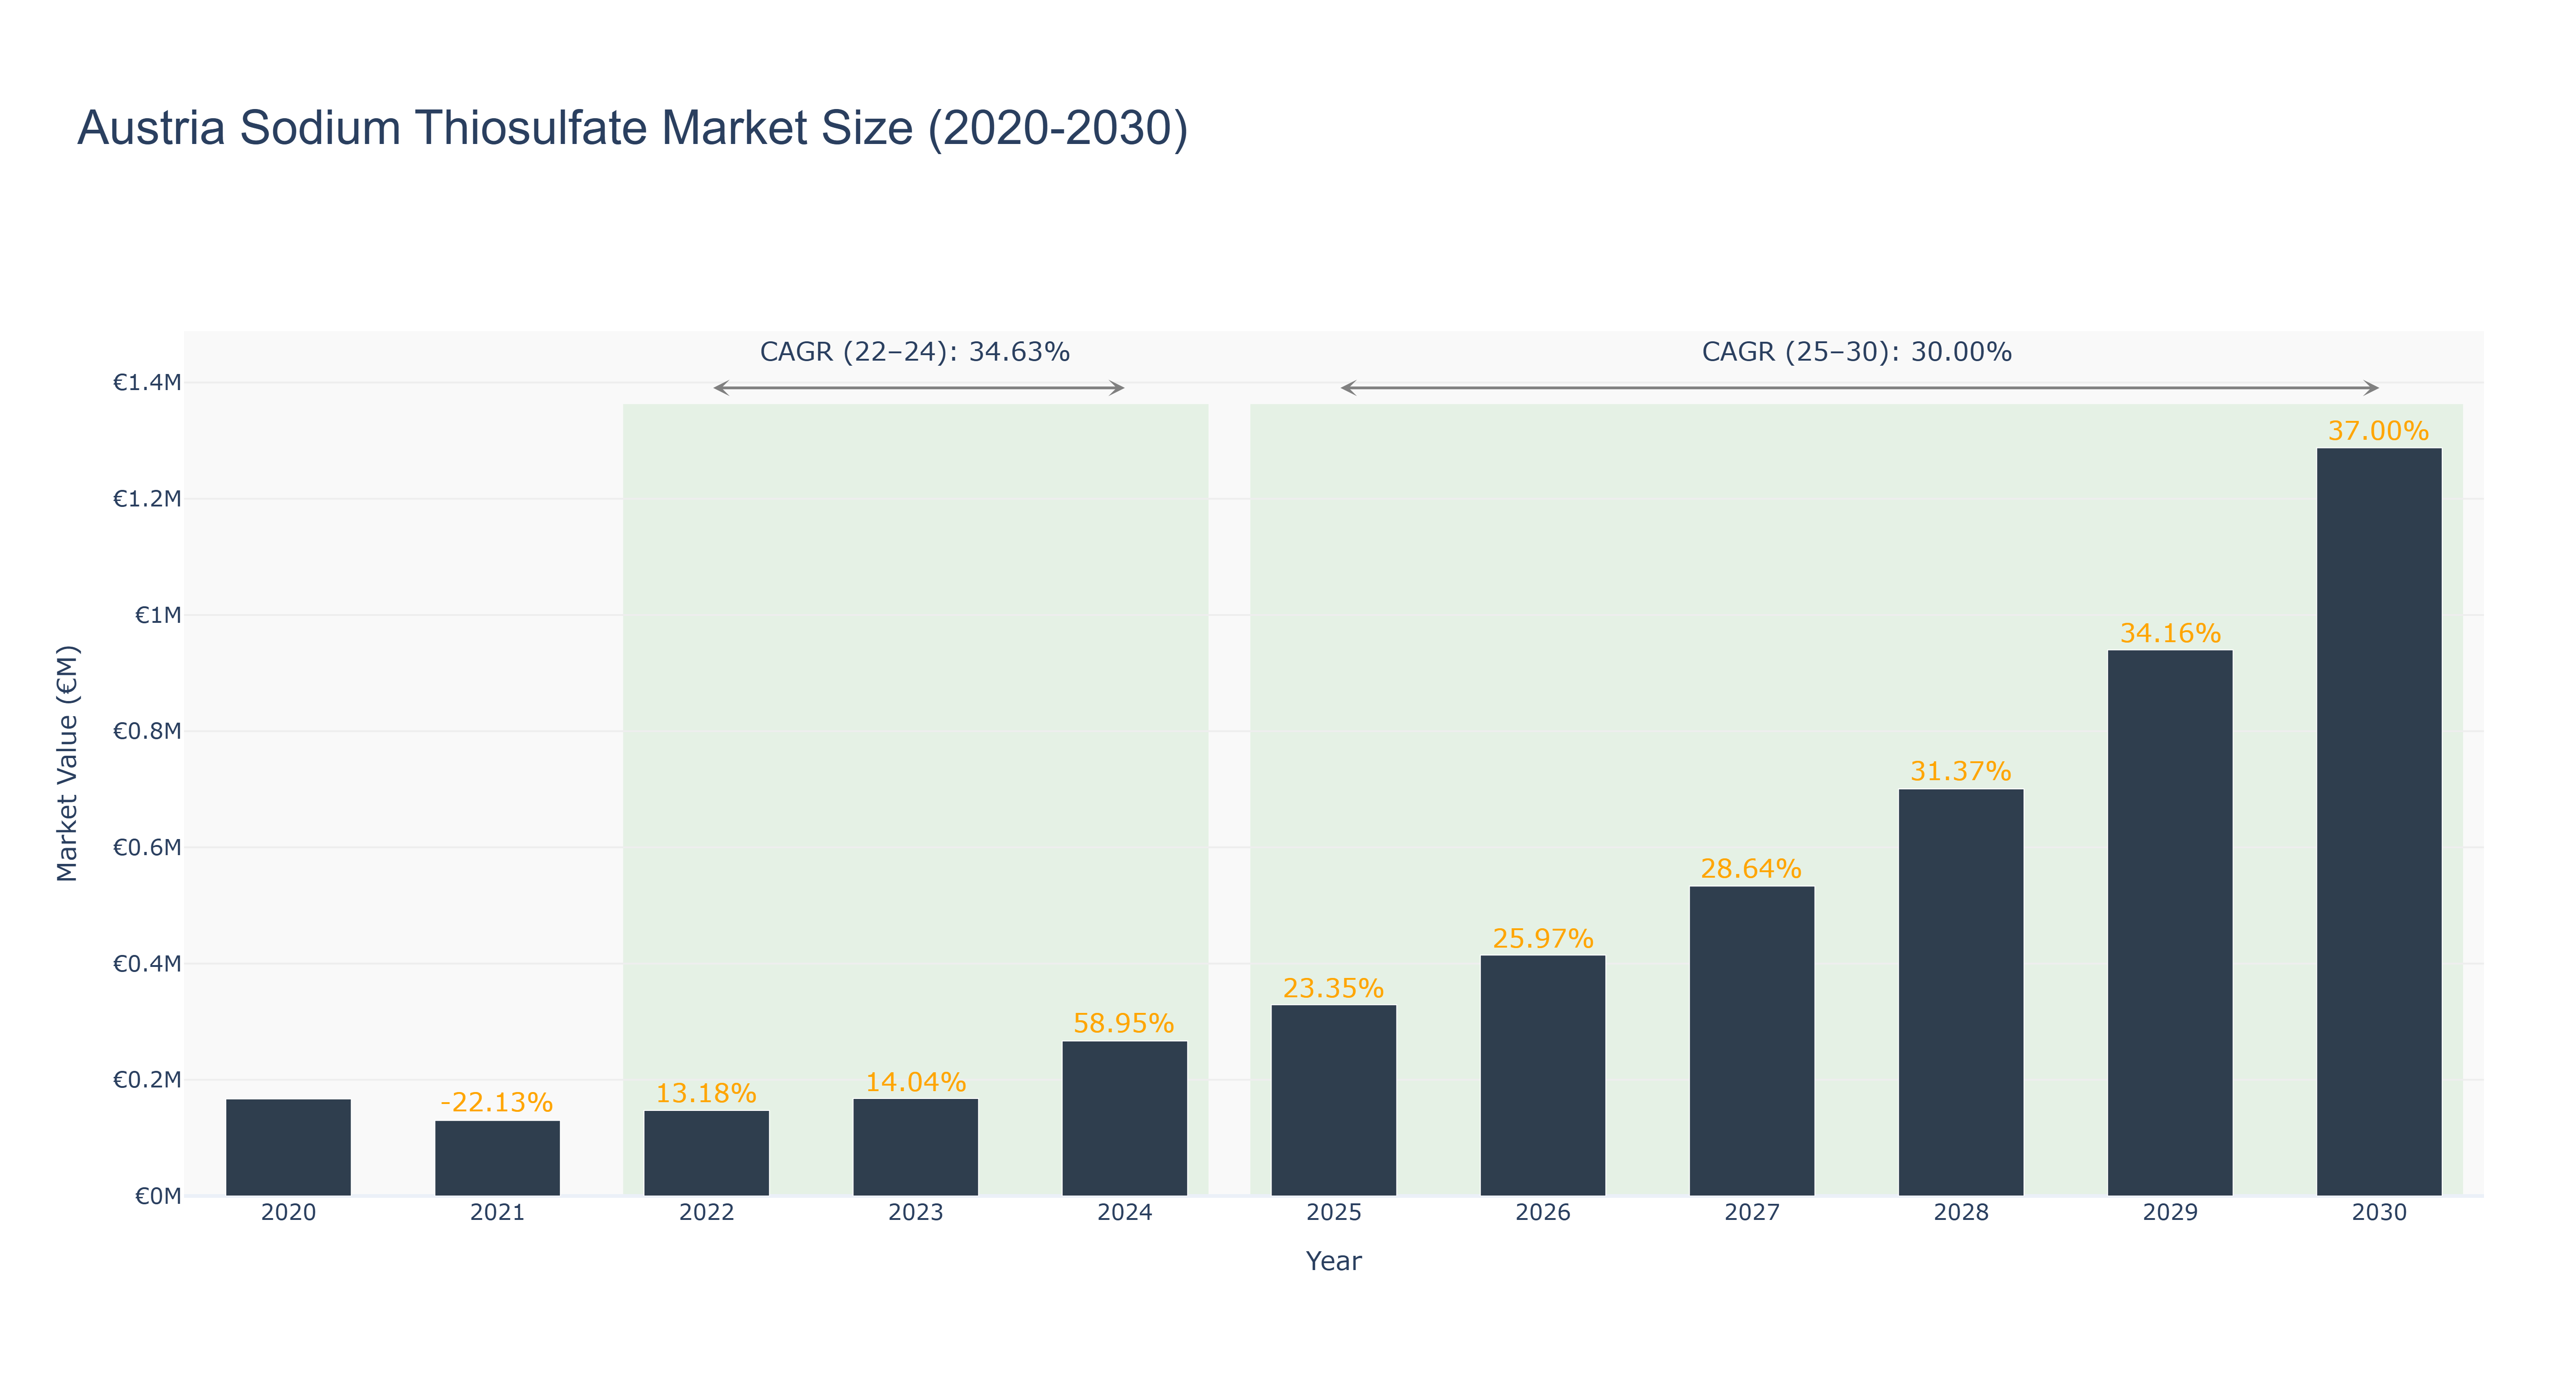
The Austria Sodium Thiosulfate Market has shown a fluctuating trend over the past decade. The market peaked in 2030 with a size of €1.29 million, reflecting a strong growth trajectory. From 2020 to 2024, the market size increased steadily, with a notable surge in 2024 to €0.27 million. However, the market experienced a slight decline in 2021 and 2022 before rebounding in later years. The CAGR for the period 2022-24 was 34.63%, indicating rapid growth during that time frame. Looking ahead, the forecasted CAGR for 2025-30 is 30.0%, suggesting continued robust expansion. Industry drivers such as increasing demand for sodium thiosulfate in various applications contribute to this growth. Recent developments in Austria include investments in sustainable production processes for sodium thiosulfate, paving the way for future advancements in the market.
Austria Sodium Thiosulfate Market: Production & Trade Performance (2019-2025)
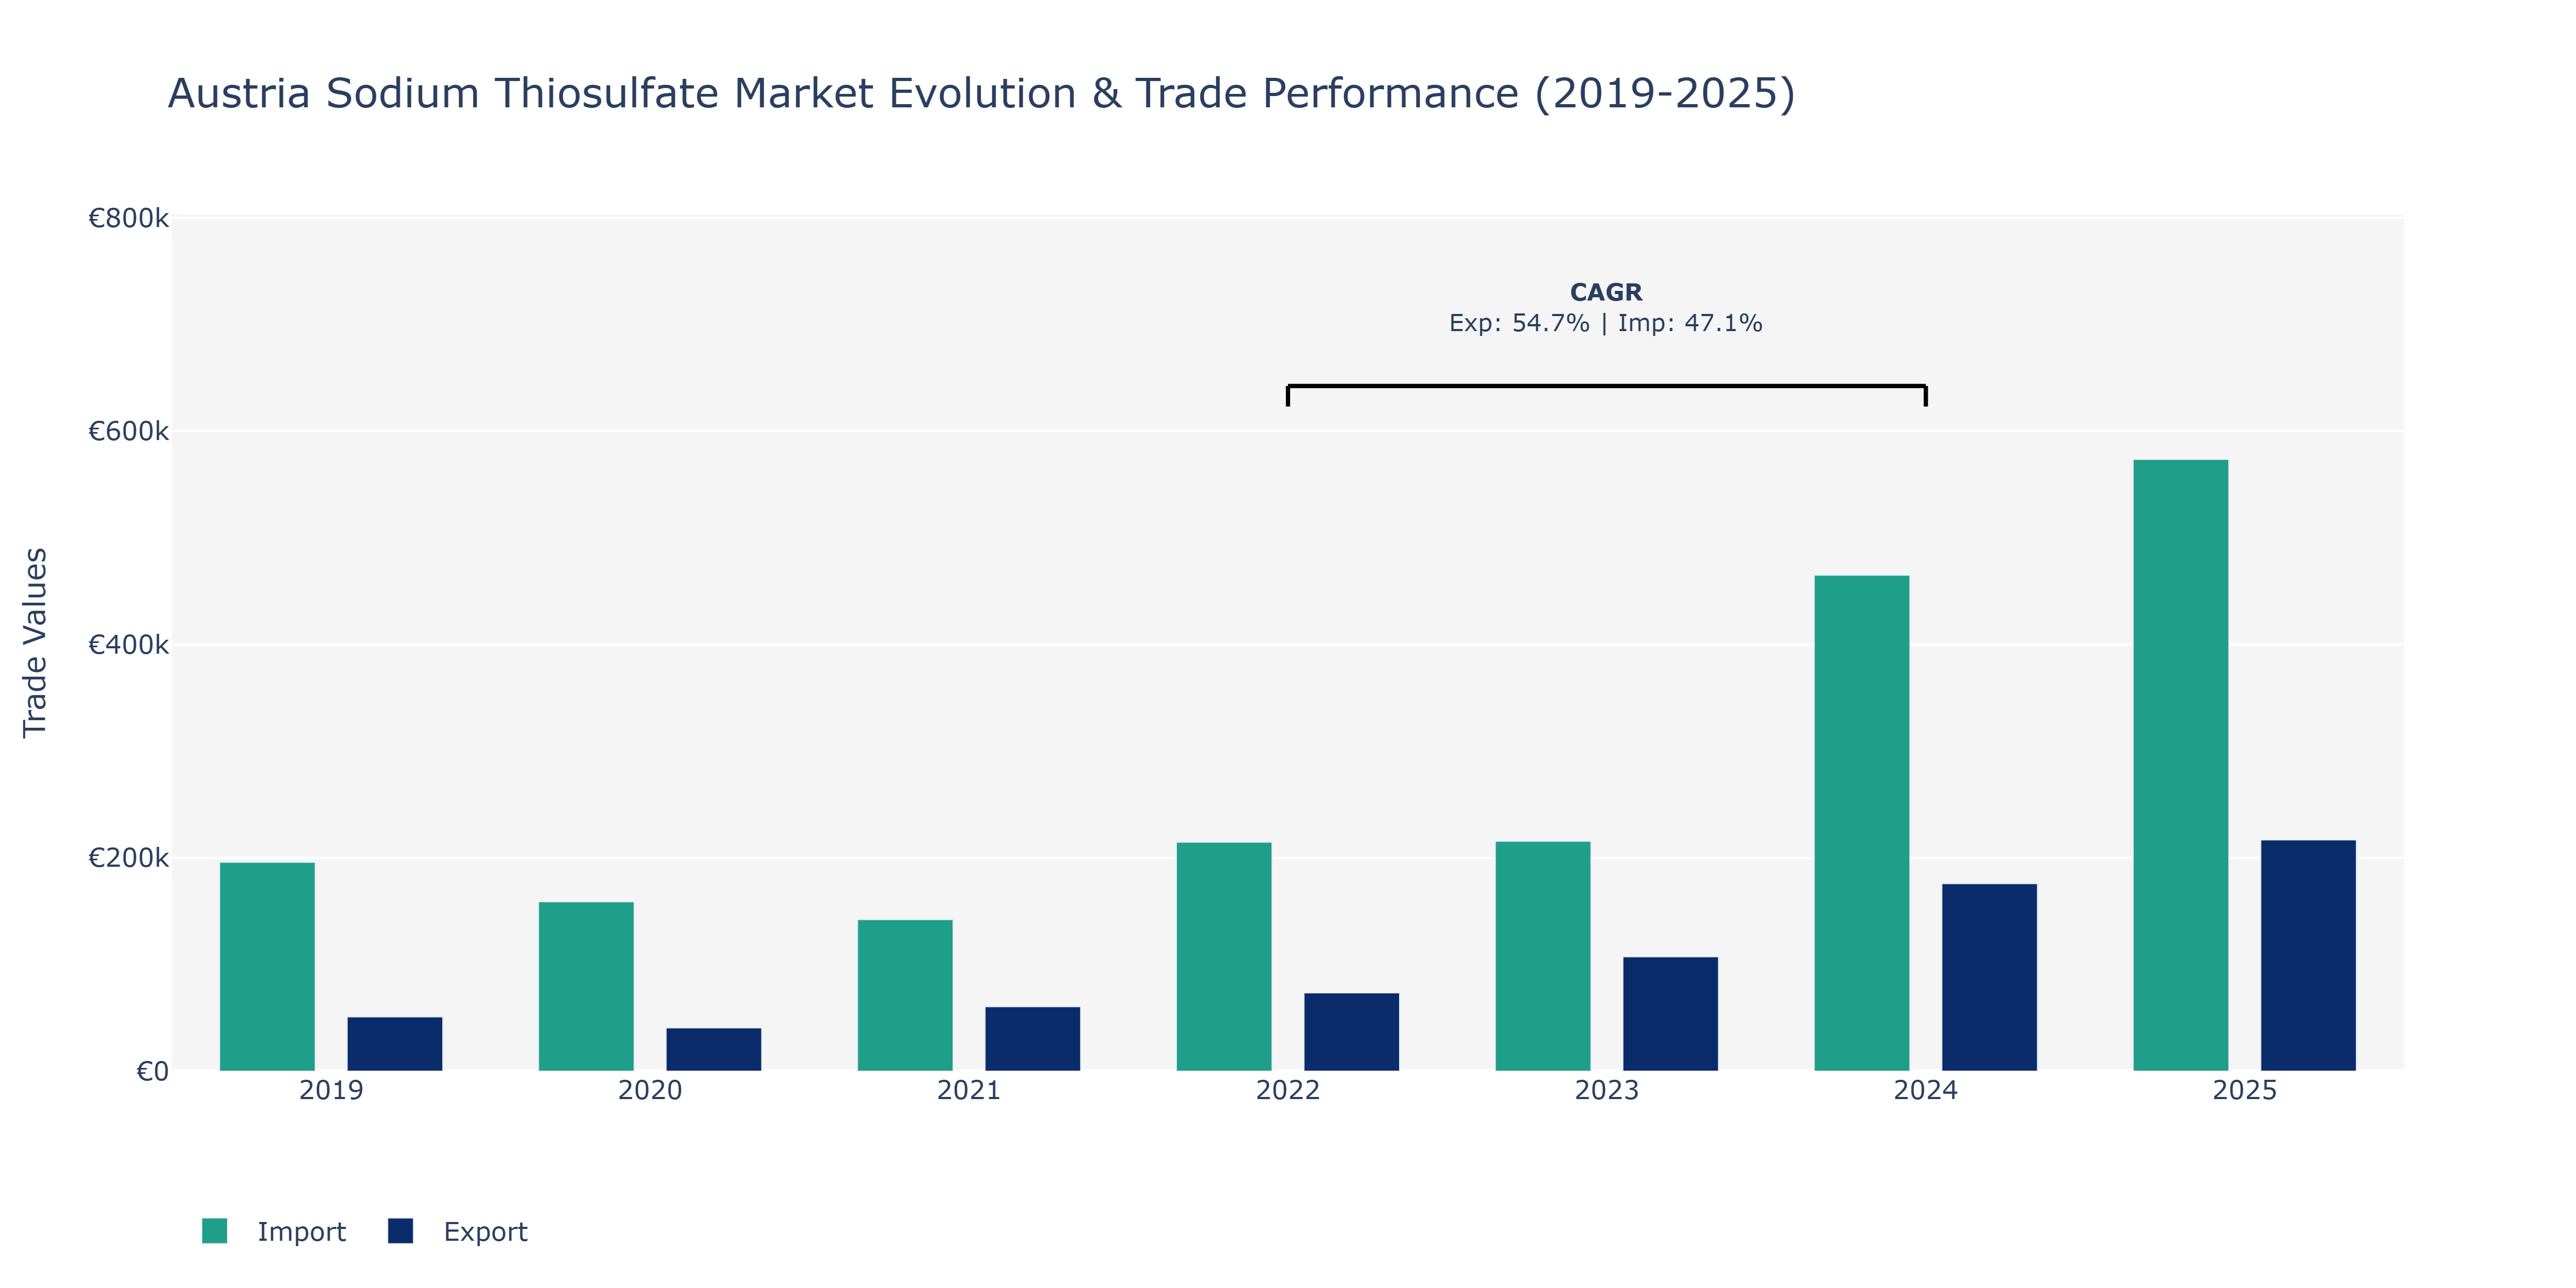
Between 2019 and 2025, Austria's Sodium Thiosulfate market witnessed notable shifts in exports and imports. Export value started at €50.98 thousand in 2019 and steadily increased to €216.81 thousand in 2025, showing a consistent upward trajectory driven by growing demand for the product globally. On the imports side, 2019 began with €195.85 thousand, decreased in 2020 to €158.87 thousand, and then gradually rebounded to €573.48 thousand in 2025. The peak export value of €175.76 thousand in 2024 and the peak import value of €464.9 thousand in the same year indicate significant market activity during that period. These fluctuations can be attributed to various factors such as evolving trade agreements, changes in consumer preferences, and advancements in sodium thiosulfate applications across industries. The CAGR of 54.72% for exports and 47.14% for imports from 2022 to 2024 underscores the market's rapid growth and increased integration into global trade networks, aligning with the broader trends of industrial expansion and technological advancements in the chemical sector.
Key Highlights of the Report:
- Austria Sodium Thiosulfate Market Outlook
- Market Size of Austria Sodium Thiosulfate Market, 2025
- Forecast of Austria Sodium Thiosulfate Market, 2032
- Historical Data and Forecast of Austria Sodium Thiosulfate Revenues & Volume for the Period 2022-2032F
- Austria Sodium Thiosulfate Market Trend Evolution
- Austria Sodium Thiosulfate Market Drivers and Challenges
- Austria Sodium Thiosulfate Price Trends
- Austria Sodium Thiosulfate Porter's Five Forces
- Austria Sodium Thiosulfate Industry Life Cycle
- Historical Data and Forecast of Austria Sodium Thiosulfate Market Revenues & Volume By Form for the Period 2022-2032F
- Historical Data and Forecast of Austria Sodium Thiosulfate Market Revenues & Volume By Powder for the Period 2022-2032F
- Historical Data and Forecast of Austria Sodium Thiosulfate Market Revenues & Volume By Granular for the Period 2022-2032F
- Historical Data and Forecast of Austria Sodium Thiosulfate Market Revenues & Volume By Liquid for the Period 2022-2032F
- Historical Data and Forecast of Austria Sodium Thiosulfate Market Revenues & Volume By Crystalline for the Period 2022-2032F
- Historical Data and Forecast of Austria Sodium Thiosulfate Market Revenues & Volume By Application for the Period 2022-2032F
- Historical Data and Forecast of Austria Sodium Thiosulfate Market Revenues & Volume By Medical Detoxification for the Period 2022-2032F
- Historical Data and Forecast of Austria Sodium Thiosulfate Market Revenues & Volume By Water Dechlorination for the Period 2022-2032F
- Historical Data and Forecast of Austria Sodium Thiosulfate Market Revenues & Volume By Photography for the Period 2022-2032F
- Historical Data and Forecast of Austria Sodium Thiosulfate Market Revenues & Volume By Gold Extraction for the Period 2022-2032F
- Historical Data and Forecast of Austria Sodium Thiosulfate Market Revenues & Volume By Manufacturing Process for the Period 2022-2032F
- Historical Data and Forecast of Austria Sodium Thiosulfate Market Revenues & Volume By Sulfur Reduction for the Period 2022-2032F
- Historical Data and Forecast of Austria Sodium Thiosulfate Market Revenues & Volume By Electrolytic Process for the Period 2022-2032F
- Historical Data and Forecast of Austria Sodium Thiosulfate Market Revenues & Volume By Chemical Synthesis for the Period 2022-2032F
- Historical Data and Forecast of Austria Sodium Thiosulfate Market Revenues & Volume By Sulfite Process for the Period 2022-2032F
- Historical Data and Forecast of Austria Sodium Thiosulfate Market Revenues & Volume By End User for the Period 2022-2032F
- Historical Data and Forecast of Austria Sodium Thiosulfate Market Revenues & Volume By Pharmaceuticals for the Period 2022-2032F
- Historical Data and Forecast of Austria Sodium Thiosulfate Market Revenues & Volume By Water Treatment for the Period 2022-2032F
- Historical Data and Forecast of Austria Sodium Thiosulfate Market Revenues & Volume By Photography Industry for the Period 2022-2032F
- Historical Data and Forecast of Austria Sodium Thiosulfate Market Revenues & Volume By Mining Industry for the Period 2022-2032F
- Historical Data and Forecast of Austria Sodium Thiosulfate Market Revenues & Volume By Packaging Type for the Period 2022-2032F
- Historical Data and Forecast of Austria Sodium Thiosulfate Market Revenues & Volume By Bags for the Period 2022-2032F
- Historical Data and Forecast of Austria Sodium Thiosulfate Market Revenues & Volume By Drums for the Period 2022-2032F
- Historical Data and Forecast of Austria Sodium Thiosulfate Market Revenues & Volume By Containers for the Period 2022-2032F
- Historical Data and Forecast of Austria Sodium Thiosulfate Market Revenues & Volume By Bulk Storage for the Period 2022 - 2032F
- Austria Sodium Thiosulfate Import Export Trade Statistics
- Market Opportunity Assessment By Form
- Market Opportunity Assessment By Application
- Market Opportunity Assessment By Manufacturing Process
- Market Opportunity Assessment By End User
- Market Opportunity Assessment By Packaging Type
- Austria Sodium Thiosulfate Top Companies Market Share
- Austria Sodium Thiosulfate Competitive Benchmarking By Technical and Operational Parameters
- Austria Sodium Thiosulfate Company Profiles
- Austria Sodium Thiosulfate Key Strategic Recommendations
Frequently Asked Questions About the Market Study (FAQs):
6Wresearch actively monitors the Austria Sodium Thiosulfate Market and publishes its comprehensive annual report, highlighting emerging trends, growth drivers, revenue analysis, and forecast outlook. Our insights help businesses to make data-backed strategic decisions with ongoing market dynamics. Our analysts track relevent industries related to the Austria Sodium Thiosulfate Market, allowing our clients with actionable intelligence and reliable forecasts tailored to emerging regional needs.
Yes, we provide customisation as per your requirements. To learn more, feel free to contact us on sales@6wresearch.com
1 Executive Summary |
2 Introduction |
2.1 Key Highlights of the Report |
2.2 Report Description |
2.3 Market Scope & Segmentation |
2.4 Research Methodology |
2.5 Assumptions |
3 Austria Sodium Thiosulfate Market Overview |
3.1 Austria Country Macro Economic Indicators |
3.2 Austria Sodium Thiosulfate Market Revenues & Volume, 2022 & 2032F |
3.3 Austria Sodium Thiosulfate Market - Industry Life Cycle |
3.4 Austria Sodium Thiosulfate Market - Porter's Five Forces |
3.5 Austria Sodium Thiosulfate Market Revenues & Volume Share, By Form, 2022 & 2032F |
3.6 Austria Sodium Thiosulfate Market Revenues & Volume Share, By Application, 2022 & 2032F |
3.7 Austria Sodium Thiosulfate Market Revenues & Volume Share, By Manufacturing Process, 2022 & 2032F |
3.8 Austria Sodium Thiosulfate Market Revenues & Volume Share, By End User, 2022 & 2032F |
3.9 Austria Sodium Thiosulfate Market Revenues & Volume Share, By Packaging Type, 2022 & 2032F |
4 Austria Sodium Thiosulfate Market Dynamics |
4.1 Impact Analysis |
4.2 Market Drivers |
4.2.1 Increasing demand for sodium thiosulfate in the photography industry for film processing |
4.2.2 Growing applications in the medical sector for cyanide poisoning treatment |
4.2.3 Rising adoption in the water treatment industry for dechlorination purposes |
4.3 Market Restraints |
4.3.1 Fluctuating raw material prices impacting production costs |
4.3.2 Environmental concerns regarding the disposal of sodium thiosulfate waste |
4.3.3 Competition from alternative chemicals with similar properties |
5 Austria Sodium Thiosulfate Market Trends |
6 Austria Sodium Thiosulfate Market, By Types |
6.1 Austria Sodium Thiosulfate Market, By Form |
6.1.1 Overview and Analysis |
6.1.2 Austria Sodium Thiosulfate Market Revenues & Volume, By Form, 2022 - 2032F |
6.1.3 Austria Sodium Thiosulfate Market Revenues & Volume, By Powder, 2022 - 2032F |
6.1.4 Austria Sodium Thiosulfate Market Revenues & Volume, By Granular, 2022 - 2032F |
6.1.5 Austria Sodium Thiosulfate Market Revenues & Volume, By Liquid, 2022 - 2032F |
6.1.6 Austria Sodium Thiosulfate Market Revenues & Volume, By Crystalline, 2022 - 2032F |
6.2 Austria Sodium Thiosulfate Market, By Application |
6.2.1 Overview and Analysis |
6.2.2 Austria Sodium Thiosulfate Market Revenues & Volume, By Medical Detoxification, 2022 - 2032F |
6.2.3 Austria Sodium Thiosulfate Market Revenues & Volume, By Water Dechlorination, 2022 - 2032F |
6.2.4 Austria Sodium Thiosulfate Market Revenues & Volume, By Photography, 2022 - 2032F |
6.2.5 Austria Sodium Thiosulfate Market Revenues & Volume, By Gold Extraction, 2022 - 2032F |
6.3 Austria Sodium Thiosulfate Market, By Manufacturing Process |
6.3.1 Overview and Analysis |
6.3.2 Austria Sodium Thiosulfate Market Revenues & Volume, By Sulfur Reduction, 2022 - 2032F |
6.3.3 Austria Sodium Thiosulfate Market Revenues & Volume, By Electrolytic Process, 2022 - 2032F |
6.3.4 Austria Sodium Thiosulfate Market Revenues & Volume, By Chemical Synthesis, 2022 - 2032F |
6.3.5 Austria Sodium Thiosulfate Market Revenues & Volume, By Sulfite Process, 2022 - 2032F |
6.4 Austria Sodium Thiosulfate Market, By End User |
6.4.1 Overview and Analysis |
6.4.2 Austria Sodium Thiosulfate Market Revenues & Volume, By Pharmaceuticals, 2022 - 2032F |
6.4.3 Austria Sodium Thiosulfate Market Revenues & Volume, By Water Treatment, 2022 - 2032F |
6.4.4 Austria Sodium Thiosulfate Market Revenues & Volume, By Photography Industry, 2022 - 2032F |
6.4.5 Austria Sodium Thiosulfate Market Revenues & Volume, By Mining Industry, 2022 - 2032F |
6.5 Austria Sodium Thiosulfate Market, By Packaging Type |
6.5.1 Overview and Analysis |
6.5.2 Austria Sodium Thiosulfate Market Revenues & Volume, By Bags, 2022 - 2032F |
6.5.3 Austria Sodium Thiosulfate Market Revenues & Volume, By Drums, 2022 - 2032F |
6.5.4 Austria Sodium Thiosulfate Market Revenues & Volume, By Containers, 2022 - 2032F |
6.5.5 Austria Sodium Thiosulfate Market Revenues & Volume, By Bulk Storage, 2022 - 2032F |
7 Austria Sodium Thiosulfate Market Import-Export Trade Statistics |
7.1 Austria Sodium Thiosulfate Market Export to Major Countries |
7.2 Austria Sodium Thiosulfate Market Imports from Major Countries |
8 Austria Sodium Thiosulfate Market Key Performance Indicators |
8.1 Research and development investment in new applications for sodium thiosulfate |
8.2 Number of patents filed for sodium thiosulfate-related innovations |
8.3 Adoption rate of sodium thiosulfate in emerging industries |
8.4 Efficiency of waste management practices for sodium thiosulfate production |
8.5 Regulatory compliance adherence in the sodium thiosulfate market |
9 Austria Sodium Thiosulfate Market - Opportunity Assessment |
9.1 Austria Sodium Thiosulfate Market Opportunity Assessment, By Form, 2022 & 2032F |
9.2 Austria Sodium Thiosulfate Market Opportunity Assessment, By Application, 2022 & 2032F |
9.3 Austria Sodium Thiosulfate Market Opportunity Assessment, By Manufacturing Process, 2022 & 2032F |
9.4 Austria Sodium Thiosulfate Market Opportunity Assessment, By End User, 2022 & 2032F |
9.5 Austria Sodium Thiosulfate Market Opportunity Assessment, By Packaging Type, 2022 & 2032F |
10 Austria Sodium Thiosulfate Market - Competitive Landscape |
10.1 Austria Sodium Thiosulfate Market Revenue Share, By Companies, 2025 |
10.2 Austria Sodium Thiosulfate Market Competitive Benchmarking, By Operating and Technical Parameters |
11 Company Profiles |
12 Recommendations |
13 Disclaimer |
Global Go To Market Strategy - 2030
Export potential enables firms to identify high-growth global markets with greater confidence by combining advanced trade intelligence with a structured quantitative methodology. The framework analyzes emerging demand trends and country-level import patterns while integrating macroeconomic and trade datasets such as GDP and population forecasts, bilateral import–export flows, tariff structures, elasticity differentials between developed and developing economies, geographic distance, and import demand projections. Using weighted trade values from 2020–2024 as the base period to project country-to-country export potential for 2030, these inputs are operationalized through calculated drivers such as gravity model parameters, tariff impact factors, and projected GDP per-capita growth. Through an analysis of hidden potentials, demand hotspots, and market conditions that are most favorable to success, this method enables firms to focus on target countries, maximize returns, and global expansion with data, backed by accuracy.
By factoring in the projected importer demand gap that is currently unmet and could be potential opportunity, it identifies the potential for the Exporter (Country) among 190 countries, against the general trade analysis, which identifies the biggest importer or exporter.
To discover high-growth global markets and optimize your business strategy:
Click Here
Pricing
- Single User License$ 1,995
- Department License$ 2,400
- Site License$ 3,120
- Global License$ 3,795

Leadership Perspectives from Industry Events
Search
Thought Leadership and Analyst Meet


Our Clients
6WResearch In News
- Doha a strategic location for EV manufacturing hub: IPA Qatar
- Demand for luxury TVs surging in the GCC, says Samsung
- Empowering Growth: The Thriving Journey of Bangladesh’s Cable Industry
- Demand for luxury TVs surging in the GCC, says Samsung
- Video call with a traditional healer? Once unthinkable, it’s now common in South Africa
- Intelligent Buildings To Smooth GCC’s Path To Net Zero
Latest Reports
- Cape Verde Portable Hand-Thrown Extinguisher Market (2026-2032)
- Canada Portable Hand-Thrown Extinguisher Market (2026-2032)
- Cameroon Portable Hand-Thrown Extinguisher Market (2026-2032)
- Burundi Portable Hand-Thrown Extinguisher Market (2026-2032)
- Burkina Faso Portable Hand-Thrown Extinguisher Market (2026-2032)
- Bulgaria Portable Hand-Thrown Extinguisher Market (2026-2032)
- Brunei Portable Hand-Thrown Extinguisher Market (2026-2032)
- Botswana Portable Hand-Thrown Extinguisher Market (2026-2032)
- Bosnia and Herzegovina Portable Hand-Thrown Extinguisher Market (2026-2032)
- Bolivia Portable Hand-Thrown Extinguisher Market (2026-2032)
Industry Events and Analyst Meet

HIMTEX 2026

India Refining Summit 2026

India EV Show 2026

EV tech India Expo 2026

Auto Tech Asia 2026
Whitepaper
- Middle East & Africa Commercial Security Market Click here to view more.
- Middle East & Africa Fire Safety Systems & Equipment Market Click here to view more.
- GCC Drone Market Click here to view more.
- Middle East Lighting Fixture Market Click here to view more.
- GCC Physical & Perimeter Security Market Click here to view more.