Azerbaijan Energy Saving & Fluorescent Market (2026-2032) | Size, Value, Analysis, Forecast, Companies, Trends, Share, Outlook, Growth, Industry & Revenue
Market Forecast By Sources (High-Intensity Discharge Lamps (HID), Linear Fluorescent Lamps (LFL), Light Emitting Diodes (LED)), By Applications (Commercial, Residential, Government) And Competitive Landscape
| Product Code: ETC005117 | Publication Date: Sep 2020 | Updated Date: Jun 2026 | Product Type: Report | |
| Publisher: 6Wresearch | Author: Ravi Bhandari | No. of Pages: 70 | No. of Figures: 35 | No. of Tables: 5 |
Azerbaijan Energy Saving & Fluorescent Market Summary
The azerbaijan energy saving & fluorescent market was estimated at USD 1169 Million in 2025 and is projected to reach USD 1939 Million by 2032, growing at a CAGR of 8.6% from 2026 to 2032.
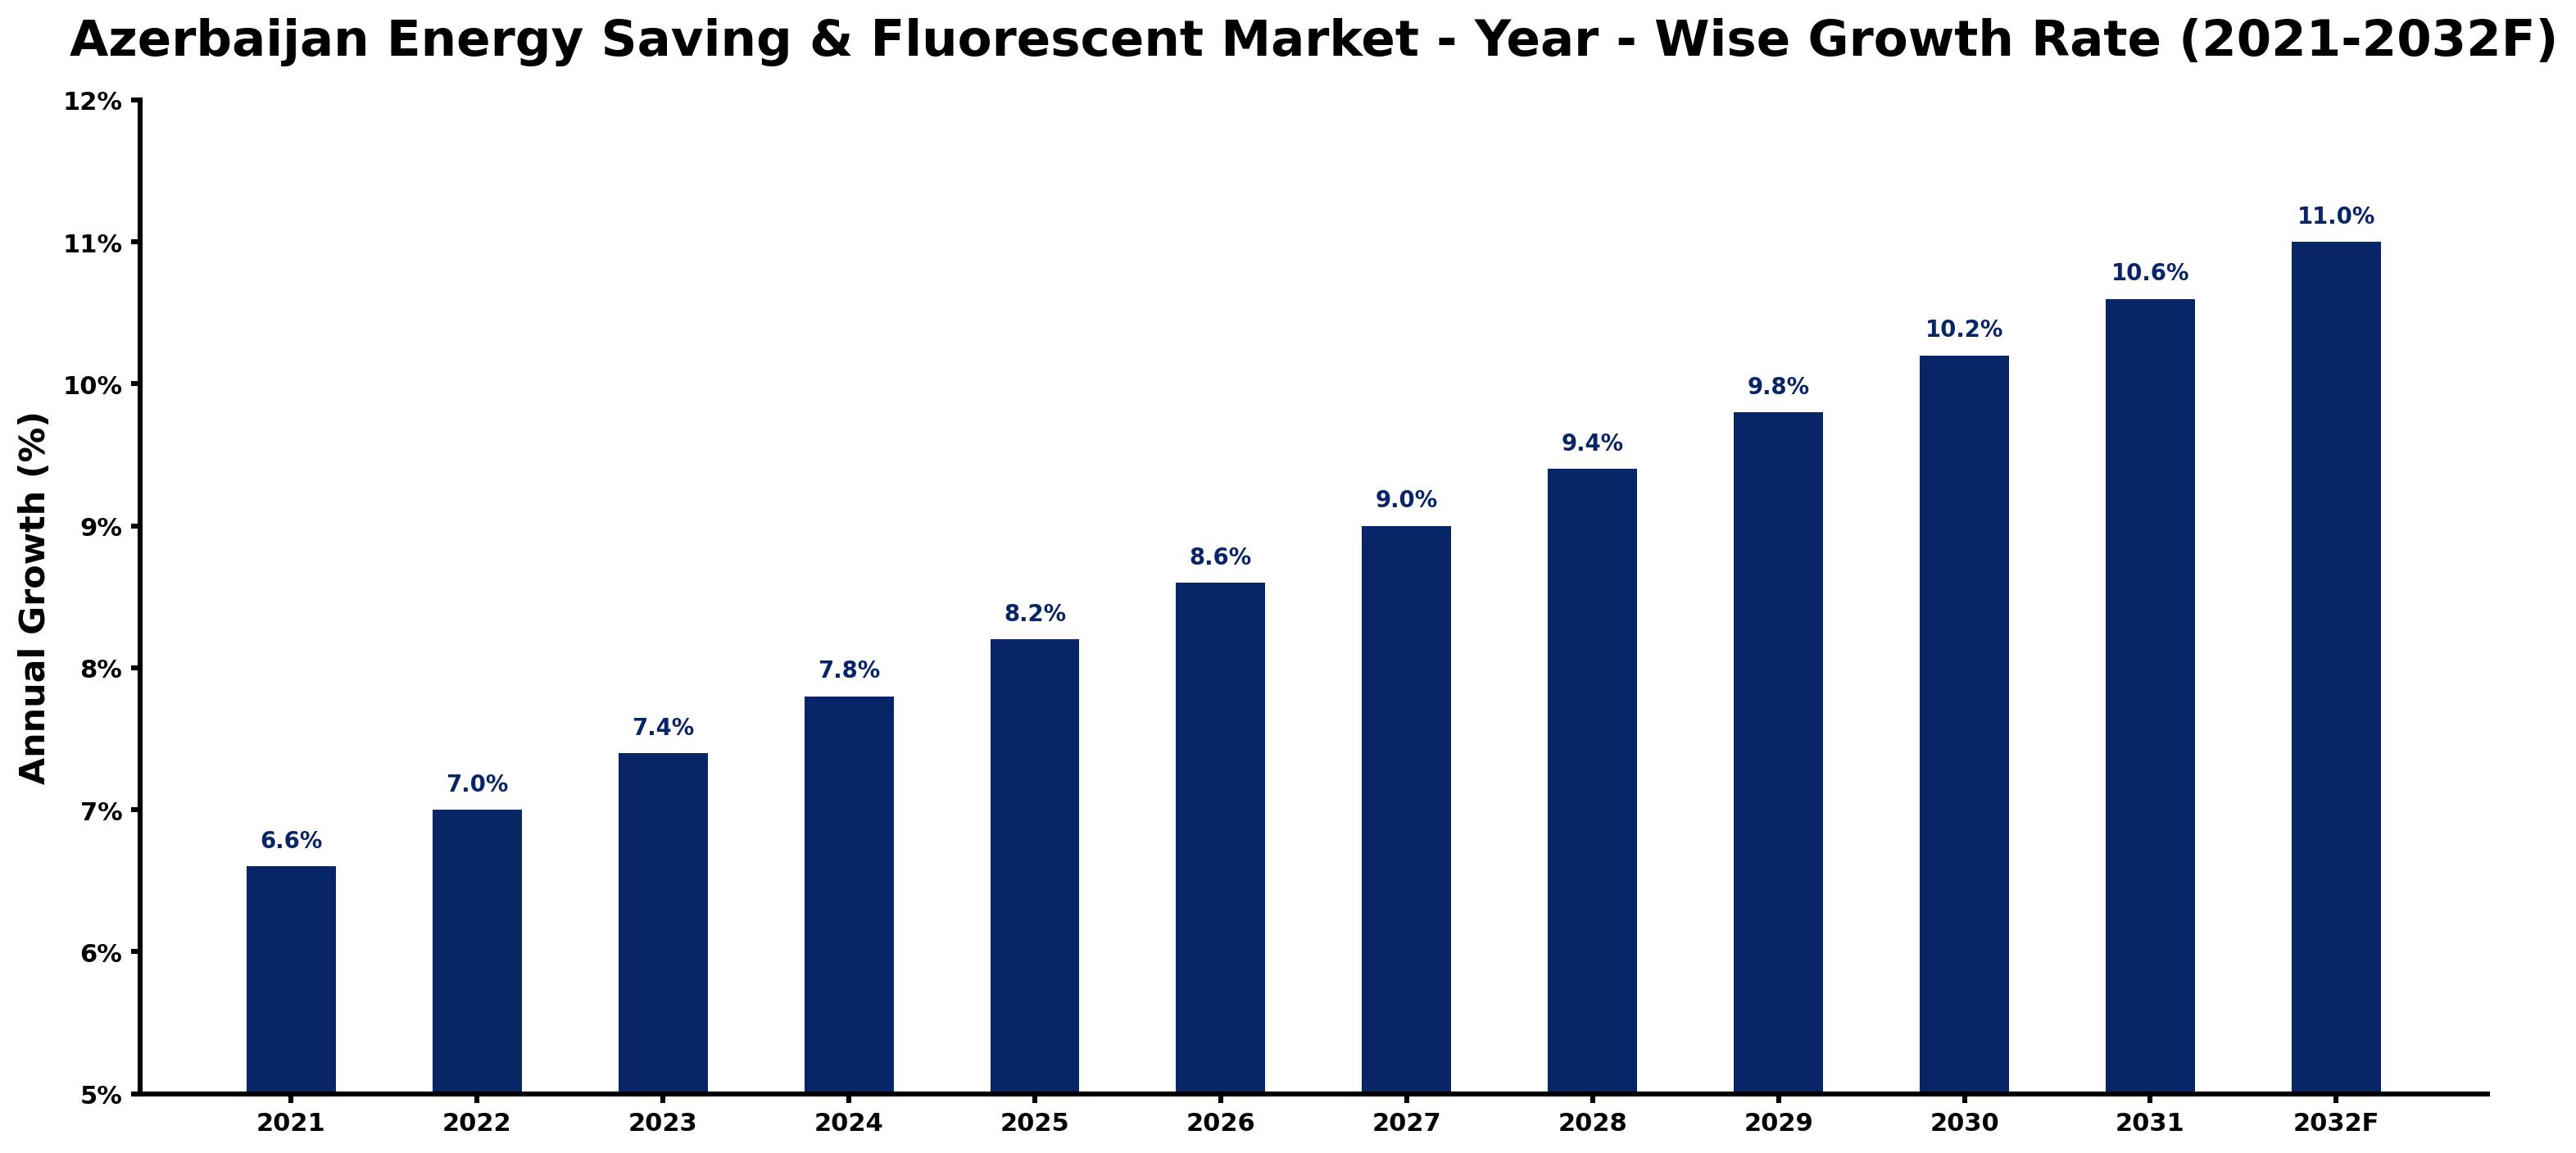
Azerbaijan Energy Saving & Fluorescent Market Growth Rate Analysis (2021-2032)
The Azerbaijan Energy Saving and Fluorescent market is experiencing robust growth, with projections showing an increase from 6.6% in 2021 to an impressive 11.0% by 2032. This upward trend is significantly driven by heightened consumer demand for energy-efficient solutions and government policies aimed at reducing carbon footprints. Investments in infrastructure enhancement and technological advancements continue to facilitate the transition toward sustainable energy sources. As awareness of environmental concerns grows among consumers, the preference for energy-saving products has intensified, spurring market expansion. This dynamic landscape, bolstered by digitalization and innovative lighting technologies, indicates that the market will maintain a strong momentum in the coming years, culminating in 11.0% growth in 2032.
Azerbaijan Energy Saving & Fluorescent Market Year-wise Growth Rate and Key Drivers
This graph highlights how the Azerbaijan Energy Saving & Fluorescent Market has steadily grown over the past five years, supported by major growth factors.
The table below presents the year wise growth rates along with the key drivers influencing the market
| Year | Growth Rate | Major Drivers |
| 2021 | 6.6% | Fluorescent technology gains traction as energy efficiency becomes a priority for businesses. |
| 2022 | 7.0% | Increased consumer awareness about energy conservation influences purchasing decisions significantly. |
| 2023 | 7.4% | Local manufacturers begin enhancing production capabilities to meet rising market demands effectively. |
| 2024 | 7.8% | Energy-efficient practices in construction lead to higher sales of fluorescent lighting solutions. |
| 2025 | 8.2% | Collaborations between manufacturers and local government streamline access to energy-saving technologies. |
| 2026 | 8.6% | Investment in renovation projects boosts the need for upgraded lighting systems nationwide. |
| 2027 | 9.0% | Emerging companies enter the market, introducing innovative energy-saving product lines. |
| 2028 | 9.4% | Warm climates necessitate efficient lighting, further pushing fluorescent technology adoption. |
| 2029 | 9.8% | Urbanization trends create expanded opportunities for energy-efficient residential developments. |
| 2030 | 10.2% | Corporate sustainability commitments compel businesses to transition toward energy-saving solutions. |
| 2031 | 10.6% | Technological advancements in fluorescent lighting enhance performance and reduce operational costs. |
| 2032 | 11.0% | Integration of smart technologies with fluorescent systems drives value for modern consumers. |
Note - Market size estimations and growth projections presented in this report are based on 6Wresearch's advanced forecasting approach, validated with industry datasets as of June 2026.
Key Highlights of the Report:
- Azerbaijan Energy Saving & Fluorescent Market Outlook
- Market Size of Azerbaijan Energy Saving & Fluorescent Market, 2025
- Forecast of Azerbaijan Energy Saving & Fluorescent Market, 2032F
- Historical Data and Forecast of Azerbaijan Energy Saving & Fluorescent Revenues & Volume for the Period 2022-2032F
- Azerbaijan Energy Saving & Fluorescent Market Trend Evolution
- Azerbaijan Energy Saving & Fluorescent Market Drivers and Challenges
- Azerbaijan Energy Saving & Fluorescent Price Trends
- Azerbaijan Energy Saving & Fluorescent Porter's Five Forces
- Azerbaijan Energy Saving & Fluorescent Industry Life Cycle
- Historical Data and Forecast of Azerbaijan Energy Saving & Fluorescent Market Revenues & Volume By Sources for the Period 2022-2032F
- Historical Data and Forecast of Azerbaijan Energy Saving & Fluorescent Market Revenues & Volume By High-Intensity Discharge Lamps (HID) for the Period 2022-2032F
- Historical Data and Forecast of Azerbaijan Energy Saving & Fluorescent Market Revenues & Volume By Linear Fluorescent Lamps (LFL) for the Period 2022-2032F
- Historical Data and Forecast of Azerbaijan Energy Saving & Fluorescent Market Revenues & Volume By Light Emitting Diodes (LED) for the Period 2022-2032F
- Historical Data and Forecast of Azerbaijan Energy Saving & Fluorescent Market Revenues & Volume By Applications for the Period 2022-2032F
- Historical Data and Forecast of Azerbaijan Energy Saving & Fluorescent Market Revenues & Volume By Commercial for the Period 2022-2032F
- Historical Data and Forecast of Azerbaijan Energy Saving & Fluorescent Market Revenues & Volume By Residential for the Period 2022-2032F
- Historical Data and Forecast of Azerbaijan Energy Saving & Fluorescent Market Revenues & Volume By Government for the Period 2022-2032F
- Azerbaijan Energy Saving & Fluorescent Import Export Trade Statistics
- Market Opportunity Assessment By Sources
- Market Opportunity Assessment By Applications
- Azerbaijan Energy Saving & Fluorescent Top Companies Market Share
- Azerbaijan Energy Saving & Fluorescent Competitive Benchmarking By Technical and Operational Parameters
- Azerbaijan Energy Saving & Fluorescent Company Profiles
- Azerbaijan Energy Saving & Fluorescent Key Strategic Recommendations
Frequently Asked Questions About the Market Study (FAQs):
6Wresearch actively monitors the Azerbaijan Energy Saving & Fluorescent Market and publishes its comprehensive annual report, highlighting emerging trends, growth drivers, revenue analysis, and forecast outlook. Our insights help businesses to make data-backed strategic decisions with ongoing market dynamics. Our analysts track relevent industries related to the Azerbaijan Energy Saving & Fluorescent Market, allowing our clients with actionable intelligence and reliable forecasts tailored to emerging regional needs.
Yes, we provide customisation as per your requirements. To learn more, feel free to contact us on sales@6wresearch.com
1 Executive Summary |
2 Introduction |
2.1 Key Highlights of the Report |
2.2 Report Description |
2.3 Market Scope & Segmentation |
2.4 Research Methodology |
2.5 Assumptions |
3 Azerbaijan Energy Saving & Fluorescent Market Overview |
3.1 Azerbaijan Country Macro Economic Indicators |
3.2 Azerbaijan Energy Saving & Fluorescent Market Revenues & Volume, 2022 & 2032F |
3.3 Azerbaijan Energy Saving & Fluorescent Market - Industry Life Cycle |
3.4 Azerbaijan Energy Saving & Fluorescent Market - Porter's Five Forces |
3.5 Azerbaijan Energy Saving & Fluorescent Market Revenues & Volume Share, By Sources, 2022 & 2032F |
3.6 Azerbaijan Energy Saving & Fluorescent Market Revenues & Volume Share, By Applications, 2022 & 2032F |
4 Azerbaijan Energy Saving & Fluorescent Market Dynamics |
4.1 Impact Analysis |
4.2 Market Drivers |
4.3 Market Restraints |
5 Azerbaijan Energy Saving & Fluorescent Market Trends |
6 Azerbaijan Energy Saving & Fluorescent Market, By Types |
6.1 Azerbaijan Energy Saving & Fluorescent Market, By Sources |
6.1.1 Overview and Analysis |
6.1.2 Azerbaijan Energy Saving & Fluorescent Market Revenues & Volume, By Sources, 2022 - 2032F |
6.1.3 Azerbaijan Energy Saving & Fluorescent Market Revenues & Volume, By High-Intensity Discharge Lamps (HID), 2022 - 2032F |
6.1.4 Azerbaijan Energy Saving & Fluorescent Market Revenues & Volume, By Linear Fluorescent Lamps (LFL), 2022 - 2032F |
6.1.5 Azerbaijan Energy Saving & Fluorescent Market Revenues & Volume, By Light Emitting Diodes (LED), 2022 - 2032F |
6.2 Azerbaijan Energy Saving & Fluorescent Market, By Applications |
6.2.1 Overview and Analysis |
6.2.2 Azerbaijan Energy Saving & Fluorescent Market Revenues & Volume, By Commercial, 2022 - 2032F |
6.2.3 Azerbaijan Energy Saving & Fluorescent Market Revenues & Volume, By Residential, 2022 - 2032F |
6.2.4 Azerbaijan Energy Saving & Fluorescent Market Revenues & Volume, By Government, 2022 - 2032F |
7 Azerbaijan Energy Saving & Fluorescent Market Import-Export Trade Statistics |
7.1 Azerbaijan Energy Saving & Fluorescent Market Export to Major Countries |
7.2 Azerbaijan Energy Saving & Fluorescent Market Imports from Major Countries |
8 Azerbaijan Energy Saving & Fluorescent Market Key Performance Indicators |
9 Azerbaijan Energy Saving & Fluorescent Market - Opportunity Assessment |
9.1 Azerbaijan Energy Saving & Fluorescent Market Opportunity Assessment, By Sources, 2022 & 2032F |
9.2 Azerbaijan Energy Saving & Fluorescent Market Opportunity Assessment, By Applications, 2022 & 2032F |
10 Azerbaijan Energy Saving & Fluorescent Market - Competitive Landscape |
10.1 Azerbaijan Energy Saving & Fluorescent Market Revenue Share, By Companies, 2025 |
10.2 Azerbaijan Energy Saving & Fluorescent Market Competitive Benchmarking, By Operating and Technical Parameters |
11 Company Profiles |
12 Recommendations |
13 Disclaimer |
Global Go To Market Strategy - 2030
Export potential enables firms to identify high-growth global markets with greater confidence by combining advanced trade intelligence with a structured quantitative methodology. The framework analyzes emerging demand trends and country-level import patterns while integrating macroeconomic and trade datasets such as GDP and population forecasts, bilateral import–export flows, tariff structures, elasticity differentials between developed and developing economies, geographic distance, and import demand projections. Using weighted trade values from 2020–2024 as the base period to project country-to-country export potential for 2030, these inputs are operationalized through calculated drivers such as gravity model parameters, tariff impact factors, and projected GDP per-capita growth. Through an analysis of hidden potentials, demand hotspots, and market conditions that are most favorable to success, this method enables firms to focus on target countries, maximize returns, and global expansion with data, backed by accuracy.
By factoring in the projected importer demand gap that is currently unmet and could be potential opportunity, it identifies the potential for the Exporter (Country) among 190 countries, against the general trade analysis, which identifies the biggest importer or exporter.
To discover high-growth global markets and optimize your business strategy:
Click Here
Pricing
- Single User License$ 1,995
- Department License$ 2,400
- Site License$ 3,120
- Global License$ 3,795

Leadership Perspectives from Industry Events
Search
Thought Leadership and Analyst Meet


Our Clients
6WResearch In News
- India Air Conditioner Market Set for Strong Rebound in 2026 After Weather-Led Correction and GST-Driven Recovery: 6Wresearch
- ADAS in India: How Automatic Emergency Braking, Blind Spot Detection & Driver Monitoring are Transforming Road Safety
- Doha a strategic location for EV manufacturing hub: IPA Qatar
- Demand for luxury TVs surging in the GCC, says Samsung
- Empowering Growth: The Thriving Journey of Bangladesh’s Cable Industry
- Demand for luxury TVs surging in the GCC, says Samsung
Latest Reports
- Poland Fire Protection Systems Market (2026-2032)
- Cape Verde Portable Hand-Thrown Extinguisher Market (2026-2032)
- Canada Portable Hand-Thrown Extinguisher Market (2026-2032)
- Cameroon Portable Hand-Thrown Extinguisher Market (2026-2032)
- Burundi Portable Hand-Thrown Extinguisher Market (2026-2032)
- Burkina Faso Portable Hand-Thrown Extinguisher Market (2026-2032)
- Bulgaria Portable Hand-Thrown Extinguisher Market (2026-2032)
- Brunei Portable Hand-Thrown Extinguisher Market (2026-2032)
- Botswana Portable Hand-Thrown Extinguisher Market (2026-2032)
- Bosnia and Herzegovina Portable Hand-Thrown Extinguisher Market (2026-2032)
Industry Events and Analyst Meet

HIMTEX 2026

India Refining Summit 2026

India EV Show 2026

EV tech India Expo 2026

Auto Tech Asia 2026
Whitepaper
- Middle East & Africa Commercial Security Market Click here to view more.
- Middle East & Africa Fire Safety Systems & Equipment Market Click here to view more.
- GCC Drone Market Click here to view more.
- Middle East Lighting Fixture Market Click here to view more.
- GCC Physical & Perimeter Security Market Click here to view more.