Belgium LiDAR Market (2026-2032) | Trends, Companies, Industry, Revenue, Analysis, Segmentation, Forecast, Growth, Share, Outlook, Value & Size
Market Forecast By Component (Laser Scanners, Navigation & Positioning Systems), By Type (Solid State, Mechanical), By Installation Type (Airborne , Ground Based), By End User (Corridor Mapping, Engineering, Environment, ADAS and Driverless Cars, Exploration, Urban Planning, Cartography, Meteorology), By Range (Short, Medium, Long) And Competitive Landscape
| Product Code: ETC5560847 | Publication Date: Nov 2023 | Updated Date: Mar 2026 | Product Type: Market Research Report | |
| Publisher: 6Wresearch | Author: Ravi Bhandari | No. of Pages: 60 | No. of Figures: 30 | No. of Tables: 5 |
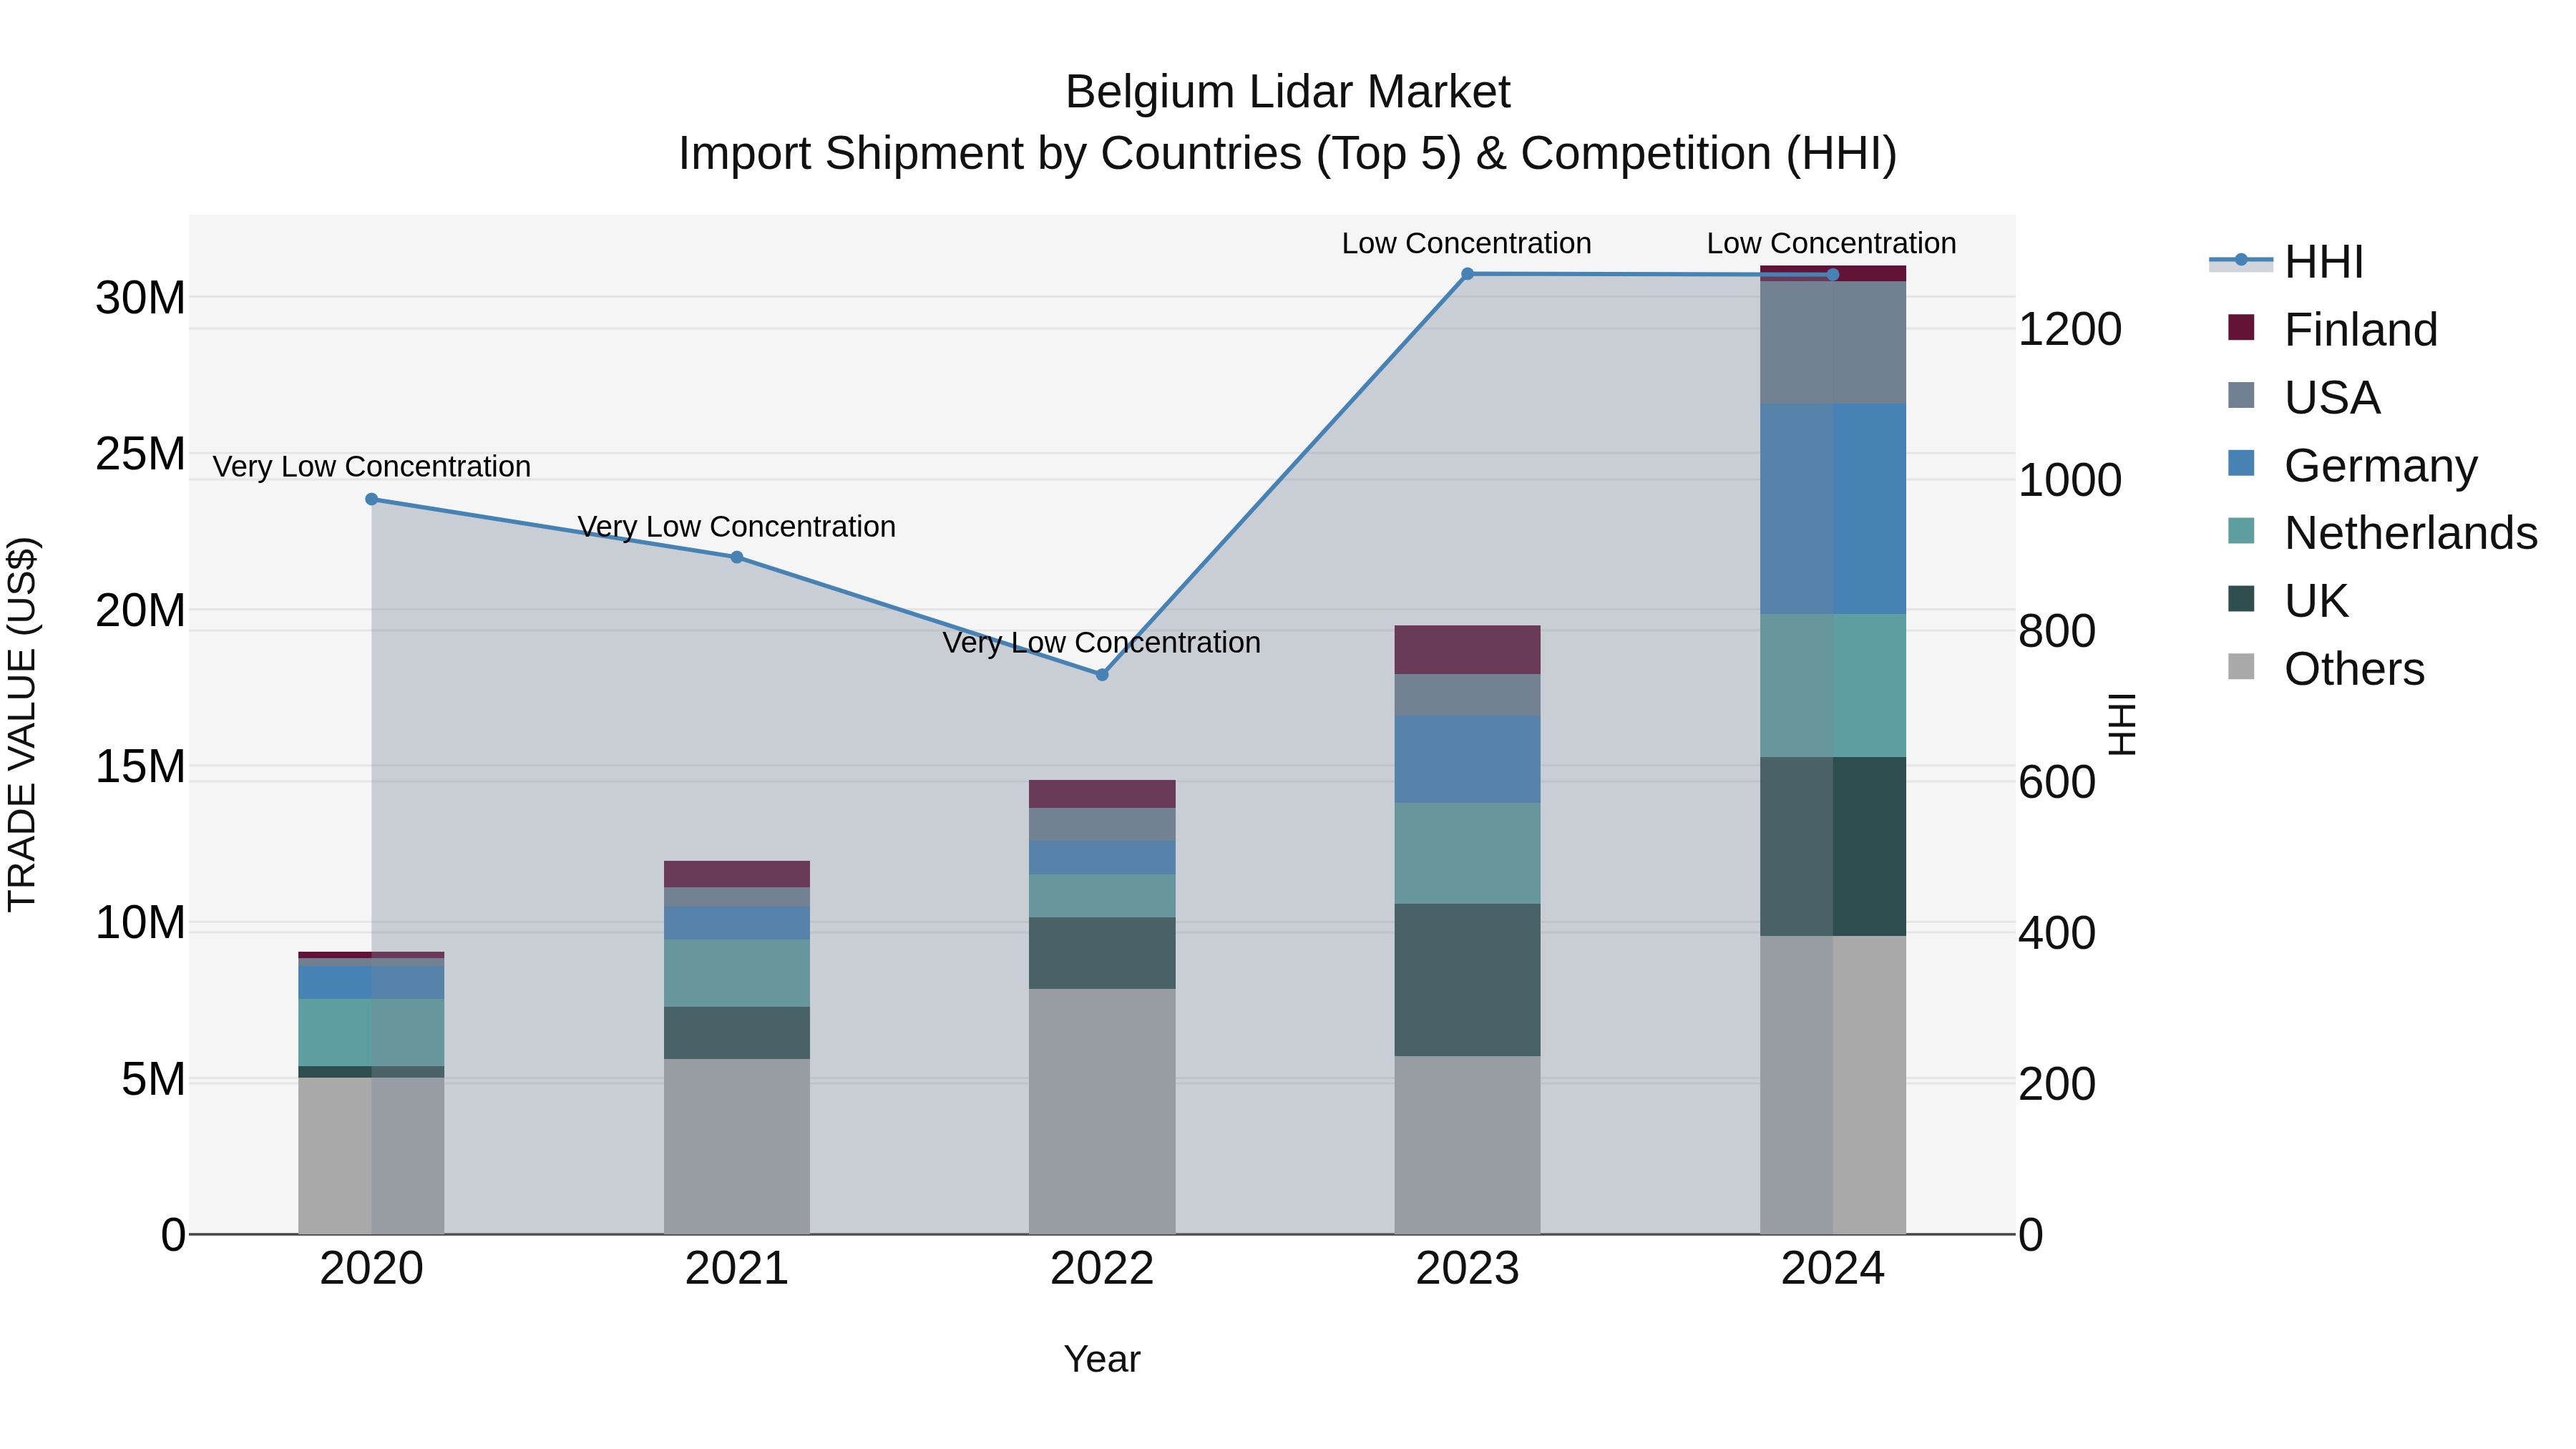
Belgium Lidar Market Top 5 Importing Countries and Market Competition (HHI) Analysis
Belgium continues to be a key market for lidar import shipments, with top exporters in 2024 being Germany, UK, Netherlands, USA, and UAE. The low Herfindahl-Hirschman Index (HHI) indicates a competitive market landscape. The impressive compound annual growth rate (CAGR) of 36.03% from 2020 to 2024 underscores the increasing demand for lidar technology in Belgium. Notably, the growth rate spiked to 59.03% from 2023 to 2024, indicating a significant acceleration in market expansion. Belgium remains a lucrative market for lidar imports with a promising outlook for the future.
Key Highlights of the Report:
- Belgium LiDAR Market Outlook
- Market Size of Belgium LiDAR Market, 2025
- Forecast of Belgium LiDAR Market, 2032
- Historical Data and Forecast of Belgium LiDAR Revenues & Volume for the Period 2022 - 2032F
- Belgium LiDAR Market Trend Evolution
- Belgium LiDAR Market Drivers and Challenges
- Belgium LiDAR Price Trends
- Belgium LiDAR Porter`s Five Forces
- Belgium LiDAR Industry Life Cycle
- Historical Data and Forecast of Belgium LiDAR Market Revenues & Volume By Component for the Period 2022 - 2032F
- Historical Data and Forecast of Belgium LiDAR Market Revenues & Volume By Laser Scanners for the Period 2022 - 2032F
- Historical Data and Forecast of Belgium LiDAR Market Revenues & Volume By Navigation & Positioning Systems for the Period 2022 - 2032F
- Historical Data and Forecast of Belgium LiDAR Market Revenues & Volume By Type for the Period 2022 - 2032F
- Historical Data and Forecast of Belgium LiDAR Market Revenues & Volume By Solid State for the Period 2022 - 2032F
- Historical Data and Forecast of Belgium LiDAR Market Revenues & Volume By Mechanical for the Period 2022 - 2032F
- Historical Data and Forecast of Belgium LiDAR Market Revenues & Volume By Installation Type for the Period 2022 - 2032F
- Historical Data and Forecast of Belgium LiDAR Market Revenues & Volume By Airborne for the Period 2022 - 2032F
- Historical Data and Forecast of Belgium LiDAR Market Revenues & Volume By Ground Based for the Period 2022 - 2032F
- Historical Data and Forecast of Belgium LiDAR Market Revenues & Volume By End User for the Period 2022 - 2032F
- Historical Data and Forecast of Belgium LiDAR Market Revenues & Volume By Corridor Mapping for the Period 2022 - 2032F
- Historical Data and Forecast of Belgium LiDAR Market Revenues & Volume By Engineering for the Period 2022 - 2032F
- Historical Data and Forecast of Belgium LiDAR Market Revenues & Volume By Environment for the Period 2022 - 2032F
- Historical Data and Forecast of Belgium LiDAR Market Revenues & Volume By ADAS and Driverless Cars for the Period 2022 - 2032F
- Historical Data and Forecast of Belgium LiDAR Market Revenues & Volume By Exploration for the Period 2022 - 2032F
- Historical Data and Forecast of Belgium LiDAR Market Revenues & Volume By Urban Planning for the Period 2022 - 2032F
- Historical Data and Forecast of Belgium LiDAR Market Revenues & Volume By Cartography for the Period 2022 - 2032F
- Historical Data and Forecast of Belgium LiDAR Market Revenues & Volume By Meteorology for the Period 2022 - 2032F
- Historical Data and Forecast of Belgium LiDAR Market Revenues & Volume By Range for the Period 2022 - 2032F
- Historical Data and Forecast of Belgium LiDAR Market Revenues & Volume By Short for the Period 2022 - 2032F
- Historical Data and Forecast of Belgium LiDAR Market Revenues & Volume By Medium for the Period 2022 - 2032F
- Historical Data and Forecast of Belgium LiDAR Market Revenues & Volume By Long for the Period 2022 - 2032F
- Belgium LiDAR Import Export Trade Statistics
- Market Opportunity Assessment By Component
- Market Opportunity Assessment By Type
- Market Opportunity Assessment By Installation Type
- Market Opportunity Assessment By End User
- Market Opportunity Assessment By Range
- Belgium LiDAR Top Companies Market Share
- Belgium LiDAR Competitive Benchmarking By Technical and Operational Parameters
- Belgium LiDAR Company Profiles
- Belgium LiDAR Key Strategic Recommendations
Frequently Asked Questions About the Market Study (FAQs):
6Wresearch actively monitors the Belgium LiDAR Market and publishes its comprehensive annual report, highlighting emerging trends, growth drivers, revenue analysis, and forecast outlook. Our insights help businesses to make data-backed strategic decisions with ongoing market dynamics. Our analysts track relevent industries related to the Belgium LiDAR Market, allowing our clients with actionable intelligence and reliable forecasts tailored to emerging regional needs.
Yes, we provide customisation as per your requirements. To learn more, feel free to contact us on sales@6wresearch.com
1 Executive Summary |
2 Introduction |
2.1 Key Highlights of the Report |
2.2 Report Description |
2.3 Market Scope & Segmentation |
2.4 Research Methodology |
2.5 Assumptions |
3 Belgium LiDAR Market Overview |
3.1 Belgium Country Macro Economic Indicators |
3.2 Belgium LiDAR Market Revenues & Volume, 2022 & 2032F |
3.3 Belgium LiDAR Market - Industry Life Cycle |
3.4 Belgium LiDAR Market - Porter's Five Forces |
3.5 Belgium LiDAR Market Revenues & Volume Share, By Component , 2022 & 2032F |
3.6 Belgium LiDAR Market Revenues & Volume Share, By Type , 2022 & 2032F |
3.7 Belgium LiDAR Market Revenues & Volume Share, By Installation Type , 2022 & 2032F |
3.8 Belgium LiDAR Market Revenues & Volume Share, By End User, 2022 & 2032F |
3.9 Belgium LiDAR Market Revenues & Volume Share, By Range, 2022 & 2032F |
4 Belgium LiDAR Market Dynamics |
4.1 Impact Analysis |
4.2 Market Drivers |
4.2.1 Increasing demand for autonomous vehicles and smart infrastructure projects in Belgium |
4.2.2 Rising adoption of lidar technology in various industries such as agriculture, forestry, and urban planning |
4.2.3 Government initiatives promoting the use of lidar technology for environmental monitoring and disaster management |
4.3 Market Restraints |
4.3.1 High initial investment and operational costs associated with lidar technology implementation |
4.3.2 Lack of skilled professionals to operate and maintain lidar systems effectively |
4.3.3 Data privacy concerns and regulatory challenges related to the collection and processing of lidar data |
5 Belgium LiDAR Market Trends |
6 Belgium LiDAR Market Segmentations |
6.1 Belgium LiDAR Market, By Component |
6.1.1 Overview and Analysis |
6.1.2 Belgium LiDAR Market Revenues & Volume, By Laser Scanners, 2022 - 2032F |
6.1.3 Belgium LiDAR Market Revenues & Volume, By Navigation & Positioning Systems, 2022 - 2032F |
6.2 Belgium LiDAR Market, By Type |
6.2.1 Overview and Analysis |
6.2.2 Belgium LiDAR Market Revenues & Volume, By Solid State, 2022 - 2032F |
6.2.3 Belgium LiDAR Market Revenues & Volume, By Mechanical, 2022 - 2032F |
6.3 Belgium LiDAR Market, By Installation Type |
6.3.1 Overview and Analysis |
6.3.2 Belgium LiDAR Market Revenues & Volume, By Airborne , 2022 - 2032F |
6.3.3 Belgium LiDAR Market Revenues & Volume, By Ground Based, 2022 - 2032F |
6.4 Belgium LiDAR Market, By End User |
6.4.1 Overview and Analysis |
6.4.2 Belgium LiDAR Market Revenues & Volume, By Corridor Mapping, 2022 - 2032F |
6.4.3 Belgium LiDAR Market Revenues & Volume, By Engineering, 2022 - 2032F |
6.4.4 Belgium LiDAR Market Revenues & Volume, By Environment, 2022 - 2032F |
6.4.5 Belgium LiDAR Market Revenues & Volume, By ADAS and Driverless Cars, 2022 - 2032F |
6.4.6 Belgium LiDAR Market Revenues & Volume, By Exploration, 2022 - 2032F |
6.4.7 Belgium LiDAR Market Revenues & Volume, By Urban Planning, 2022 - 2032F |
6.4.8 Belgium LiDAR Market Revenues & Volume, By Meteorology, 2022 - 2032F |
6.4.9 Belgium LiDAR Market Revenues & Volume, By Meteorology, 2022 - 2032F |
6.5 Belgium LiDAR Market, By Range |
6.5.1 Overview and Analysis |
6.5.2 Belgium LiDAR Market Revenues & Volume, By Short, 2022 - 2032F |
6.5.3 Belgium LiDAR Market Revenues & Volume, By Medium, 2022 - 2032F |
6.5.4 Belgium LiDAR Market Revenues & Volume, By Long, 2022 - 2032F |
7 Belgium LiDAR Market Import-Export Trade Statistics |
7.1 Belgium LiDAR Market Export to Major Countries |
7.2 Belgium LiDAR Market Imports from Major Countries |
8 Belgium LiDAR Market Key Performance Indicators |
8.1 Average cost reduction achieved by companies using lidar technology in Belgium |
8.2 Percentage increase in lidar technology adoption across different industries in Belgium |
8.3 Number of research and development partnerships established for advancing lidar technology in Belgium |
9 Belgium LiDAR Market - Opportunity Assessment |
9.1 Belgium LiDAR Market Opportunity Assessment, By Component , 2022 & 2032F |
9.2 Belgium LiDAR Market Opportunity Assessment, By Type , 2022 & 2032F |
9.3 Belgium LiDAR Market Opportunity Assessment, By Installation Type , 2022 & 2032F |
9.4 Belgium LiDAR Market Opportunity Assessment, By End User, 2022 & 2032F |
9.5 Belgium LiDAR Market Opportunity Assessment, By Range, 2022 & 2032F |
10 Belgium LiDAR Market - Competitive Landscape |
10.1 Belgium LiDAR Market Revenue Share, By Companies, 2025 |
10.2 Belgium LiDAR Market Competitive Benchmarking, By Operating and Technical Parameters |
11 Company Profiles |
12 Recommendations | 13 Disclaimer |
Global Go To Market Strategy - 2030
Export potential enables firms to identify high-growth global markets with greater confidence by combining advanced trade intelligence with a structured quantitative methodology. The framework analyzes emerging demand trends and country-level import patterns while integrating macroeconomic and trade datasets such as GDP and population forecasts, bilateral import–export flows, tariff structures, elasticity differentials between developed and developing economies, geographic distance, and import demand projections. Using weighted trade values from 2020–2024 as the base period to project country-to-country export potential for 2030, these inputs are operationalized through calculated drivers such as gravity model parameters, tariff impact factors, and projected GDP per-capita growth. Through an analysis of hidden potentials, demand hotspots, and market conditions that are most favorable to success, this method enables firms to focus on target countries, maximize returns, and global expansion with data, backed by accuracy.
By factoring in the projected importer demand gap that is currently unmet and could be potential opportunity, it identifies the potential for the Exporter (Country) among 190 countries, against the general trade analysis, which identifies the biggest importer or exporter.
To discover high-growth global markets and optimize your business strategy:
Click Here
Pricing
- Single User License$ 1,995
- Department License$ 2,400
- Site License$ 3,120
- Global License$ 3,795

Leadership Perspectives from Industry Events
Search
Thought Leadership and Analyst Meet


Our Clients
6WResearch In News
- ADAS in India: How Automatic Emergency Braking, Blind Spot Detection & Driver Monitoring are Transforming Road Safety
- Doha a strategic location for EV manufacturing hub: IPA Qatar
- Demand for luxury TVs surging in the GCC, says Samsung
- Empowering Growth: The Thriving Journey of Bangladesh’s Cable Industry
- Demand for luxury TVs surging in the GCC, says Samsung
- Video call with a traditional healer? Once unthinkable, it’s now common in South Africa
Latest Reports
- Poland Fire Protection Systems Market (2026-2032)
- Cape Verde Portable Hand-Thrown Extinguisher Market (2026-2032)
- Canada Portable Hand-Thrown Extinguisher Market (2026-2032)
- Cameroon Portable Hand-Thrown Extinguisher Market (2026-2032)
- Burundi Portable Hand-Thrown Extinguisher Market (2026-2032)
- Burkina Faso Portable Hand-Thrown Extinguisher Market (2026-2032)
- Bulgaria Portable Hand-Thrown Extinguisher Market (2026-2032)
- Brunei Portable Hand-Thrown Extinguisher Market (2026-2032)
- Botswana Portable Hand-Thrown Extinguisher Market (2026-2032)
- Bosnia and Herzegovina Portable Hand-Thrown Extinguisher Market (2026-2032)
Industry Events and Analyst Meet

HIMTEX 2026

India Refining Summit 2026

India EV Show 2026

EV tech India Expo 2026

Auto Tech Asia 2026
Whitepaper
- Middle East & Africa Commercial Security Market Click here to view more.
- Middle East & Africa Fire Safety Systems & Equipment Market Click here to view more.
- GCC Drone Market Click here to view more.
- Middle East Lighting Fixture Market Click here to view more.
- GCC Physical & Perimeter Security Market Click here to view more.