Belgium Serial Eeprom Chips Market (2026-2032) | Growth, Forecast, Analysis, Trends, Outlook, Companies, Revenue, Segmentation, Industry, Value, Size & Share
Market Forecast By Product (16 Kbit, 32 Kbit, 64 Kbit, 128 Kbit, 256 Kbit, 512 Kbit, 1 Mbit, 2 Mbit), By Application (Consumer Electronics, Medical, Industry, Automotive, Others) And Competitive Landscape
| Product Code: ETC5136995 | Publication Date: Nov 2023 | Updated Date: Apr 2026 | Product Type: Market Research Report | |
| Publisher: 6Wresearch | Author: Shubham Padhi | No. of Pages: 60 | No. of Figures: 30 | No. of Tables: 5 |
Belgium Serial Eeprom Chips Market Size (2020-2030)
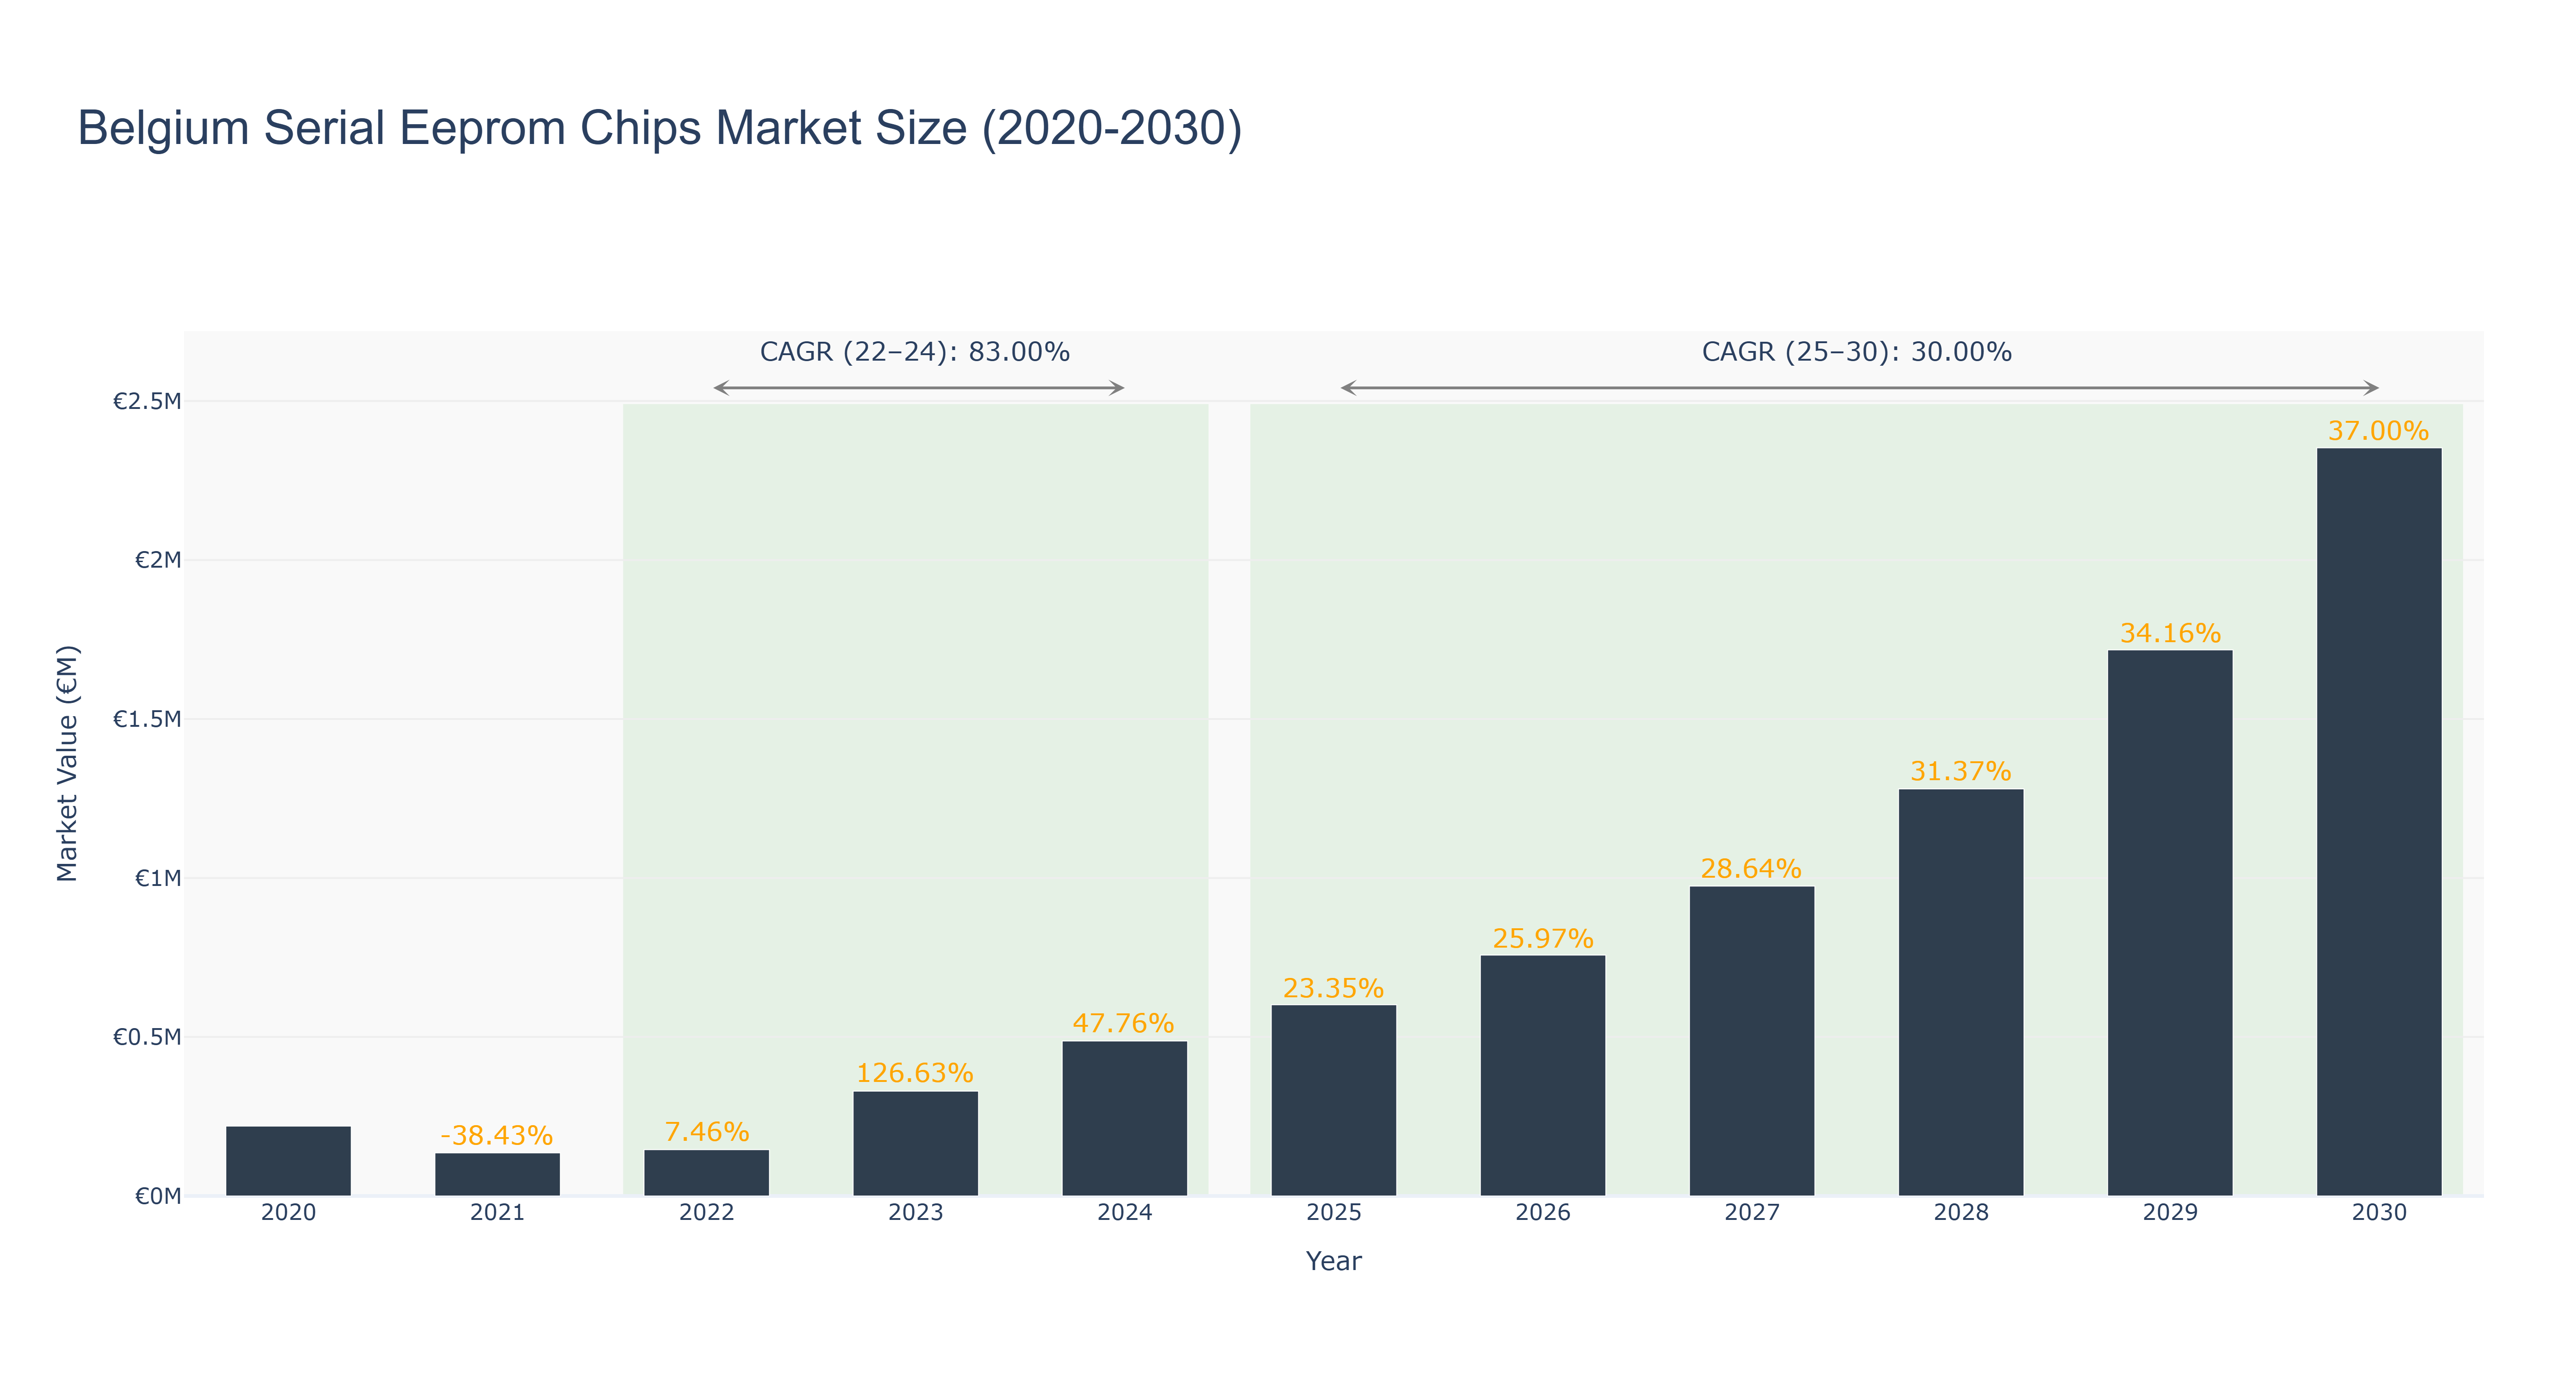
The Belgium Serial Eeprom Chips Market has shown significant growth over the past decade. The market size peaked at €2.35 million in 2030, with a steady increase from €0.22 million in 2020. The actual market size saw notable growth from 2020 to 2024, with a compound annual growth rate (CAGR) of 82.995% between 2022 and 2024. The forecasted growth from 2025 to 2030 is expected to continue at a CAGR of 30.0%. This growth can be attributed to the increasing demand for electronic devices and the integration of advanced technologies in various industries. Recent developments in the market include collaborations with tech giants to develop innovative chip solutions, paving the way for enhanced performance and efficiency in electronic devices in Belgium. This trend is likely to continue as the market embraces digital transformation and IoT technologies in the coming years.
Belgium Serial Eeprom Chips Market: Production & Trade Performance (2019-2025)
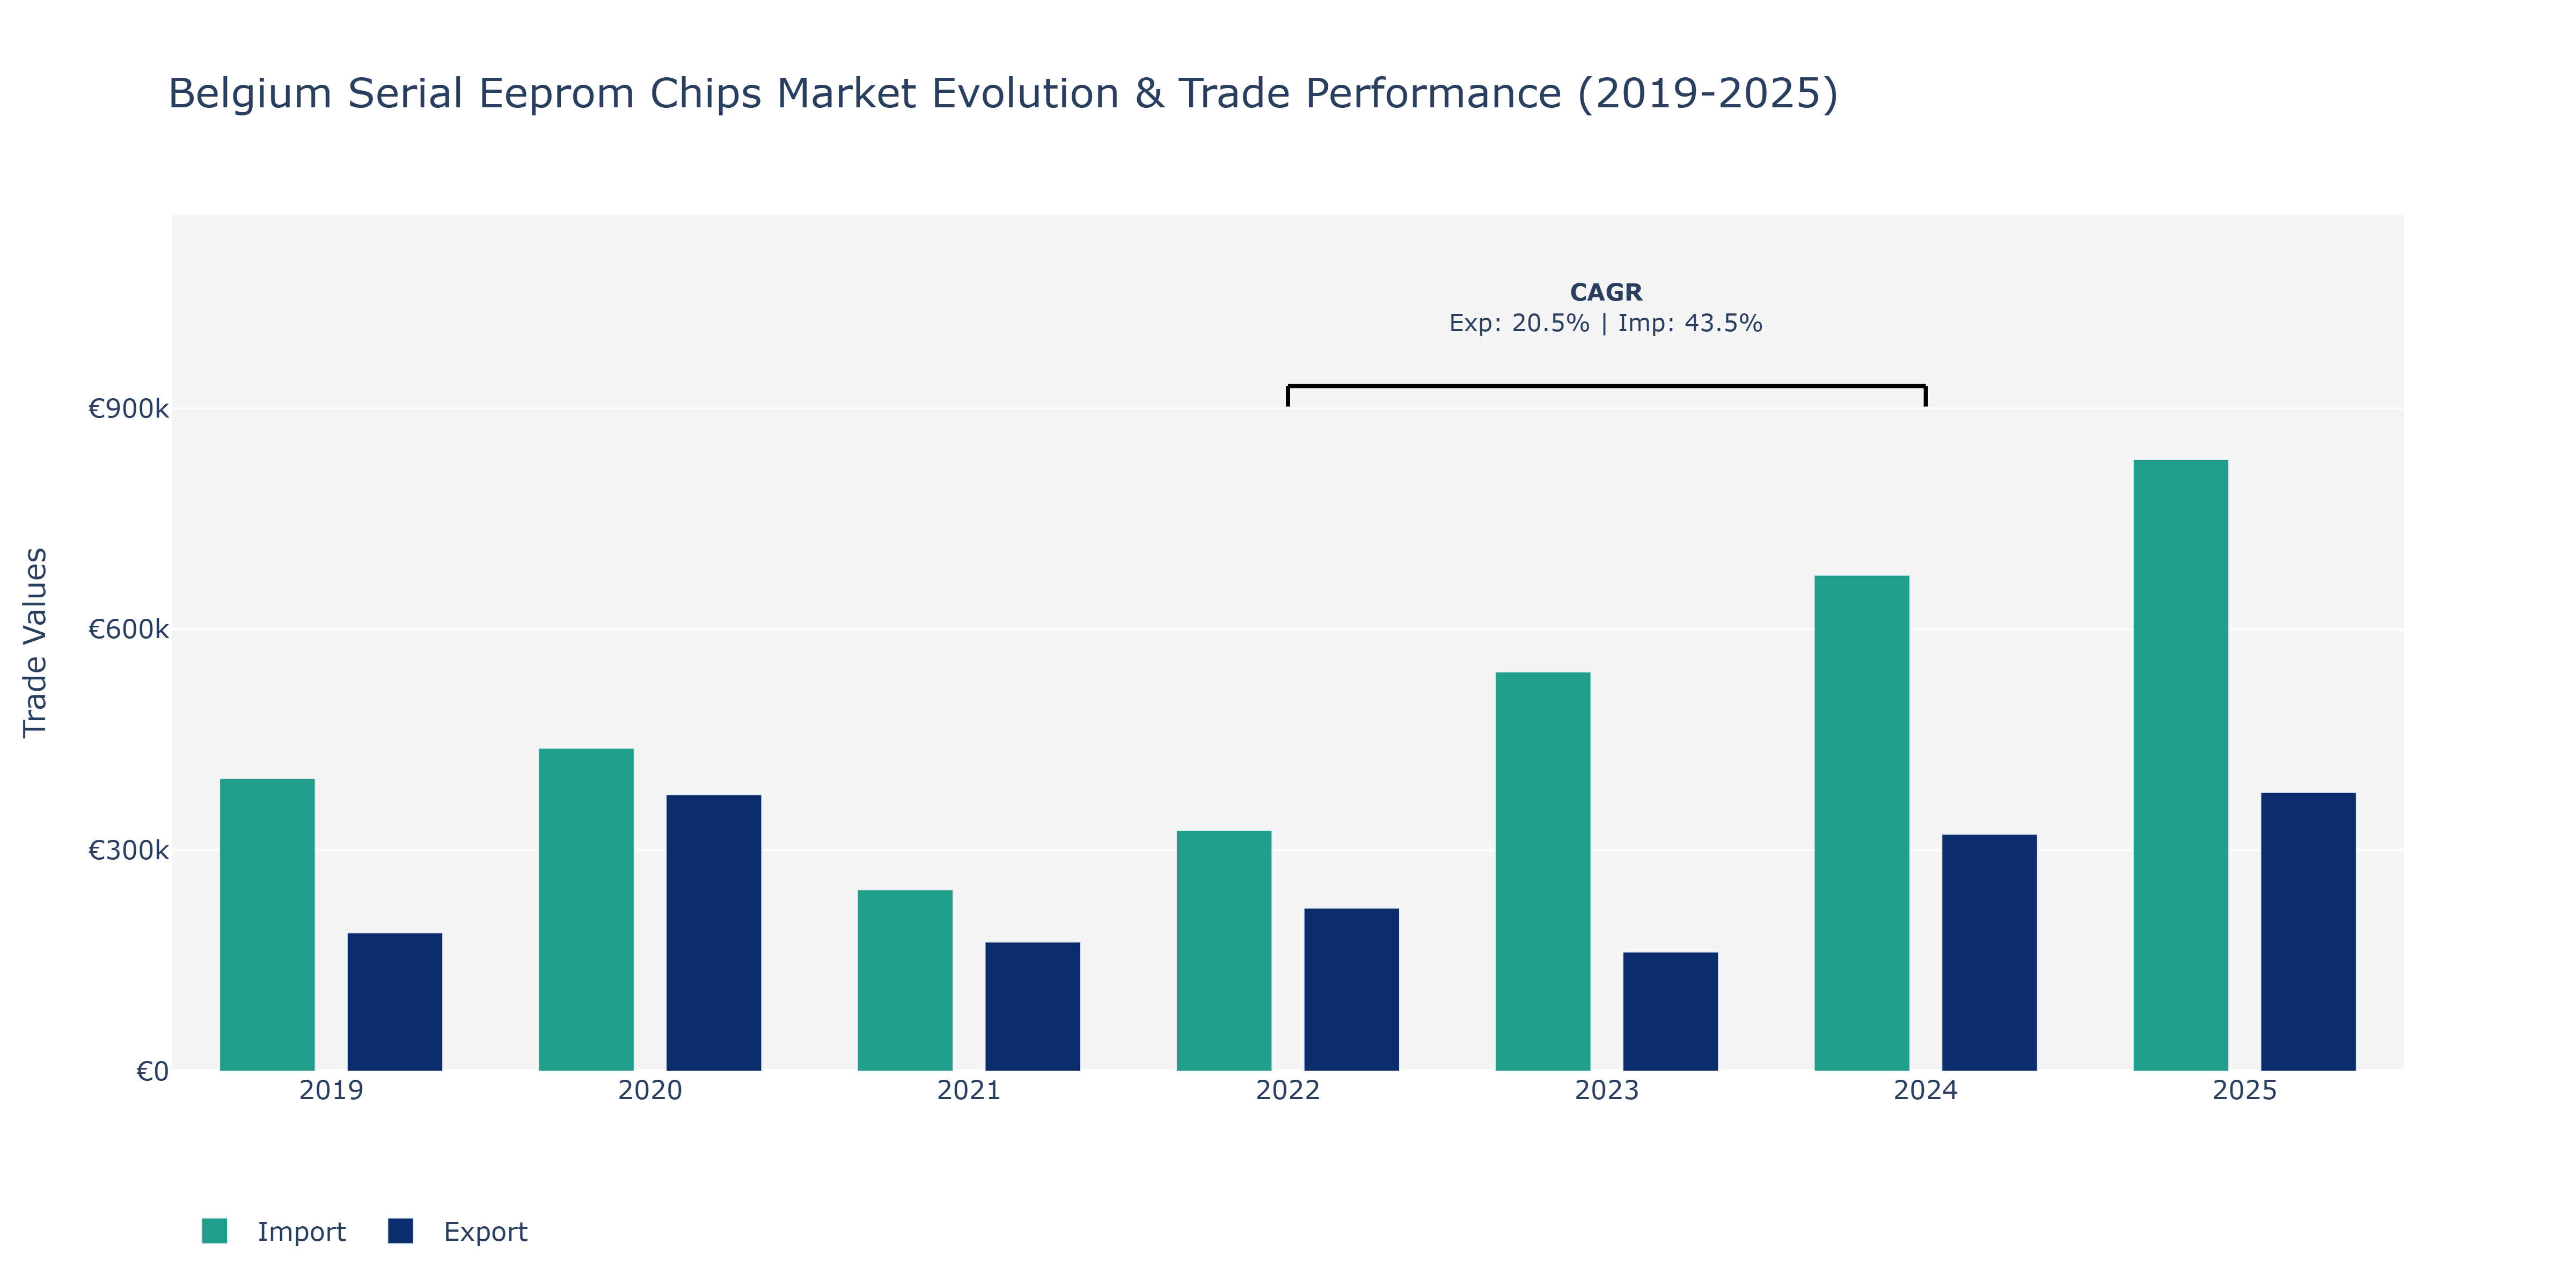
The Belgium Serial Eeprom Chips Market witnessed a fluctuating pattern in both Exports and Imports from 2019 to 2025. Exports surged from €187.75 thousand in 2019 to €378.43 thousand in 2025, with a notable peak of €375.36 thousand in 2020. Conversely, Imports displayed a similar trend, increasing steadily from €397.3 thousand in 2019 to €830.63 thousand in 2025, reaching a peak in 2025. The peak points in both metrics reflect the growing demand for Serial Eeprom Chips, possibly driven by technological advancements and the increasing adoption of connected devices. The decline in 2021 could be attributed to global supply chain disruptions or fluctuations in market demand. The significant increase in Imports from 2023 to 2025 might indicate a shift towards sourcing higher volumes of chips to meet escalating production requirements in various industries. This aligns with the global trend of rising demand for semiconductor components in electronics manufacturing, emphasizing Belgium's position as a key player in the market.
Key Highlights of the Report:
- Belgium Serial Eeprom Chips Market Outlook
- Market Size of Belgium Serial Eeprom Chips Market, 2025
- Forecast of Belgium Serial Eeprom Chips Market, 2032
- Historical Data and Forecast of Belgium Serial Eeprom Chips Revenues & Volume for the Period 2022 - 2032F
- Belgium Serial Eeprom Chips Market Trend Evolution
- Belgium Serial Eeprom Chips Market Drivers and Challenges
- Belgium Serial Eeprom Chips Price Trends
- Belgium Serial Eeprom Chips Porter`s Five Forces
- Belgium Serial Eeprom Chips Industry Life Cycle
- Historical Data and Forecast of Belgium Serial Eeprom Chips Market Revenues & Volume By Product for the Period 2022 - 2032F
- Historical Data and Forecast of Belgium Serial Eeprom Chips Market Revenues & Volume By 16 Kbit for the Period 2022 - 2032F
- Historical Data and Forecast of Belgium Serial Eeprom Chips Market Revenues & Volume By 32 Kbit for the Period 2022 - 2032F
- Historical Data and Forecast of Belgium Serial Eeprom Chips Market Revenues & Volume By 64 Kbit for the Period 2022 - 2032F
- Historical Data and Forecast of Belgium Serial Eeprom Chips Market Revenues & Volume By 128 Kbit for the Period 2022 - 2032F
- Historical Data and Forecast of Belgium Serial Eeprom Chips Market Revenues & Volume By 256 Kbit for the Period 2022 - 2032F
- Historical Data and Forecast of Belgium Serial Eeprom Chips Market Revenues & Volume By 512 Kbit for the Period 2022 - 2032F
- Historical Data and Forecast of Belgium Serial Eeprom Chips Market Revenues & Volume By 1 Mbit for the Period 2022 - 2032F
- Historical Data and Forecast of Belgium 16 Kbit Serial Eeprom Chips Market Revenues & Volume By 2 Mbit for the Period 2022 - 2032F
- Historical Data and Forecast of Belgium Serial Eeprom Chips Market Revenues & Volume By Application for the Period 2022 - 2032F
- Historical Data and Forecast of Belgium Serial Eeprom Chips Market Revenues & Volume By Consumer Electronics for the Period 2022 - 2032F
- Historical Data and Forecast of Belgium Serial Eeprom Chips Market Revenues & Volume By Medical for the Period 2022 - 2032F
- Historical Data and Forecast of Belgium Serial Eeprom Chips Market Revenues & Volume By Industry for the Period 2022 - 2032F
- Historical Data and Forecast of Belgium Serial Eeprom Chips Market Revenues & Volume By Automotive for the Period 2022 - 2032F
- Historical Data and Forecast of Belgium Serial Eeprom Chips Market Revenues & Volume By Others for the Period 2022 - 2032F
- Belgium Serial Eeprom Chips Import Export Trade Statistics
- Market Opportunity Assessment By Product
- Market Opportunity Assessment By Application
- Belgium Serial Eeprom Chips Top Companies Market Share
- Belgium Serial Eeprom Chips Competitive Benchmarking By Technical and Operational Parameters
- Belgium Serial Eeprom Chips Company Profiles
- Belgium Serial Eeprom Chips Key Strategic Recommendations
Frequently Asked Questions About the Market Study (FAQs):
6Wresearch actively monitors the Belgium Serial Eeprom Chips Market and publishes its comprehensive annual report, highlighting emerging trends, growth drivers, revenue analysis, and forecast outlook. Our insights help businesses to make data-backed strategic decisions with ongoing market dynamics. Our analysts track relevent industries related to the Belgium Serial Eeprom Chips Market, allowing our clients with actionable intelligence and reliable forecasts tailored to emerging regional needs.
Yes, we provide customisation as per your requirements. To learn more, feel free to contact us on sales@6wresearch.com
1 Executive Summary |
2 Introduction |
2.1 Key Highlights of the Report |
2.2 Report Description |
2.3 Market Scope & Segmentation |
2.4 Research Methodology |
2.5 Assumptions |
3 Belgium Serial Eeprom Chips Market Overview |
3.1 Belgium Country Macro Economic Indicators |
3.2 Belgium Serial Eeprom Chips Market Revenues & Volume, 2022 & 2032F |
3.3 Belgium Serial Eeprom Chips Market - Industry Life Cycle |
3.4 Belgium Serial Eeprom Chips Market - Porter's Five Forces |
3.5 Belgium Serial Eeprom Chips Market Revenues & Volume Share, By Product, 2022 & 2032F |
3.6 Belgium Serial Eeprom Chips Market Revenues & Volume Share, By Application, 2022 & 2032F |
4 Belgium Serial Eeprom Chips Market Dynamics |
4.1 Impact Analysis |
4.2 Market Drivers |
4.2.1 Increasing demand for smart devices and IoT applications that utilize serial EEPROM chips |
4.2.2 Growing trend towards automation and digitalization in various industries |
4.2.3 Technological advancements leading to higher performance and storage capacities in serial EEPROM chips |
4.3 Market Restraints |
4.3.1 Intense competition among manufacturers leading to pricing pressures |
4.3.2 Fluctuations in raw material prices impacting production costs |
4.3.3 Regulatory challenges related to data security and privacy concerns |
5 Belgium Serial Eeprom Chips Market Trends |
6 Belgium Serial Eeprom Chips Market Segmentations |
6.1 Belgium Serial Eeprom Chips Market, By Product |
6.1.1 Overview and Analysis |
6.1.2 Belgium Serial Eeprom Chips Market Revenues & Volume, By 16 Kbit, 2022 - 2032F |
6.1.3 Belgium Serial Eeprom Chips Market Revenues & Volume, By 32 Kbit, 2022 - 2032F |
6.1.4 Belgium Serial Eeprom Chips Market Revenues & Volume, By 64 Kbit, 2022 - 2032F |
6.1.5 Belgium Serial Eeprom Chips Market Revenues & Volume, By 128 Kbit, 2022 - 2032F |
6.1.6 Belgium Serial Eeprom Chips Market Revenues & Volume, By 256 Kbit, 2022 - 2032F |
6.1.7 Belgium Serial Eeprom Chips Market Revenues & Volume, By 512 Kbit, 2022 - 2032F |
6.1.9 Belgium Serial Eeprom Chips Market Revenues & Volume, By 2 Mbit, 2022 - 2032F |
6.1.10 Belgium Serial Eeprom Chips Market Revenues & Volume, By 2 Mbit, 2022 - 2032F |
6.2 Belgium Serial Eeprom Chips Market, By Application |
6.2.1 Overview and Analysis |
6.2.2 Belgium Serial Eeprom Chips Market Revenues & Volume, By Consumer Electronics, 2022 - 2032F |
6.2.3 Belgium Serial Eeprom Chips Market Revenues & Volume, By Medical, 2022 - 2032F |
6.2.4 Belgium Serial Eeprom Chips Market Revenues & Volume, By Industry, 2022 - 2032F |
6.2.5 Belgium Serial Eeprom Chips Market Revenues & Volume, By Automotive, 2022 - 2032F |
6.2.6 Belgium Serial Eeprom Chips Market Revenues & Volume, By Others, 2022 - 2032F |
7 Belgium Serial Eeprom Chips Market Import-Export Trade Statistics |
7.1 Belgium Serial Eeprom Chips Market Export to Major Countries |
7.2 Belgium Serial Eeprom Chips Market Imports from Major Countries |
8 Belgium Serial Eeprom Chips Market Key Performance Indicators |
8.1 Average selling price (ASP) of serial EEPROM chips |
8.2 Adoption rate of serial EEPROM chips in new applications |
8.3 Number of new product launches featuring serial EEPROM chips |
8.4 Rate of technological advancements in serial EEPROM chips |
8.5 Customer satisfaction and loyalty levels in relation to serial EEPROM chip performance |
9 Belgium Serial Eeprom Chips Market - Opportunity Assessment |
9.1 Belgium Serial Eeprom Chips Market Opportunity Assessment, By Product, 2022 & 2032F |
9.2 Belgium Serial Eeprom Chips Market Opportunity Assessment, By Application, 2022 & 2032F |
10 Belgium Serial Eeprom Chips Market - Competitive Landscape |
10.1 Belgium Serial Eeprom Chips Market Revenue Share, By Companies, 2025 |
10.2 Belgium Serial Eeprom Chips Market Competitive Benchmarking, By Operating and Technical Parameters |
11 Company Profiles |
12 Recommendations | 13 Disclaimer |
Global Go To Market Strategy - 2030
Export potential enables firms to identify high-growth global markets with greater confidence by combining advanced trade intelligence with a structured quantitative methodology. The framework analyzes emerging demand trends and country-level import patterns while integrating macroeconomic and trade datasets such as GDP and population forecasts, bilateral import–export flows, tariff structures, elasticity differentials between developed and developing economies, geographic distance, and import demand projections. Using weighted trade values from 2020–2024 as the base period to project country-to-country export potential for 2030, these inputs are operationalized through calculated drivers such as gravity model parameters, tariff impact factors, and projected GDP per-capita growth. Through an analysis of hidden potentials, demand hotspots, and market conditions that are most favorable to success, this method enables firms to focus on target countries, maximize returns, and global expansion with data, backed by accuracy.
By factoring in the projected importer demand gap that is currently unmet and could be potential opportunity, it identifies the potential for the Exporter (Country) among 190 countries, against the general trade analysis, which identifies the biggest importer or exporter.
To discover high-growth global markets and optimize your business strategy:
Click Here
Pricing
- Single User License$ 1,995
- Department License$ 2,400
- Site License$ 3,120
- Global License$ 3,795

Leadership Perspectives from Industry Events
Search
Thought Leadership and Analyst Meet


Our Clients
6WResearch In News
- Doha a strategic location for EV manufacturing hub: IPA Qatar
- Demand for luxury TVs surging in the GCC, says Samsung
- Empowering Growth: The Thriving Journey of Bangladesh’s Cable Industry
- Demand for luxury TVs surging in the GCC, says Samsung
- Video call with a traditional healer? Once unthinkable, it’s now common in South Africa
- Intelligent Buildings To Smooth GCC’s Path To Net Zero
Latest Reports
- Cape Verde Portable Hand-Thrown Extinguisher Market (2026-2032)
- Canada Portable Hand-Thrown Extinguisher Market (2026-2032)
- Cameroon Portable Hand-Thrown Extinguisher Market (2026-2032)
- Burundi Portable Hand-Thrown Extinguisher Market (2026-2032)
- Burkina Faso Portable Hand-Thrown Extinguisher Market (2026-2032)
- Bulgaria Portable Hand-Thrown Extinguisher Market (2026-2032)
- Brunei Portable Hand-Thrown Extinguisher Market (2026-2032)
- Botswana Portable Hand-Thrown Extinguisher Market (2026-2032)
- Bosnia and Herzegovina Portable Hand-Thrown Extinguisher Market (2026-2032)
- Bolivia Portable Hand-Thrown Extinguisher Market (2026-2032)
Industry Events and Analyst Meet

HIMTEX 2026

India Refining Summit 2026

India EV Show 2026

EV tech India Expo 2026

Auto Tech Asia 2026
Whitepaper
- Middle East & Africa Commercial Security Market Click here to view more.
- Middle East & Africa Fire Safety Systems & Equipment Market Click here to view more.
- GCC Drone Market Click here to view more.
- Middle East Lighting Fixture Market Click here to view more.
- GCC Physical & Perimeter Security Market Click here to view more.