Belize Clay Products And Refractories Market (2026-2032) | Growth, Share, Analysis, Revenue, Value, Trends, Outlook, Segmentation, Industry, Companies, Forecast & Size
Market Forecast By Type (Pottery, Ceramics, Plumbing Fixtures, Clay Building Material, Refractories), By Process (Grinding , Cutting , Mixing , Shaping, Honing), By Material (Quartz, Chamatte, Sand, Sawdust, Slag, Pulverized , Coal), By End-User Vertical (Construction , Automobiles , Steel Making , Cosmetics, Food Industry, Others) And Competitive Landscape
| Product Code: ETC5257893 | Publication Date: Nov 2023 | Updated Date: Mar 2026 | Product Type: Market Research Report | |
| Publisher: 6Wresearch | Author: Bhawna Singh | No. of Pages: 60 | No. of Figures: 30 | No. of Tables: 5 |
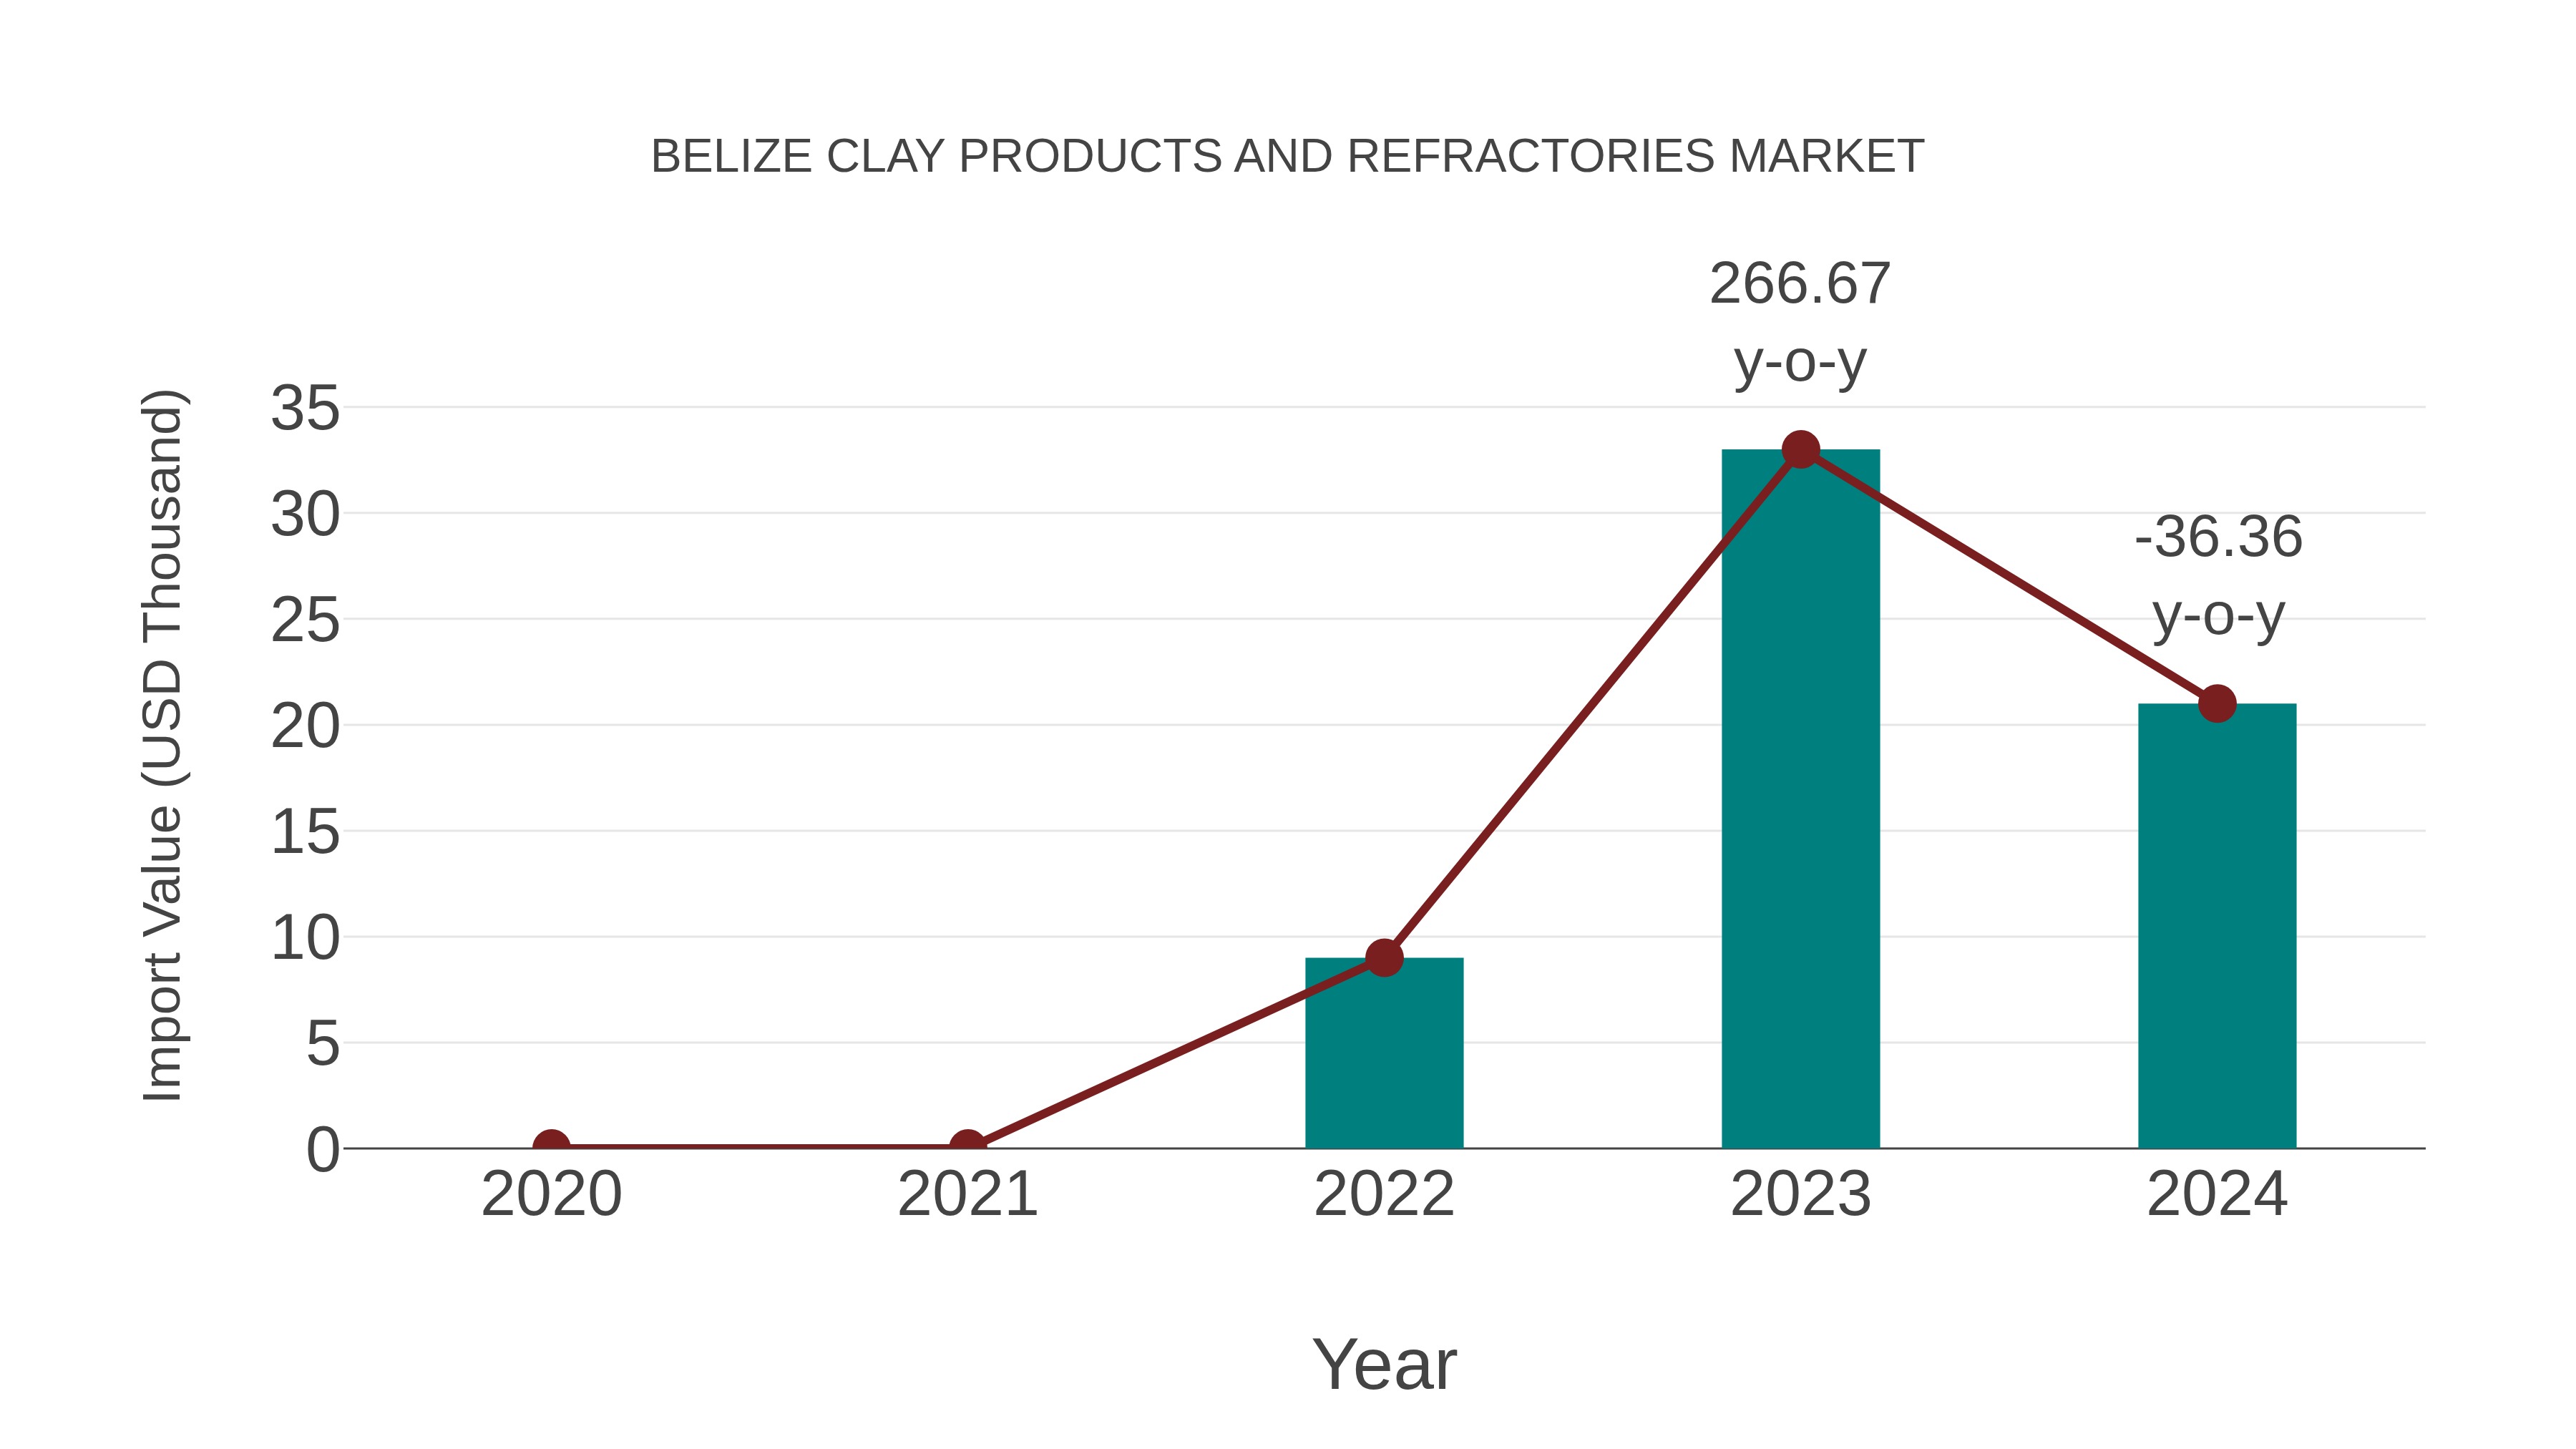
Belize Clay Products and Refractories Market: Import Trend Analysis
Between 2020-2024, Belize saw a significant increase in imports of clay products and refractories. The compound annual growth rate (CAGR) for this period was 52.75%. However, in 2023-2024, there was a year-on-year growth rate of -36.36%, indicating a slight decrease in imports compared to the previous year.
Belize Clay Products And Refractories Market Overview
The Belize Clay Products and Refractories Market focuses on the production and application of clay-based products and refractory materials used in high-temperature industrial processes. Market growth is driven by the demand for durable and heat-resistant materials in industries such as metallurgy, glass, and cement. Advances in material science and the development of innovative refractory products that offer improved performance and longevity are significant trends. The market is also influenced by the need for sustainable and cost-effective refractory solutions.
Drivers of the market
The market for clay products and refractories in Belize is driven by the demand for high-performance materials used in industrial processes and construction. Clay products, such as bricks and tiles, are essential for construction, while refractories are used to withstand high temperatures in various industries. The market benefits from growth in construction activities, increasing industrial production, and advancements in refractory materials.
Challenges of the market
The clay products and refractories market in Belize is constrained by high import costs and limited local production capabilities. There is a lack of technical expertise and awareness among potential users about the benefits and applications of clay products and refractories. Additionally, competition from alternative materials can restrict market growth.
Government Policy of the market
Belize encourages the production of clay products and refractories with tax incentives and subsidies for manufacturers. Government policies support research into improving product durability and expanding their applications in industrial processes.
Key Highlights of the Report:
- Belize Clay Products And Refractories Market Outlook
- Market Size of Belize Clay Products And Refractories Market, 2025
- Forecast of Belize Clay Products And Refractories Market, 2032
- Historical Data and Forecast of Belize Clay Products And Refractories Revenues & Volume for the Period 2022-2032F
- Belize Clay Products And Refractories Market Trend Evolution
- Belize Clay Products And Refractories Market Drivers and Challenges
- Belize Clay Products And Refractories Price Trends
- Belize Clay Products And Refractories Porter`s Five Forces
- Belize Clay Products And Refractories Industry Life Cycle
- Historical Data and Forecast of Belize Clay Products And Refractories Market Revenues & Volume By Type for the Period 2022-2032F
- Historical Data and Forecast of Belize Clay Products And Refractories Market Revenues & Volume By Pottery for the Period 2022-2032F
- Historical Data and Forecast of Belize Clay Products And Refractories Market Revenues & Volume By Ceramics for the Period 2022-2032F
- Historical Data and Forecast of Belize Clay Products And Refractories Market Revenues & Volume By Plumbing Fixtures for the Period 2022-2032F
- Historical Data and Forecast of Belize Clay Products And Refractories Market Revenues & Volume By Clay Building Material for the Period 2022-2032F
- Historical Data and Forecast of Belize Clay Products And Refractories Market Revenues & Volume By Refractories for the Period 2022-2032F
- Historical Data and Forecast of Belize Clay Products And Refractories Market Revenues & Volume By Process for the Period 2022-2032F
- Historical Data and Forecast of Belize Clay Products And Refractories Market Revenues & Volume By Grinding for the Period 2022-2032F
- Historical Data and Forecast of Belize Clay Products And Refractories Market Revenues & Volume By Cutting for the Period 2022-2032F
- Historical Data and Forecast of Belize Clay Products And Refractories Market Revenues & Volume By Mixing for the Period 2022-2032F
- Historical Data and Forecast of Belize Clay Products And Refractories Market Revenues & Volume By Shaping for the Period 2022-2032F
- Historical Data and Forecast of Belize Clay Products And Refractories Market Revenues & Volume By Honing for the Period 2022-2032F
- Historical Data and Forecast of Belize Clay Products And Refractories Market Revenues & Volume By Material for the Period 2022-2032F
- Historical Data and Forecast of Belize Clay Products And Refractories Market Revenues & Volume By Quartz for the Period 2022-2032F
- Historical Data and Forecast of Belize Clay Products And Refractories Market Revenues & Volume By Chamatte for the Period 2022-2032F
- Historical Data and Forecast of Belize Clay Products And Refractories Market Revenues & Volume By Sand for the Period 2022-2032F
- Historical Data and Forecast of Belize Clay Products And Refractories Market Revenues & Volume By Sawdust for the Period 2022-2032F
- Historical Data and Forecast of Belize Clay Products And Refractories Market Revenues & Volume By Slag for the Period 2022-2032F
- Historical Data and Forecast of Belize Clay Products And Refractories Market Revenues & Volume By Pulverized for the Period 2022-2032F
- Historical Data and Forecast of Belize Clay Products And Refractories Market Revenues & Volume By Coal for the Period 2022-2032F
- Historical Data and Forecast of Belize Clay Products And Refractories Market Revenues & Volume By End-User Vertical for the Period 2022-2032F
- Historical Data and Forecast of Belize Clay Products And Refractories Market Revenues & Volume By Construction for the Period 2022-2032F
- Historical Data and Forecast of Belize Clay Products And Refractories Market Revenues & Volume By Automobiles for the Period 2022-2032F
- Historical Data and Forecast of Belize Clay Products And Refractories Market Revenues & Volume By Steel Making for the Period 2022-2032F
- Historical Data and Forecast of Belize Clay Products And Refractories Market Revenues & Volume By Cosmetics for the Period 2022-2032F
- Historical Data and Forecast of Belize Clay Products And Refractories Market Revenues & Volume By Food Industry for the Period 2022-2032F
- Historical Data and Forecast of Belize Clay Products And Refractories Market Revenues & Volume By Others for the Period 2022-2032F
- Belize Clay Products And Refractories Import Export Trade Statistics
- Market Opportunity Assessment By Type
- Market Opportunity Assessment By Process
- Market Opportunity Assessment By Material
- Market Opportunity Assessment By End-User Vertical
- Belize Clay Products And Refractories Top Companies Market Share
- Belize Clay Products And Refractories Competitive Benchmarking By Technical and Operational Parameters
- Belize Clay Products And Refractories Company Profiles
- Belize Clay Products And Refractories Key Strategic Recommendations
Belize Clay Products And Refractories Market (2026-2032): FAQs
6Wresearch actively monitors the Belize Clay Products And Refractories Market and publishes its comprehensive annual report, highlighting emerging trends, growth drivers, revenue analysis, and forecast outlook. Our insights help businesses to make data-backed strategic decisions with ongoing market dynamics. Our analysts track relevent industries related to the Belize Clay Products And Refractories Market, allowing our clients with actionable intelligence and reliable forecasts tailored to emerging regional needs.
Yes, we provide customisation as per your requirements. To learn more, feel free to contact us on sales@6wresearch.com
1 Executive Summary |
2 Introduction |
2.1 Key Highlights of the Report |
2.2 Report Description |
2.3 Market Scope & Segmentation |
2.4 Research Methodology |
2.5 Assumptions |
3 Belize Clay Products And Refractories Market Overview |
3.1 Belize Country Macro Economic Indicators |
3.2 Belize Clay Products And Refractories Market Revenues & Volume, 2022 & 2032F |
3.3 Belize Clay Products And Refractories Market - Industry Life Cycle |
3.4 Belize Clay Products And Refractories Market - Porter's Five Forces |
3.5 Belize Clay Products And Refractories Market Revenues & Volume Share, By Type, 2022 & 2032F |
3.6 Belize Clay Products And Refractories Market Revenues & Volume Share, By Process , 2022 & 2032F |
3.7 Belize Clay Products And Refractories Market Revenues & Volume Share, By Material , 2022 & 2032F |
3.8 Belize Clay Products And Refractories Market Revenues & Volume Share, By End-User Vertical , 2022 & 2032F |
4 Belize Clay Products And Refractories Market Dynamics |
4.1 Impact Analysis |
4.2 Market Drivers |
4.2.1 Growing construction activities in Belize leading to increased demand for clay products and refractories |
4.2.2 Rising focus on sustainable and eco-friendly building materials driving the adoption of clay products |
4.2.3 Increasing infrastructure development projects in Belize boosting the market for refractories |
4.3 Market Restraints |
4.3.1 Fluctuating raw material prices impacting production costs |
4.3.2 Competition from alternative materials like concrete and steel affecting market penetration |
5 Belize Clay Products And Refractories Market Trends |
6 Belize Clay Products And Refractories Market Segmentations |
6.1 Belize Clay Products And Refractories Market, By Type |
6.1.1 Overview and Analysis |
6.1.2 Belize Clay Products And Refractories Market Revenues & Volume, By Pottery, 2022-2032F |
6.1.3 Belize Clay Products And Refractories Market Revenues & Volume, By Ceramics, 2022-2032F |
6.1.4 Belize Clay Products And Refractories Market Revenues & Volume, By Plumbing Fixtures, 2022-2032F |
6.1.5 Belize Clay Products And Refractories Market Revenues & Volume, By Clay Building Material, 2022-2032F |
6.1.6 Belize Clay Products And Refractories Market Revenues & Volume, By Refractories, 2022-2032F |
6.2 Belize Clay Products And Refractories Market, By Process |
6.2.1 Overview and Analysis |
6.2.2 Belize Clay Products And Refractories Market Revenues & Volume, By Grinding , 2022-2032F |
6.2.3 Belize Clay Products And Refractories Market Revenues & Volume, By Cutting , 2022-2032F |
6.2.4 Belize Clay Products And Refractories Market Revenues & Volume, By Mixing , 2022-2032F |
6.2.5 Belize Clay Products And Refractories Market Revenues & Volume, By Shaping, 2022-2032F |
6.2.6 Belize Clay Products And Refractories Market Revenues & Volume, By Honing, 2022-2032F |
6.3 Belize Clay Products And Refractories Market, By Material |
6.3.1 Overview and Analysis |
6.3.2 Belize Clay Products And Refractories Market Revenues & Volume, By Quartz, 2022-2032F |
6.3.3 Belize Clay Products And Refractories Market Revenues & Volume, By Chamatte, 2022-2032F |
6.3.4 Belize Clay Products And Refractories Market Revenues & Volume, By Sand, 2022-2032F |
6.3.5 Belize Clay Products And Refractories Market Revenues & Volume, By Sawdust, 2022-2032F |
6.3.6 Belize Clay Products And Refractories Market Revenues & Volume, By Slag, 2022-2032F |
6.3.7 Belize Clay Products And Refractories Market Revenues & Volume, By Pulverized , 2022-2032F |
6.4 Belize Clay Products And Refractories Market, By End-User Vertical |
6.4.1 Overview and Analysis |
6.4.2 Belize Clay Products And Refractories Market Revenues & Volume, By Construction , 2022-2032F |
6.4.3 Belize Clay Products And Refractories Market Revenues & Volume, By Automobiles , 2022-2032F |
6.4.4 Belize Clay Products And Refractories Market Revenues & Volume, By Steel Making , 2022-2032F |
6.4.5 Belize Clay Products And Refractories Market Revenues & Volume, By Cosmetics, 2022-2032F |
6.4.6 Belize Clay Products And Refractories Market Revenues & Volume, By Food Industry, 2022-2032F |
6.4.7 Belize Clay Products And Refractories Market Revenues & Volume, By Others, 2022-2032F |
7 Belize Clay Products And Refractories Market Import-Export Trade Statistics |
7.1 Belize Clay Products And Refractories Market Export to Major Countries |
7.2 Belize Clay Products And Refractories Market Imports from Major Countries |
8 Belize Clay Products And Refractories Market Key Performance Indicators |
8.1 Percentage of construction projects using clay products and refractories |
8.2 Adoption rate of eco-friendly clay products in construction projects |
8.3 Number of infrastructure projects utilizing refractories for high-temperature applications |
8.4 Average production cost per unit of clay product or refractory material |
8.5 Customer satisfaction index for clay products and refractories |
9 Belize Clay Products And Refractories Market - Opportunity Assessment |
9.1 Belize Clay Products And Refractories Market Opportunity Assessment, By Type, 2022 & 2032F |
9.2 Belize Clay Products And Refractories Market Opportunity Assessment, By Process , 2022 & 2032F |
9.3 Belize Clay Products And Refractories Market Opportunity Assessment, By Material , 2022 & 2032F |
9.4 Belize Clay Products And Refractories Market Opportunity Assessment, By End-User Vertical , 2022 & 2032F |
10 Belize Clay Products And Refractories Market - Competitive Landscape |
10.1 Belize Clay Products And Refractories Market Revenue Share, By Companies, 2025 |
10.2 Belize Clay Products And Refractories Market Competitive Benchmarking, By Operating and Technical Parameters |
11 Company Profiles |
12 Recommendations | 13 Disclaimer |
Global Go To Market Strategy - 2030
Export potential enables firms to identify high-growth global markets with greater confidence by combining advanced trade intelligence with a structured quantitative methodology. The framework analyzes emerging demand trends and country-level import patterns while integrating macroeconomic and trade datasets such as GDP and population forecasts, bilateral import–export flows, tariff structures, elasticity differentials between developed and developing economies, geographic distance, and import demand projections. Using weighted trade values from 2020–2024 as the base period to project country-to-country export potential for 2030, these inputs are operationalized through calculated drivers such as gravity model parameters, tariff impact factors, and projected GDP per-capita growth. Through an analysis of hidden potentials, demand hotspots, and market conditions that are most favorable to success, this method enables firms to focus on target countries, maximize returns, and global expansion with data, backed by accuracy.
By factoring in the projected importer demand gap that is currently unmet and could be potential opportunity, it identifies the potential for the Exporter (Country) among 190 countries, against the general trade analysis, which identifies the biggest importer or exporter.
To discover high-growth global markets and optimize your business strategy:
Click Here
Pricing
- Single User License$ 1,995
- Department License$ 2,400
- Site License$ 3,120
- Global License$ 3,795

Leadership Perspectives from Industry Events
Search
Thought Leadership and Analyst Meet


Our Clients
6WResearch In News
- India Export Attractiveness Tracker 2026
- India Air Conditioner Market Set for Strong Rebound in 2026 After Weather-Led Correction and GST-Driven Recovery: 6Wresearch
- ADAS in India: How Automatic Emergency Braking, Blind Spot Detection & Driver Monitoring are Transforming Road Safety
- Doha a strategic location for EV manufacturing hub: IPA Qatar
- Demand for luxury TVs surging in the GCC, says Samsung
- Empowering Growth: The Thriving Journey of Bangladesh’s Cable Industry
Latest Reports
- Nicaragua RPG Gaming Market (2026-2032)
- New Zealand RPG Gaming Market (2026-2032)
- Netherlands RPG Gaming Market (2026-2032)
- Nauru RPG Gaming Market (2026-2032)
- Namibia RPG Gaming Market (2026-2032)
- Mozambique RPG Gaming Market (2026-2032)
- Montenegro RPG Gaming Market (2026-2032)
- Mongolia RPG Gaming Market (2026-2032)
- Monaco RPG Gaming Market (2026-2032)
- Micronesia RPG Gaming Market (2026-2032)
Industry Events and Analyst Meet

EV India Expo 2026

HIMTEX 2026

India Refining Summit 2026

India EV Show 2026

EV tech India Expo 2026
Whitepaper
- Middle East & Africa Commercial Security Market Click here to view more.
- Middle East & Africa Fire Safety Systems & Equipment Market Click here to view more.
- GCC Drone Market Click here to view more.
- Middle East Lighting Fixture Market Click here to view more.
- GCC Physical & Perimeter Security Market Click here to view more.