Bhutan Canned Tuna Market (2025-2031) | Share, Growth, Value, Forecast, Companies, Segmentation, Size, Trends, Revenue, Analysis, Industry & Outlook
Market Forecast By Product (Skipjack, Yellowfin, Others), By Distribution Channel (Hypermarket & Supermarket, Specialty Stores, Online) And Competitive Landscape
| Product Code: ETC4817000 | Publication Date: Nov 2023 | Updated Date: Sep 2025 | Product Type: Market Research Report | |
| Publisher: 6Wresearch | Author: Sachin Kumar Rai | No. of Pages: 60 | No. of Figures: 30 | No. of Tables: 5 |
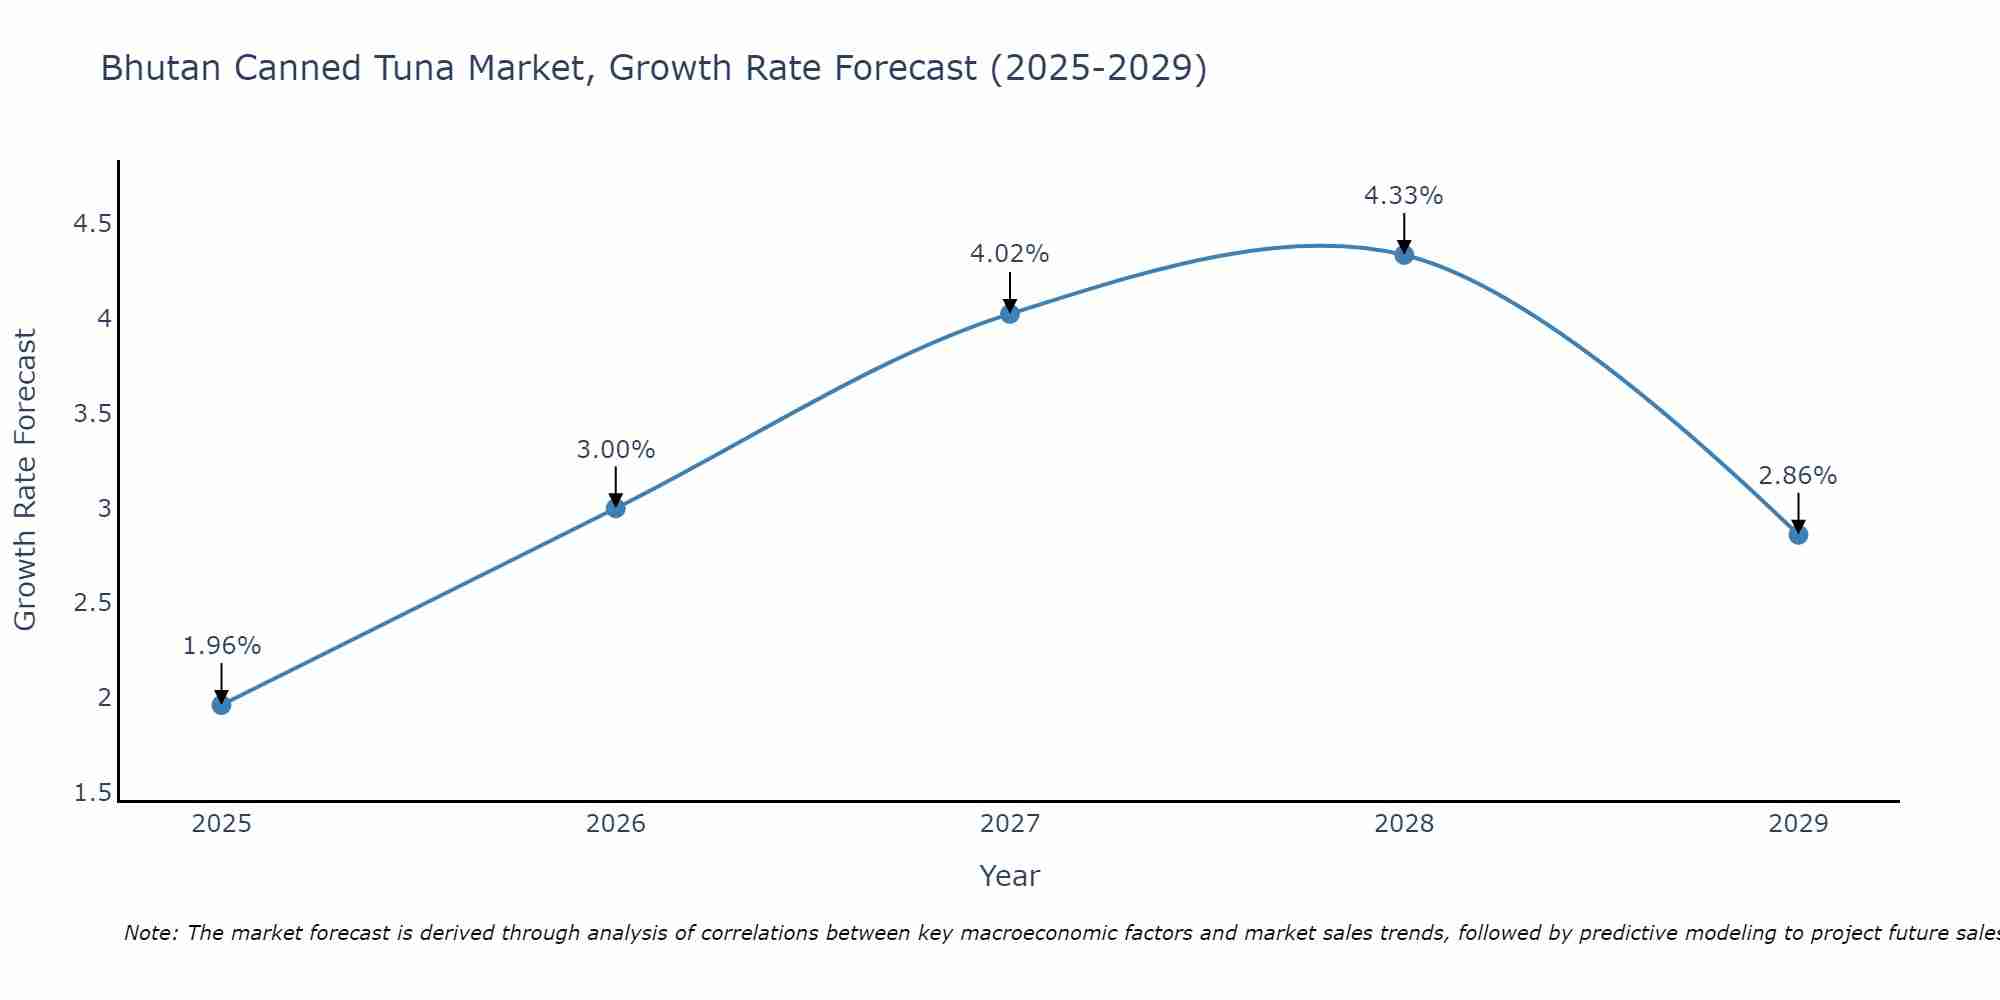
Bhutan Canned Tuna Market Size Growth Rate
The Bhutan Canned Tuna Market is projected to witness mixed growth rate patterns during 2025 to 2029. The growth rate begins at 1.96% in 2025, climbs to a high of 4.33% in 2028, and moderates to 2.86% by 2029.
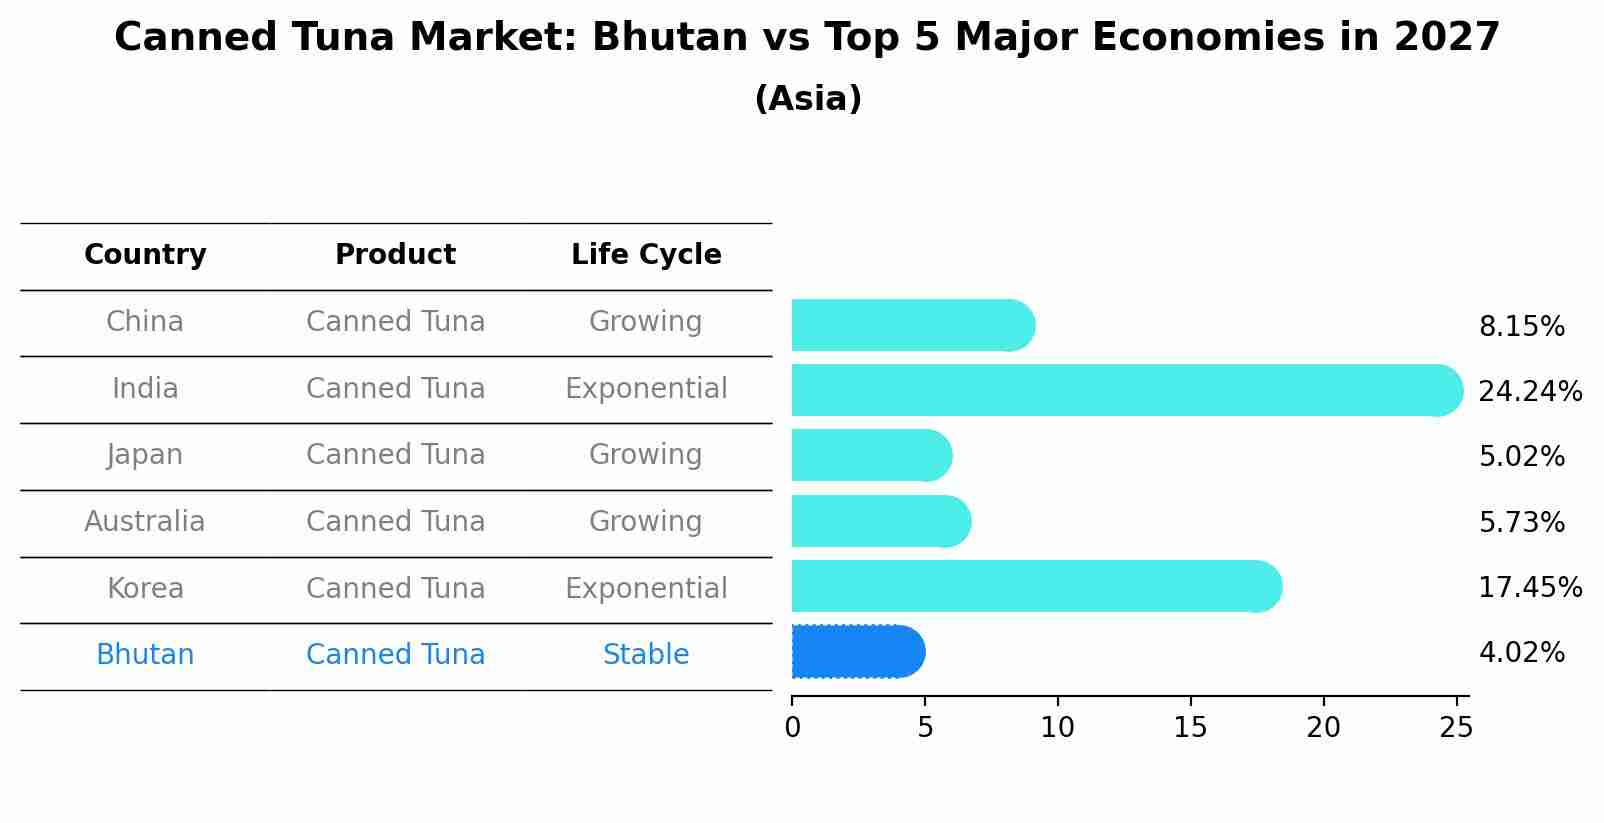
Canned Tuna Market: Bhutan vs Top 5 Major Economies in 2027 (Asia)
In the Asia region, the Canned Tuna market in Bhutan is projected to expand at a stable growth rate of 4.02% by 2027. The largest economy is China, followed by India, Japan, Australia and South Korea.
Bhutan Canned Tuna Market Overview
Canned tuna is one of the most popular seafood products in Bhutan, valued for its convenience and high protein content. The market is primarily served by imports, although there is potential for developing local canning industries. Government policies focus on ensuring food safety and quality standards, as well as supporting sustainable fishing practices to maintain ecological balance.
Drivers of the market
The Bhutan canned tuna market is driven by the high nutritional value of tuna, which is rich in protein and omega-3 fatty acids, making it a popular choice for health-conscious consumers. The convenience and long shelf life of canned tuna make it a staple in households and for individuals with busy lifestyles. The market benefits from the increasing demand for ready-to-eat meals and snacks, where canned tuna is a versatile ingredient. Additionally, the growth of the foodservice industry, including restaurants and catering services, fuels the demand for canned tuna as it provides a quick and easy protein source for various dishes.
Challenges of the market
The canned tuna market in Bhutan struggles with high import costs and limited consumer demand. The small market size and preference for fresh or locally sourced fish reduce the appeal of canned tuna. Additionally, concerns about the sustainability and quality of imported canned tuna affect consumer trust and demand. The lack of marketing and awareness about the convenience and health benefits of canned tuna also hampers market growth.
Government Policy of the market
Canned tuna is part of Bhutan`s broader canned seafood market, heavily dependent on imports. Government policies on food imports and tariffs can significantly impact the availability and pricing of canned tuna. Efforts to ensure food safety and promote balanced nutrition among the population might drive demand for such protein sources. Additionally, Bhutans initiatives to promote tourism and modern lifestyles could indirectly influence the market by increasing exposure to international food trends.
Key Highlights of the Report:
- Bhutan Canned Tuna Market Outlook
- Market Size of Bhutan Canned Tuna Market, 2024
- Forecast of Bhutan Canned Tuna Market, 2031
- Historical Data and Forecast of Bhutan Canned Tuna Revenues & Volume for the Period 2021-2031
- Bhutan Canned Tuna Market Trend Evolution
- Bhutan Canned Tuna Market Drivers and Challenges
- Bhutan Canned Tuna Price Trends
- Bhutan Canned Tuna Porter`s Five Forces
- Bhutan Canned Tuna Industry Life Cycle
- Historical Data and Forecast of Bhutan Canned Tuna Market Revenues & Volume By Product for the Period 2021-2031
- Historical Data and Forecast of Bhutan Canned Tuna Market Revenues & Volume By Skipjack for the Period 2021-2031
- Historical Data and Forecast of Bhutan Canned Tuna Market Revenues & Volume By Yellowfin for the Period 2021-2031
- Historical Data and Forecast of Bhutan Canned Tuna Market Revenues & Volume By Others for the Period 2021-2031
- Historical Data and Forecast of Bhutan Canned Tuna Market Revenues & Volume By Distribution Channel for the Period 2021-2031
- Historical Data and Forecast of Bhutan Canned Tuna Market Revenues & Volume By Hypermarket & Supermarket for the Period 2021-2031
- Historical Data and Forecast of Bhutan Canned Tuna Market Revenues & Volume By Specialty Stores for the Period 2021-2031
- Historical Data and Forecast of Bhutan Canned Tuna Market Revenues & Volume By Online for the Period 2021-2031
- Bhutan Canned Tuna Import Export Trade Statistics
- Market Opportunity Assessment By Product
- Market Opportunity Assessment By Distribution Channel
- Bhutan Canned Tuna Top Companies Market Share
- Bhutan Canned Tuna Competitive Benchmarking By Technical and Operational Parameters
- Bhutan Canned Tuna Company Profiles
- Bhutan Canned Tuna Key Strategic Recommendations
Frequently Asked Questions About the Market Study (FAQs):
6Wresearch actively monitors the Bhutan Canned Tuna Market and publishes its comprehensive annual report, highlighting emerging trends, growth drivers, revenue analysis, and forecast outlook. Our insights help businesses to make data-backed strategic decisions with ongoing market dynamics. Our analysts track relevent industries related to the Bhutan Canned Tuna Market, allowing our clients with actionable intelligence and reliable forecasts tailored to emerging regional needs.
Yes, we provide customisation as per your requirements. To learn more, feel free to contact us on sales@6wresearch.com
1 Executive Summary |
2 Introduction |
2.1 Key Highlights of the Report |
2.2 Report Description |
2.3 Market Scope & Segmentation |
2.4 Research Methodology |
2.5 Assumptions |
3 Bhutan Canned Tuna Market Overview |
3.1 Bhutan Country Macro Economic Indicators |
3.2 Bhutan Canned Tuna Market Revenues & Volume, 2021 & 2031F |
3.3 Bhutan Canned Tuna Market - Industry Life Cycle |
3.4 Bhutan Canned Tuna Market - Porter's Five Forces |
3.5 Bhutan Canned Tuna Market Revenues & Volume Share, By Product, 2021 & 2031F |
3.6 Bhutan Canned Tuna Market Revenues & Volume Share, By Distribution Channel, 2021 & 2031F |
4 Bhutan Canned Tuna Market Dynamics |
4.1 Impact Analysis |
4.2 Market Drivers |
4.2.1 Increasing health consciousness and awareness about the benefits of consuming seafood. |
4.2.2 Growing demand for convenient and ready-to-eat food products. |
4.2.3 Rising disposable income leading to higher purchasing power for premium food items. |
4.3 Market Restraints |
4.3.1 Limited availability of raw materials such as tuna in Bhutan. |
4.3.2 High import dependency for tuna leading to potential supply chain disruptions. |
4.3.3 Price volatility in the global tuna market impacting the cost of canned tuna production in Bhutan. |
5 Bhutan Canned Tuna Market Trends |
6 Bhutan Canned Tuna Market Segmentations |
6.1 Bhutan Canned Tuna Market, By Product |
6.1.1 Overview and Analysis |
6.1.2 Bhutan Canned Tuna Market Revenues & Volume, By Skipjack, 2021-2031F |
6.1.3 Bhutan Canned Tuna Market Revenues & Volume, By Yellowfin, 2021-2031F |
6.1.4 Bhutan Canned Tuna Market Revenues & Volume, By Others, 2021-2031F |
6.2 Bhutan Canned Tuna Market, By Distribution Channel |
6.2.1 Overview and Analysis |
6.2.2 Bhutan Canned Tuna Market Revenues & Volume, By Hypermarket & Supermarket, 2021-2031F |
6.2.3 Bhutan Canned Tuna Market Revenues & Volume, By Specialty Stores, 2021-2031F |
6.2.4 Bhutan Canned Tuna Market Revenues & Volume, By Online, 2021-2031F |
7 Bhutan Canned Tuna Market Import-Export Trade Statistics |
7.1 Bhutan Canned Tuna Market Export to Major Countries |
7.2 Bhutan Canned Tuna Market Imports from Major Countries |
8 Bhutan Canned Tuna Market Key Performance Indicators |
8.1 Consumer engagement and awareness levels about canned tuna through social media interactions and online searches. |
8.2 Number of new product launches and innovations in the canned tuna market in Bhutan. |
8.3 Percentage of repeat purchases and customer loyalty for canned tuna brands in Bhutan. |
9 Bhutan Canned Tuna Market - Opportunity Assessment |
9.1 Bhutan Canned Tuna Market Opportunity Assessment, By Product, 2021 & 2031F |
9.2 Bhutan Canned Tuna Market Opportunity Assessment, By Distribution Channel, 2021 & 2031F |
10 Bhutan Canned Tuna Market - Competitive Landscape |
10.1 Bhutan Canned Tuna Market Revenue Share, By Companies, 2024 |
10.2 Bhutan Canned Tuna Market Competitive Benchmarking, By Operating and Technical Parameters |
11 Company Profiles |
12 Recommendations | 13 Disclaimer |
Global Go To Market Strategy - 2030
Export potential enables firms to identify high-growth global markets with greater confidence by combining advanced trade intelligence with a structured quantitative methodology. The framework analyzes emerging demand trends and country-level import patterns while integrating macroeconomic and trade datasets such as GDP and population forecasts, bilateral import–export flows, tariff structures, elasticity differentials between developed and developing economies, geographic distance, and import demand projections. Using weighted trade values from 2020–2024 as the base period to project country-to-country export potential for 2030, these inputs are operationalized through calculated drivers such as gravity model parameters, tariff impact factors, and projected GDP per-capita growth. Through an analysis of hidden potentials, demand hotspots, and market conditions that are most favorable to success, this method enables firms to focus on target countries, maximize returns, and global expansion with data, backed by accuracy.
By factoring in the projected importer demand gap that is currently unmet and could be potential opportunity, it identifies the potential for the Exporter (Country) among 190 countries, against the general trade analysis, which identifies the biggest importer or exporter.
To discover high-growth global markets and optimize your business strategy:
Click Here
Pricing
- Single User License$ 1,995
- Department License$ 2,400
- Site License$ 3,120
- Global License$ 3,795

Leadership Perspectives from Industry Events
Search
Thought Leadership and Analyst Meet


Our Clients
6WResearch In News
- India Export Attractiveness Tracker 2026
- India Air Conditioner Market Set for Strong Rebound in 2026 After Weather-Led Correction and GST-Driven Recovery: 6Wresearch
- ADAS in India: How Automatic Emergency Braking, Blind Spot Detection & Driver Monitoring are Transforming Road Safety
- Doha a strategic location for EV manufacturing hub: IPA Qatar
- Demand for luxury TVs surging in the GCC, says Samsung
- Empowering Growth: The Thriving Journey of Bangladesh’s Cable Industry
Latest Reports
- Nicaragua RPG Gaming Market (2026-2032)
- New Zealand RPG Gaming Market (2026-2032)
- Netherlands RPG Gaming Market (2026-2032)
- Nauru RPG Gaming Market (2026-2032)
- Namibia RPG Gaming Market (2026-2032)
- Mozambique RPG Gaming Market (2026-2032)
- Montenegro RPG Gaming Market (2026-2032)
- Mongolia RPG Gaming Market (2026-2032)
- Monaco RPG Gaming Market (2026-2032)
- Micronesia RPG Gaming Market (2026-2032)
Industry Events and Analyst Meet

EV India Expo 2026

HIMTEX 2026

India Refining Summit 2026

India EV Show 2026

EV tech India Expo 2026
Whitepaper
- Middle East & Africa Commercial Security Market Click here to view more.
- Middle East & Africa Fire Safety Systems & Equipment Market Click here to view more.
- GCC Drone Market Click here to view more.
- Middle East Lighting Fixture Market Click here to view more.
- GCC Physical & Perimeter Security Market Click here to view more.