Botswana Cryogenic Valve Market (2026-2032) | Analysis, Segmentation, Companies, Value, Forecast, Share, Outlook, Size, Growth, Industry, Trends & Revenue
Market Forecast By Gas (LNG, Oxygen, Nitrogen), By Type (Globe, Gate, Ball), By End-User (Energy & Power, Food, Chemicals) And Competitive Landscape
| Product Code: ETC5775515 | Publication Date: Nov 2023 | Updated Date: Mar 2026 | Product Type: Market Research Report | |
| Publisher: 6Wresearch | Author: Sumit Sagar | No. of Pages: 60 | No. of Figures: 30 | No. of Tables: 5 |
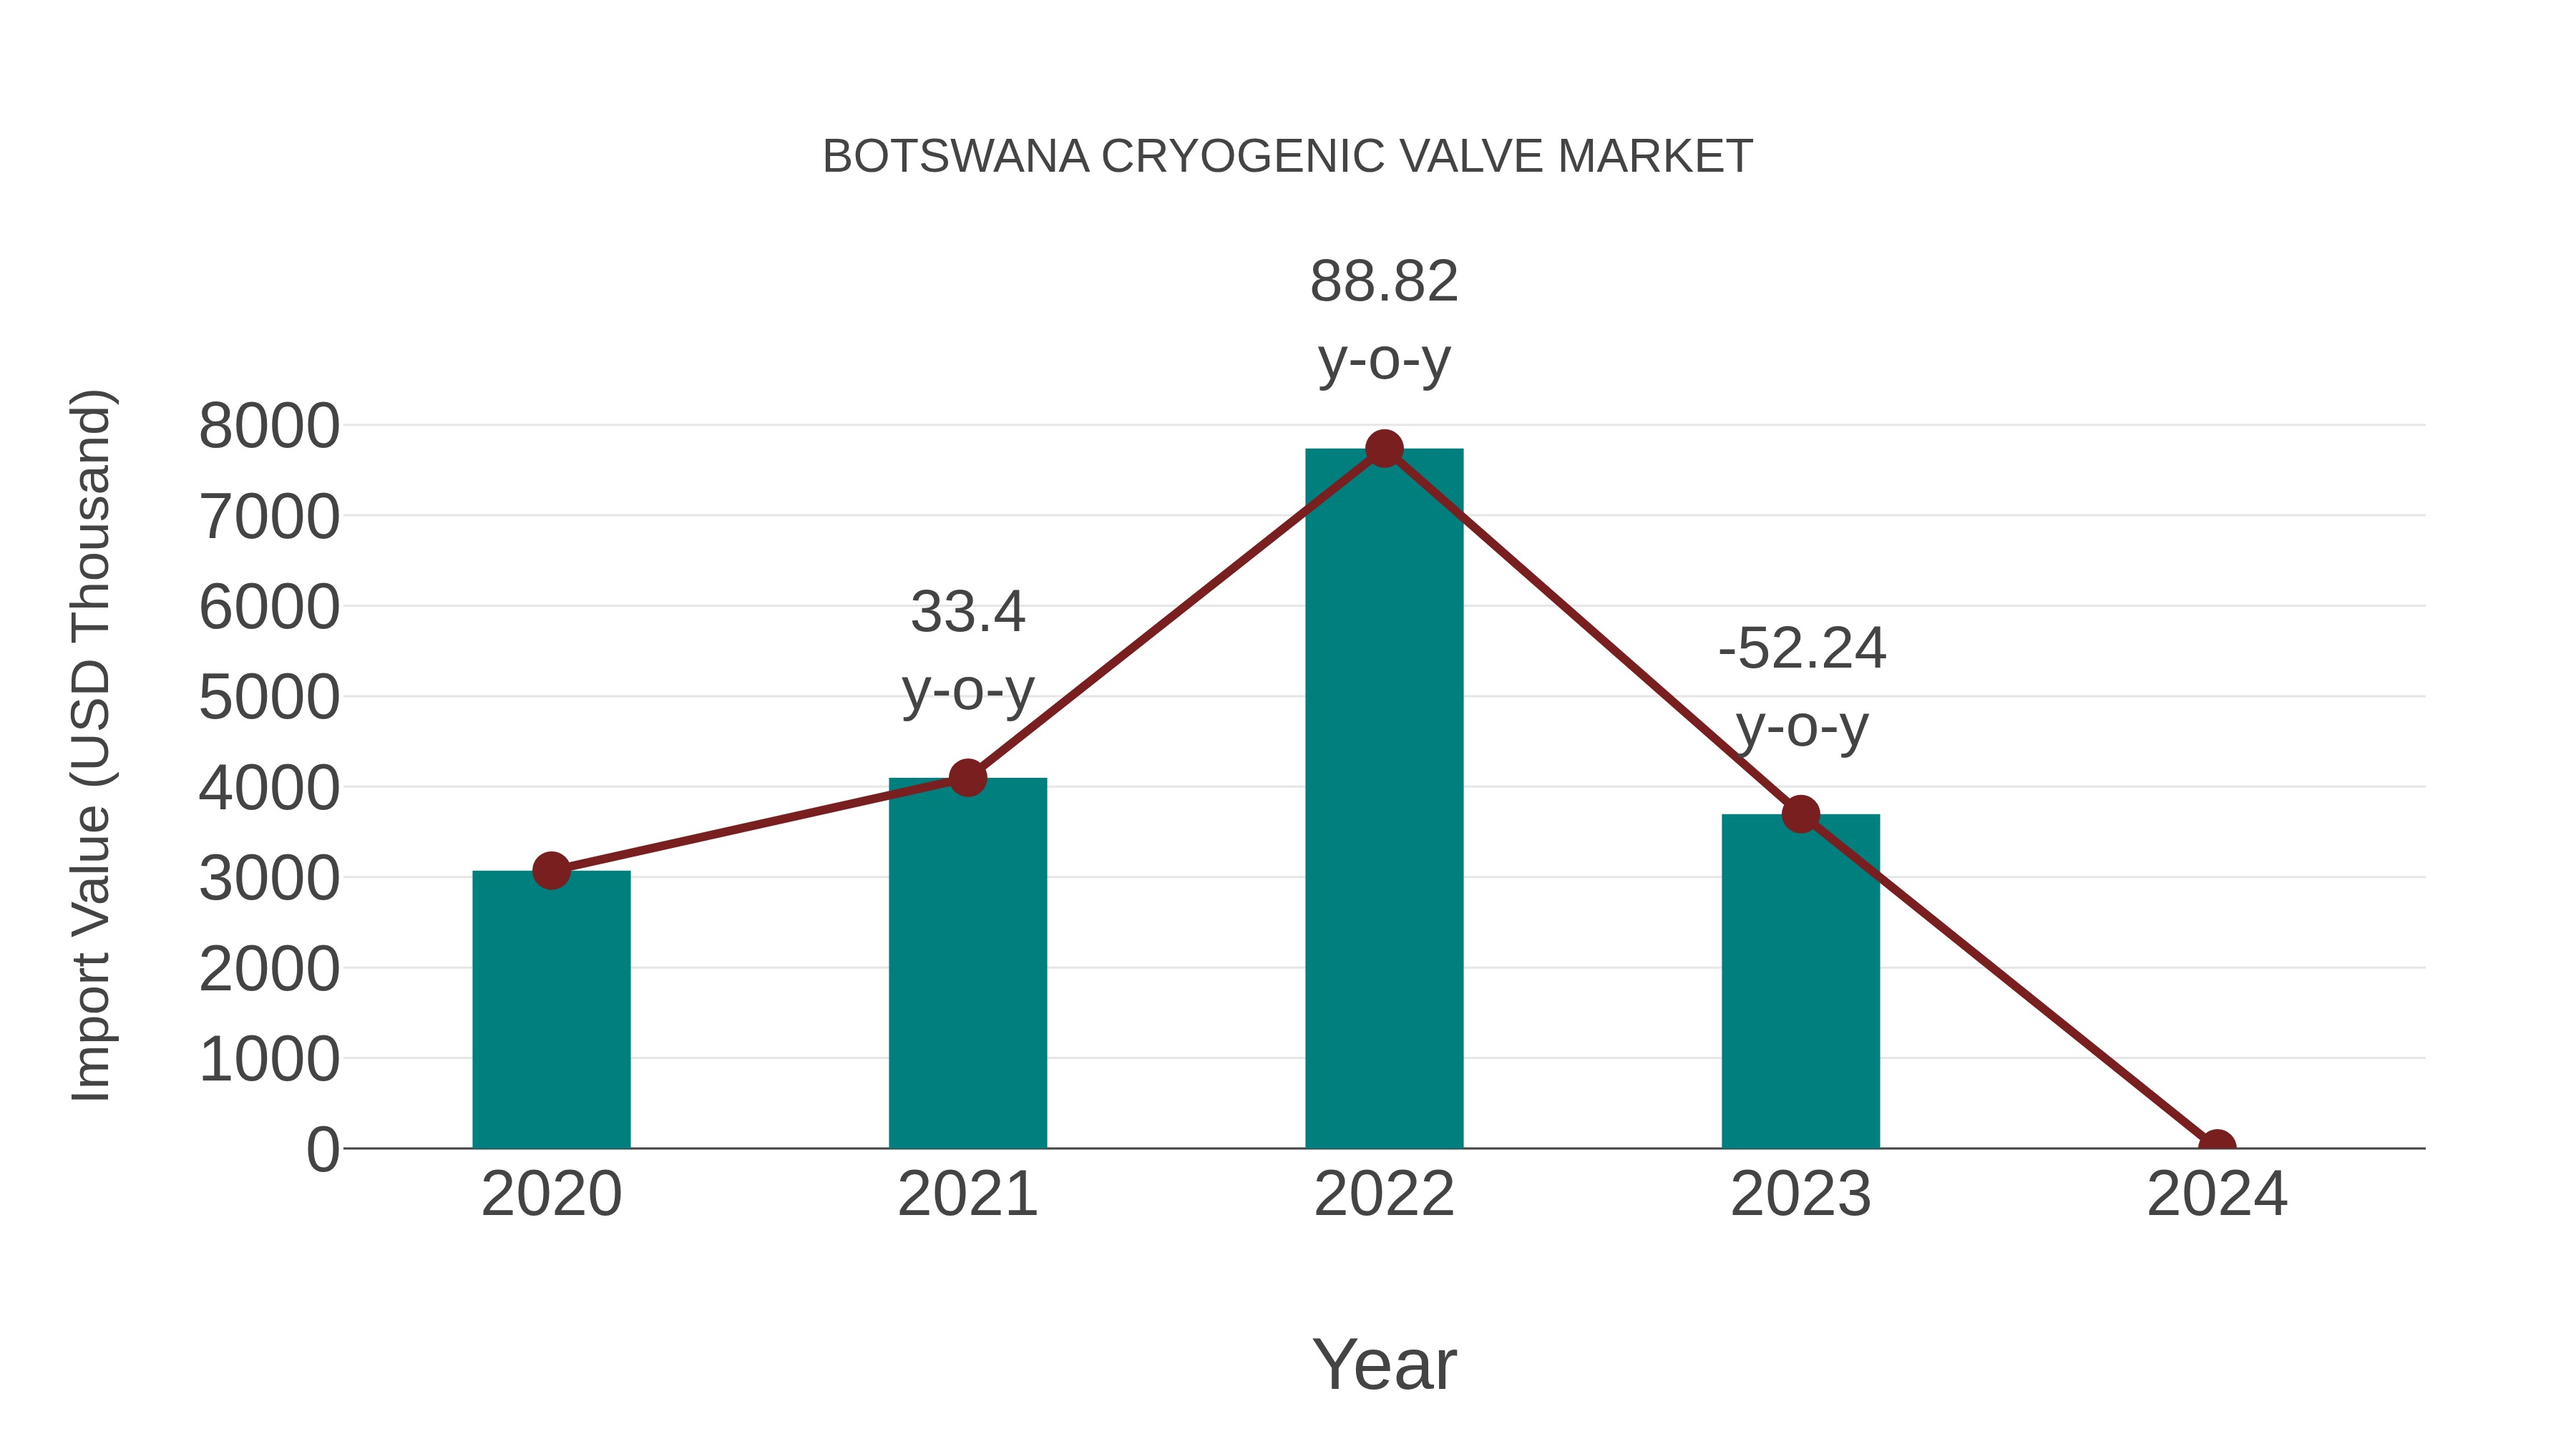
Botswana Cryogenic Valve Market: Import Trend Analysis
The Botswana cryogenic valve market experienced steady growth in imports from 2020 to 2024, with a compound annual growth rate (CAGR) of 6.36%. Despite a zero year-on-year growth rate in 2023-2024, the overall increase in imports over the period was driven by consistent growth in the preceding years.
Botswana Cryogenic Valve Market Overview
The cryogenic valve market in Botswana is growing as industries require valves that can operate effectively at extremely low temperatures. Cryogenic valves are essential for controlling the flow of cryogenic liquids and gases in storage and transport applications. Market expansion is supported by advancements in valve technologies and the increasing need for reliable and safe cryogenic systems.
Drivers of the market
The cryogenic valve market in Botswana is experiencing growth due to the essential role of cryogenic valves in controlling the flow of cryogenic fluids in various industrial and scientific applications. Cryogenic valves are designed to operate at extremely low temperatures and are critical for maintaining the integrity and safety of cryogenic systems. The market growth is driven by the expansion of industries such as LNG, aerospace, and healthcare, which rely on cryogenic valves for efficient and safe fluid management. Advances in valve technologies, including enhanced materials and designs that improve performance and reliability, are also contributing to market growth. The increasing demand for cryogenic solutions and infrastructure development is supporting the market`s expansion.
Challenges of the market
The cryogenic valve market in Botswana faces challenges due to high import costs and limited local manufacturing capabilities. The market is constrained by limited demand from local industrial and energy sectors and competition from alternative valve solutions. Additionally, fluctuations in global valve prices and slower adoption rates impact market growth. The lack of local infrastructure and distribution networks further affects market development.
Government Policy of the market
The cryogenic valve market in Botswana is shaped by government policies that promote the development of the energy and industrial sectors. The government encourages the use of high-performance cryogenic valves in LNG processing and other cryogenic applications. Regulations ensuring the safety and reliability of cryogenic systems are key factors driving this market.
Key Highlights of the Report:
- Botswana Cryogenic Valve Market Outlook
- Market Size of Botswana Cryogenic Valve Market, 2025
- Forecast of Botswana Cryogenic Valve Market, 2032
- Historical Data and Forecast of Botswana Cryogenic Valve Revenues & Volume for the Period 2022-2032F
- Botswana Cryogenic Valve Market Trend Evolution
- Botswana Cryogenic Valve Market Drivers and Challenges
- Botswana Cryogenic Valve Price Trends
- Botswana Cryogenic Valve Porter`s Five Forces
- Botswana Cryogenic Valve Industry Life Cycle
- Historical Data and Forecast of Botswana Cryogenic Valve Market Revenues & Volume By Gas for the Period 2022-2032F
- Historical Data and Forecast of Botswana Cryogenic Valve Market Revenues & Volume By LNG for the Period 2022-2032F
- Historical Data and Forecast of Botswana Cryogenic Valve Market Revenues & Volume By Oxygen for the Period 2022-2032F
- Historical Data and Forecast of Botswana Cryogenic Valve Market Revenues & Volume By Nitrogen for the Period 2022-2032F
- Historical Data and Forecast of Botswana Cryogenic Valve Market Revenues & Volume By Type for the Period 2022-2032F
- Historical Data and Forecast of Botswana Cryogenic Valve Market Revenues & Volume By Globe for the Period 2022-2032F
- Historical Data and Forecast of Botswana Cryogenic Valve Market Revenues & Volume By Gate for the Period 2022-2032F
- Historical Data and Forecast of Botswana Cryogenic Valve Market Revenues & Volume By Ball for the Period 2022-2032F
- Historical Data and Forecast of Botswana Cryogenic Valve Market Revenues & Volume By End-User for the Period 2022-2032F
- Historical Data and Forecast of Botswana Cryogenic Valve Market Revenues & Volume By Energy & Power for the Period 2022-2032F
- Historical Data and Forecast of Botswana Cryogenic Valve Market Revenues & Volume By Food for the Period 2022-2032F
- Historical Data and Forecast of Botswana Cryogenic Valve Market Revenues & Volume By Chemicals for the Period 2022-2032F
- Botswana Cryogenic Valve Import Export Trade Statistics
- Market Opportunity Assessment By Gas
- Market Opportunity Assessment By Type
- Market Opportunity Assessment By End-User
- Botswana Cryogenic Valve Top Companies Market Share
- Botswana Cryogenic Valve Competitive Benchmarking By Technical and Operational Parameters
- Botswana Cryogenic Valve Company Profiles
- Botswana Cryogenic Valve Key Strategic Recommendations
Botswana Cryogenic Valve Market (2026-2032): FAQs
6Wresearch actively monitors the Botswana Cryogenic Valve Market and publishes its comprehensive annual report, highlighting emerging trends, growth drivers, revenue analysis, and forecast outlook. Our insights help businesses to make data-backed strategic decisions with ongoing market dynamics. Our analysts track relevent industries related to the Botswana Cryogenic Valve Market, allowing our clients with actionable intelligence and reliable forecasts tailored to emerging regional needs.
Yes, we provide customisation as per your requirements. To learn more, feel free to contact us on sales@6wresearch.com
1 Executive Summary |
2 Introduction |
2.1 Key Highlights of the Report |
2.2 Report Description |
2.3 Market Scope & Segmentation |
2.4 Research Methodology |
2.5 Assumptions |
3 Botswana Cryogenic Valve Market Overview |
3.1 Botswana Country Macro Economic Indicators |
3.2 Botswana Cryogenic Valve Market Revenues & Volume, 2022 & 2032F |
3.3 Botswana Cryogenic Valve Market - Industry Life Cycle |
3.4 Botswana Cryogenic Valve Market - Porter's Five Forces |
3.5 Botswana Cryogenic Valve Market Revenues & Volume Share, By Gas, 2022 & 2032F |
3.6 Botswana Cryogenic Valve Market Revenues & Volume Share, By Type, 2022 & 2032F |
3.7 Botswana Cryogenic Valve Market Revenues & Volume Share, By End-User, 2022 & 2032F |
4 Botswana Cryogenic Valve Market Dynamics |
4.1 Impact Analysis |
4.2 Market Drivers |
4.2.1 Increasing demand for liquefied natural gas (LNG) in Botswana |
4.2.2 Growth in industrial activities and infrastructure development |
4.2.3 Rising focus on energy efficiency and sustainability in the country |
4.3 Market Restraints |
4.3.1 High initial investment and maintenance costs associated with cryogenic valves |
4.3.2 Limited awareness and understanding of cryogenic valve technology in Botswana |
4.3.3 Lack of skilled workforce for handling and maintaining cryogenic valves |
5 Botswana Cryogenic Valve Market Trends |
6 Botswana Cryogenic Valve Market Segmentations |
6.1 Botswana Cryogenic Valve Market, By Gas |
6.1.1 Overview and Analysis |
6.1.2 Botswana Cryogenic Valve Market Revenues & Volume, By LNG, 2022-2032F |
6.1.3 Botswana Cryogenic Valve Market Revenues & Volume, By Oxygen, 2022-2032F |
6.1.4 Botswana Cryogenic Valve Market Revenues & Volume, By Nitrogen, 2022-2032F |
6.2 Botswana Cryogenic Valve Market, By Type |
6.2.1 Overview and Analysis |
6.2.2 Botswana Cryogenic Valve Market Revenues & Volume, By Globe, 2022-2032F |
6.2.3 Botswana Cryogenic Valve Market Revenues & Volume, By Gate, 2022-2032F |
6.2.4 Botswana Cryogenic Valve Market Revenues & Volume, By Ball, 2022-2032F |
6.3 Botswana Cryogenic Valve Market, By End-User |
6.3.1 Overview and Analysis |
6.3.2 Botswana Cryogenic Valve Market Revenues & Volume, By Energy & Power, 2022-2032F |
6.3.3 Botswana Cryogenic Valve Market Revenues & Volume, By Food, 2022-2032F |
6.3.4 Botswana Cryogenic Valve Market Revenues & Volume, By Chemicals, 2022-2032F |
7 Botswana Cryogenic Valve Market Import-Export Trade Statistics |
7.1 Botswana Cryogenic Valve Market Export to Major Countries |
7.2 Botswana Cryogenic Valve Market Imports from Major Countries |
8 Botswana Cryogenic Valve Market Key Performance Indicators |
8.1 Adoption rate of cryogenic valve technology in key industries in Botswana |
8.2 Number of new infrastructure projects using cryogenic valves |
8.3 Percentage of companies investing in training programs for cryogenic valve operation and maintenance |
9 Botswana Cryogenic Valve Market - Opportunity Assessment |
9.1 Botswana Cryogenic Valve Market Opportunity Assessment, By Gas, 2022 & 2032F |
9.2 Botswana Cryogenic Valve Market Opportunity Assessment, By Type, 2022 & 2032F |
9.3 Botswana Cryogenic Valve Market Opportunity Assessment, By End-User, 2022 & 2032F |
10 Botswana Cryogenic Valve Market - Competitive Landscape |
10.1 Botswana Cryogenic Valve Market Revenue Share, By Companies, 2025 |
10.2 Botswana Cryogenic Valve Market Competitive Benchmarking, By Operating and Technical Parameters |
11 Company Profiles |
12 Recommendations | 13 Disclaimer |
Global Go To Market Strategy - 2030
Export potential enables firms to identify high-growth global markets with greater confidence by combining advanced trade intelligence with a structured quantitative methodology. The framework analyzes emerging demand trends and country-level import patterns while integrating macroeconomic and trade datasets such as GDP and population forecasts, bilateral import–export flows, tariff structures, elasticity differentials between developed and developing economies, geographic distance, and import demand projections. Using weighted trade values from 2020–2024 as the base period to project country-to-country export potential for 2030, these inputs are operationalized through calculated drivers such as gravity model parameters, tariff impact factors, and projected GDP per-capita growth. Through an analysis of hidden potentials, demand hotspots, and market conditions that are most favorable to success, this method enables firms to focus on target countries, maximize returns, and global expansion with data, backed by accuracy.
By factoring in the projected importer demand gap that is currently unmet and could be potential opportunity, it identifies the potential for the Exporter (Country) among 190 countries, against the general trade analysis, which identifies the biggest importer or exporter.
To discover high-growth global markets and optimize your business strategy:
Click Here
Pricing
- Single User License$ 1,995
- Department License$ 2,400
- Site License$ 3,120
- Global License$ 3,795

Leadership Perspectives from Industry Events
Search
Thought Leadership and Analyst Meet


Our Clients
6WResearch In News
- India Air Conditioner Market Set for Strong Rebound in 2026 After Weather-Led Correction and GST-Driven Recovery: 6Wresearch
- ADAS in India: How Automatic Emergency Braking, Blind Spot Detection & Driver Monitoring are Transforming Road Safety
- Doha a strategic location for EV manufacturing hub: IPA Qatar
- Demand for luxury TVs surging in the GCC, says Samsung
- Empowering Growth: The Thriving Journey of Bangladesh’s Cable Industry
- Demand for luxury TVs surging in the GCC, says Samsung
Latest Reports
- Poland Fire Protection Systems Market (2026-2032)
- Cape Verde Portable Hand-Thrown Extinguisher Market (2026-2032)
- Canada Portable Hand-Thrown Extinguisher Market (2026-2032)
- Cameroon Portable Hand-Thrown Extinguisher Market (2026-2032)
- Burundi Portable Hand-Thrown Extinguisher Market (2026-2032)
- Burkina Faso Portable Hand-Thrown Extinguisher Market (2026-2032)
- Bulgaria Portable Hand-Thrown Extinguisher Market (2026-2032)
- Brunei Portable Hand-Thrown Extinguisher Market (2026-2032)
- Botswana Portable Hand-Thrown Extinguisher Market (2026-2032)
- Bosnia and Herzegovina Portable Hand-Thrown Extinguisher Market (2026-2032)
Industry Events and Analyst Meet

HIMTEX 2026

India Refining Summit 2026

India EV Show 2026

EV tech India Expo 2026

Auto Tech Asia 2026
Whitepaper
- Middle East & Africa Commercial Security Market Click here to view more.
- Middle East & Africa Fire Safety Systems & Equipment Market Click here to view more.
- GCC Drone Market Click here to view more.
- Middle East Lighting Fixture Market Click here to view more.
- GCC Physical & Perimeter Security Market Click here to view more.