Brazil Interactive Tables Market (2026-2032) Outlook | Forecast, Revenue, Analysis, Companies, Share, Growth, Size, Trends, Industry & Value
Market Forecast By Technology (LCD, LED, Capacitive, Others), By Screen Size (32-65 Inch, 65 Inch & Above), By Application (Exhibition & Trade Shows, Education, Retail, Control Room, Hospitality, Transportation, Others) And Competitive Landscape
| Product Code: ETC275042 | Publication Date: Aug 2022 | Updated Date: Jul 2026 | Product Type: Market Research Report | |
| Publisher: 6Wresearch | Author: Ravi Bhandari | No. of Pages: 75 | No. of Figures: 35 | No. of Tables: 20 |
Brazil Interactive Tables Market Size, Share & Growth Rate
The Brazil Interactive Tables Market was estimated at USD 235 Million in 2025 and is projected to reach USD 280 Million by 2032, growing at a CAGR of 2.5% from 2026 to 2032. This anticipated growth is largely driven by the increasing demand for innovative educational tools and collaborative business solutions, both of which leverage the capabilities of interactive tables. Furthermore, the integration of advanced technologies in interactive displays is reshaping how users engage with information, enhancing the appeal of these devices across various sectors.
Brazil Interactive Tables Market Year-wise Growth Rate and Key Drivers
This graph highlights how the Brazil Interactive Tables Market has steadily grown over the years, supported by major growth factors.
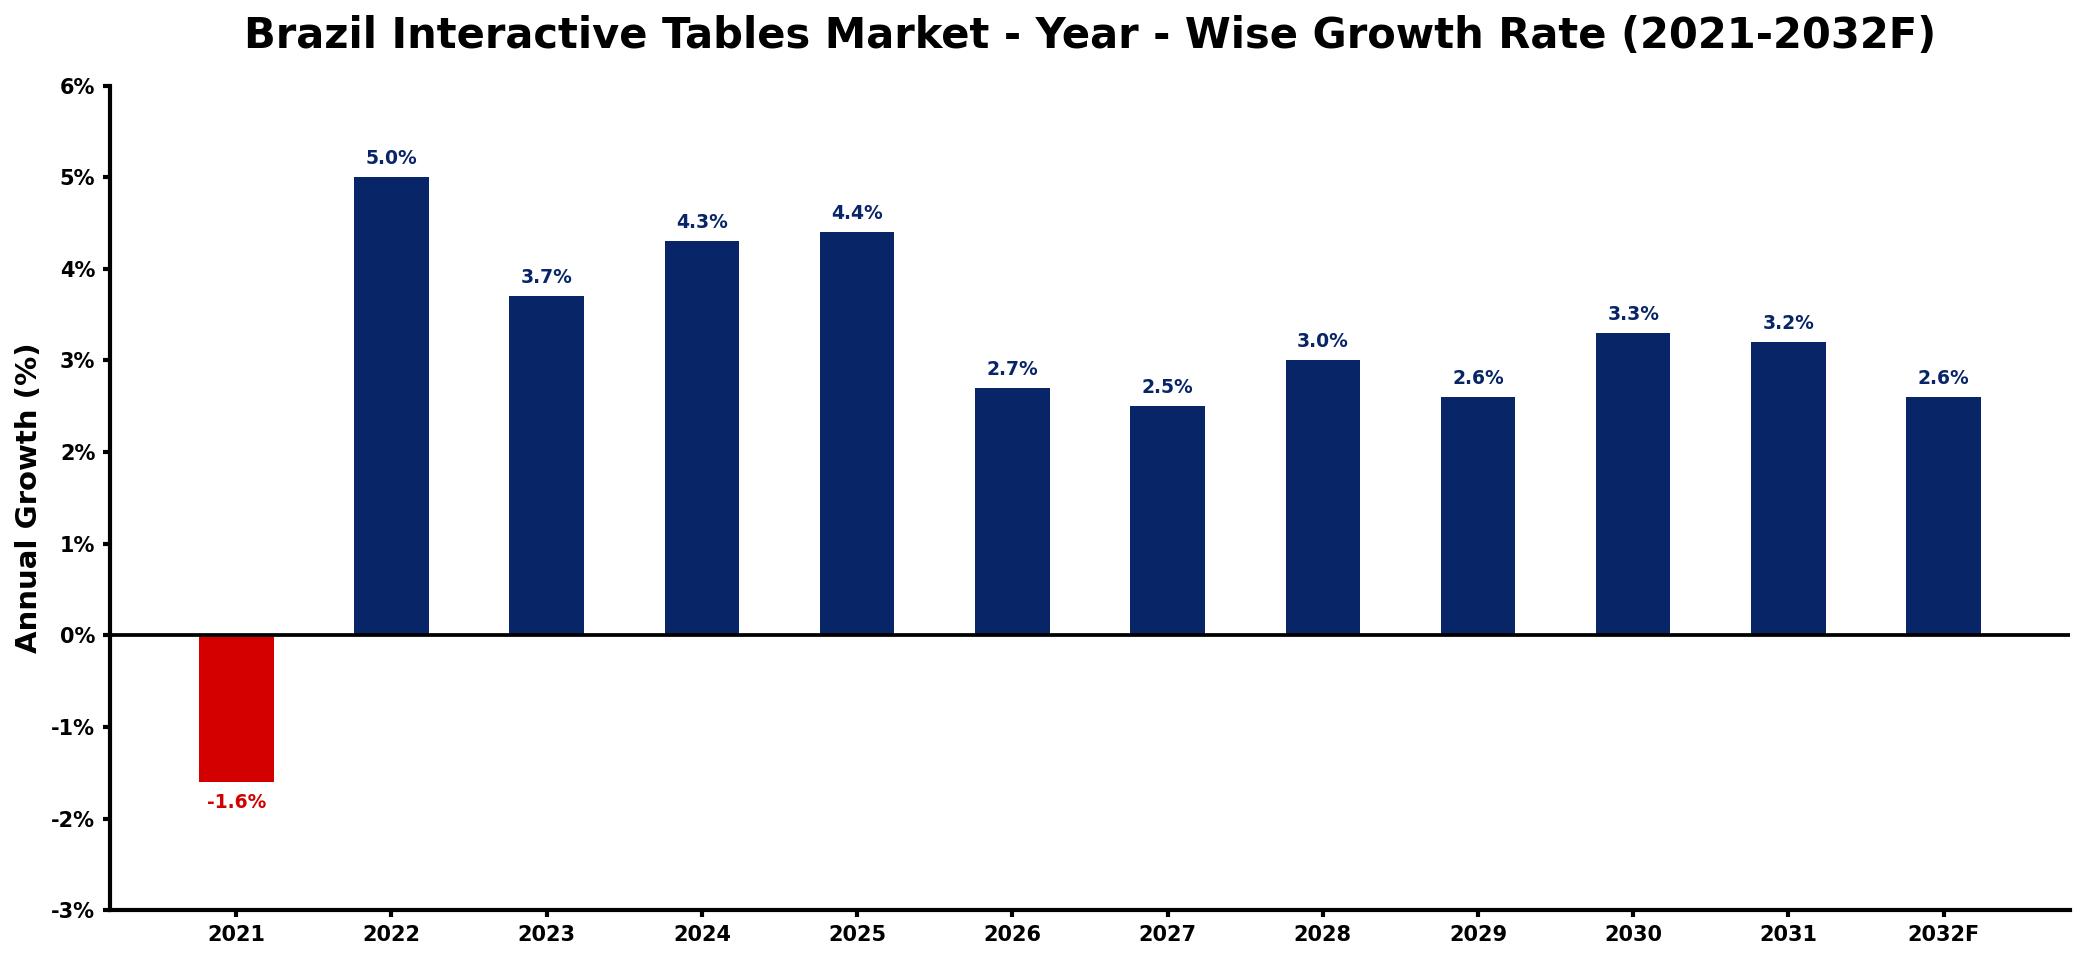
The table below presents the year‑wise growth rates along with the key drivers influencing the market
| Year | Growth Rate | Major Drivers |
| 2021 | -1.6% | weak regional consumption demand |
| 2022 | 5.0% | increased demand for educational tools |
| 2023 | 3.7% | growing investment in digital interfaces |
| 2024 | 4.3% | expansion of hospitality sector offerings |
| 2025 | 4.4% | rise in corporate training solutions |
| 2026 | 2.7% | increased capital investment inflows |
| 2027 | 2.5% | growth in retail customer engagement |
| 2028 | 3.0% | enhanced demand for event technology |
| 2029 | 2.6% | boost in tourism-related services |
| 2030 | 3.3% | accelerated development of smart environments |
| 2031 | 3.2% | surge in entertainment venue innovations |
| 2032 | 2.6% | rising demand from electronics |
Note: Market size estimations and growth projections presented in this report are based on 6Wresearch's proprietary forecasting methodology, utilizing the latest available industry data, government publications, and primary research inputs.
Brazil Interactive Tables Market Synopsis
A notable aspect of the Brazil Interactive Tables Market is the significant adoption of these technologies in educational environments, where they are used to enhance learning experiences. Schools and universities are increasingly recognizing the value of interactive tables as a means to foster engagement and collaboration among students.
On the corporate front, businesses are turning to interactive tables for innovative presentation solutions and collaborative meetings. This shift is creating an intersection of demand that not only highlights technological advancement but also the evolving needs of modern workspaces and learning environments.
Brazil Interactive Tables Market Key Takeaways
- Interactive tables are rapidly gaining traction in Brazilian educational institutions, enhancing collaborative learning environments.
- Businesses are increasingly investing in interactive tables to improve engagement during presentations and meetings.
- Technological advancements are driving continuous innovation in features and functionalities of interactive tables.
- Government initiatives promoting digital literacy and modernized educational infrastructure are bolstering market growth.
- The market faces pressure to innovate rapidly due to shifting consumer preferences for advanced, feature-rich products.
Evaluation of Restraints in Brazil Interactive Tables Market
Despite the promising outlook, the Brazil Interactive Tables Market is hampered by several challenges. Rapid technological advancements mean that manufacturers must continually innovate to meet consumer expectations. This necessity places a strain on production processes and can lead to increased costs. Furthermore, as the market evolves, maintaining affordability while introducing new features can become a precarious balance. Failure to adapt to these demands may lead to obsolescence, creating barriers for both new entrants and established players.
Brazil Interactive Tables Market Trends
The current landscape of the Brazil Interactive Tables Market is characterized by several noteworthy trends. There is a growing emphasis on seamless integration with existing technologies, allowing users to enjoy a more cohesive digital experience. Additionally, interactive tables are incorporating features such as touchless interaction and enhanced connectivity options, addressing both user convenience and hygiene concerns in post-pandemic environments.
Moreover, the rise of hybrid learning and remote work arrangements is creating new opportunities for interactive tables to support distance collaboration, further broadening their appeal. These developments reflect a market that is not only adapting but thriving amid changing consumer behaviors and technological advancements.
Brazil Interactive Tables Market Opportunities
There is a wealth of growth potential within the Brazil Interactive Tables Market, particularly in sectors that prioritize innovation and interactivity. The increasing focus on digital transformation in educational and corporate environments is fostering investment opportunities. Additionally, emerging trends such as augmented reality (AR) and virtual reality (VR) applications within interactive tables are set to revolutionize user experiences. Companies willing to invest in these technologies stand to benefit from first-mover advantages in a market ripe for transformation.
Government Initiatives in the Brazil Interactive Tables Market
The Brazilian government has taken proactive measures to bolster the integration of technology in both educational and business sectors. Policies aimed at enhancing digital literacy and modernizing educational infrastructure have opened doors for increased adoption of interactive tables. Various initiatives support the introduction of these technologies in schools, alongside programs encouraging businesses to upgrade their presentation and collaborative tools, thus stimulating market growth. Such governmental support reflects a commitment to technological advancement and improving overall educational outcomes.
Future Insights of the Brazil Interactive Tables Market
Looking ahead to 2026-2032, the Brazil Interactive Tables Market is poised for substantial growth fueled by ongoing technological innovation and heightened demand for interactive solutions. As educational institutions and businesses alike continue to prioritize engagement and collaboration, the market will likely see the emergence of increasingly sophisticated products. This trajectory will be further supported by government initiatives and investments designed to enhance digital infrastructure, positioning Brazil as a key player in the global interactive tables landscape.
Brazil Interactive Tables Market Latest Developments (2025 - 2026)
Recent developments in the Brazil Interactive Tables Market indicate a shift towards more adaptive technologies that cater to both educational and corporate needs. Manufacturers are introducing features that facilitate remote collaboration, acknowledging the lasting impacts of the COVID-19 pandemic on workplace dynamics. Furthermore, there is a notable increase in partnerships between tech companies and educational institutions aimed at integrating interactive tables into curricula, thereby enhancing learning experiences across the country.
Brazil Interactive Tables Market - Key Attractiveness of the Report
- 10 Years of Market Numbers
- Historical Data Starting from 2022 to 2025
- Base Year: 2025
- Forecast Data until 2032
- Key Performance Indicators Impacting the Market
- Major Upcoming Developments and Projects
Key Highlights of the Report:
- Brazil Interactive Tables Market Outlook
- Market Size of Brazil Interactive Tables Market, 2025
- Forecast of Brazil Interactive Tables Market, 2032
- Historical Data and Forecast of Brazil Interactive Tables Revenues & Volume for the Period 2022-2032F
- Brazil Interactive Tables Market Trend Evolution
- Brazil Interactive Tables Market Drivers and Challenges
- Brazil Interactive Tables Price Trends
- Brazil Interactive Tables Porter's Five Forces
- Brazil Interactive Tables Industry Life Cycle
- Historical Data and Forecast of Brazil Interactive Tables Market Revenues & Volume By Technology for the Period 2022-2032F
- Historical Data and Forecast of Brazil Interactive Tables Market Revenues & Volume By LCD for the Period 2022-2032F
- Historical Data and Forecast of Brazil Interactive Tables Market Revenues & Volume By LED for the Period 2022-2032F
- Historical Data and Forecast of Brazil Interactive Tables Market Revenues & Volume By Capacitive for the Period 2022-2032F
- Historical Data and Forecast of Brazil Interactive Tables Market Revenues & Volume By Others for the Period 2022-2032F
- Historical Data and Forecast of Brazil Interactive Tables Market Revenues & Volume By Screen Size for the Period 2022-2032F
- Historical Data and Forecast of Brazil Interactive Tables Market Revenues & Volume By 32-65 Inch for the Period 2022-2032F
- Historical Data and Forecast of Brazil Interactive Tables Market Revenues & Volume By 65 Inch & Above for the Period 2022-2032F
- Historical Data and Forecast of Brazil Interactive Tables Market Revenues & Volume By Application for the Period 2022-2032F
- Historical Data and Forecast of Brazil Interactive Tables Market Revenues & Volume By Exhibition & Trade Shows for the Period 2022-2032F
- Historical Data and Forecast of Brazil Interactive Tables Market Revenues & Volume By Education for the Period 2022-2032F
- Historical Data and Forecast of Brazil Interactive Tables Market Revenues & Volume By Retail for the Period 2022-2032F
- Historical Data and Forecast of Brazil Interactive Tables Market Revenues & Volume By Control Room for the Period 2022-2032F
- Historical Data and Forecast of Brazil Interactive Tables Market Revenues & Volume By Hospitality for the Period 2022-2032F
- Historical Data and Forecast of Brazil Interactive Tables Market Revenues & Volume By Transportation for the Period 2022-2032F
- Historical Data and Forecast of Brazil Interactive Tables Market Revenues & Volume By Others for the Period 2022-2032F
- Brazil Interactive Tables Import Export Trade Statistics
- Market Opportunity Assessment By Technology
- Market Opportunity Assessment By Screen Size
- Market Opportunity Assessment By Application
- Brazil Interactive Tables Top Companies Market Share
- Brazil Interactive Tables Competitive Benchmarking By Technical and Operational Parameters
- Brazil Interactive Tables Company Profiles
- Brazil Interactive Tables Key Strategic Recommendations
Frequently Asked Questions About the Market Study (FAQs):
The surge in demand for collaborative and interactive learning environments in educational institutions and the corporate sector drives growth significantly. As technology evolves, the integration of advanced features enhances user engagement.
The market is estimated to be USD 235 Million in 2025 and is projected to grow to USD 280 Million by 2032, reflecting a CAGR of 2.5% from 2026 to 2032.
Current trends include a push for seamless integration with existing technologies, the incorporation of touchless features, and applications supporting hybrid learning models. These trends are reshaping how interactive tables are utilized in various settings.
Yes, the Brazilian government has implemented policies aimed at enhancing digital literacy and upgrading educational infrastructure, which includes encouraging the adoption of interactive tables in schools and corporate environments.
To remain competitive, manufacturers are focusing on continuous innovation and development of feature-rich products while also striving to keep them affordable to meet changing consumer preferences.
6Wresearch actively monitors the Brazil Interactive Tables Market and publishes its comprehensive annual report, highlighting emerging trends, growth drivers, revenue analysis, and forecast outlook. Our insights help businesses to make data-backed strategic decisions with ongoing market dynamics. Our analysts track relevent industries related to the Brazil Interactive Tables Market, allowing our clients with actionable intelligence and reliable forecasts tailored to emerging regional needs.
Yes, we provide customisation as per your requirements. To learn more, feel free to contact us on sales@6wresearch.com
1 Executive Summary |
2 Introduction |
2.1 Key Highlights of the Report |
2.2 Report Description |
2.3 Market Scope & Segmentation |
2.4 Research Methodology |
2.5 Assumptions |
3 Brazil Interactive Tables Market Overview |
3.1 Brazil Country Macro Economic Indicators |
3.2 Brazil Interactive Tables Market Revenues & Volume, 2022 & 2032F |
3.3 Brazil Interactive Tables Market - Industry Life Cycle |
3.4 Brazil Interactive Tables Market - Porter's Five Forces |
3.5 Brazil Interactive Tables Market Revenues & Volume Share, By Technology, 2022 & 2032F |
3.6 Brazil Interactive Tables Market Revenues & Volume Share, By Screen Size, 2022 & 2032F |
3.7 Brazil Interactive Tables Market Revenues & Volume Share, By Application, 2022 & 2032F |
4 Brazil Interactive Tables Market Dynamics |
4.1 Impact Analysis |
4.2 Market Drivers |
4.2.1 Increasing demand for interactive and engaging technologies in educational institutions |
4.2.2 Growing adoption of interactive tables in corporate offices for meetings and presentations |
4.2.3 Rising trend of interactive tables in the hospitality industry to enhance customer experience |
4.3 Market Restraints |
4.3.1 High initial investment costs associated with interactive tables |
4.3.2 Limited awareness and understanding of the benefits of interactive tables among potential users |
5 Brazil Interactive Tables Market Trends |
6 Brazil Interactive Tables Market, By Types |
6.1 Brazil Interactive Tables Market, By Technology |
6.1.1 Overview and Analysis |
6.1.2 Brazil Interactive Tables Market Revenues & Volume, By Technology, 2022-2032F |
6.1.3 Brazil Interactive Tables Market Revenues & Volume, By LCD, 2022-2032F |
6.1.4 Brazil Interactive Tables Market Revenues & Volume, By LED, 2022-2032F |
6.1.5 Brazil Interactive Tables Market Revenues & Volume, By Capacitive, 2022-2032F |
6.1.6 Brazil Interactive Tables Market Revenues & Volume, By Others, 2022-2032F |
6.2 Brazil Interactive Tables Market, By Screen Size |
6.2.1 Overview and Analysis |
6.2.2 Brazil Interactive Tables Market Revenues & Volume, By 32-65 Inch, 2022-2032F |
6.2.3 Brazil Interactive Tables Market Revenues & Volume, By 65 Inch & Above, 2022-2032F |
6.3 Brazil Interactive Tables Market, By Application |
6.3.1 Overview and Analysis |
6.3.2 Brazil Interactive Tables Market Revenues & Volume, By Exhibition & Trade Shows, 2022-2032F |
6.3.3 Brazil Interactive Tables Market Revenues & Volume, By Education, 2022-2032F |
6.3.4 Brazil Interactive Tables Market Revenues & Volume, By Retail, 2022-2032F |
6.3.5 Brazil Interactive Tables Market Revenues & Volume, By Control Room, 2022-2032F |
6.3.6 Brazil Interactive Tables Market Revenues & Volume, By Hospitality, 2022-2032F |
6.3.7 Brazil Interactive Tables Market Revenues & Volume, By Transportation, 2022-2032F |
7 Brazil Interactive Tables Market Import-Export Trade Statistics |
7.1 Brazil Interactive Tables Market Export to Major Countries |
7.2 Brazil Interactive Tables Market Imports from Major Countries |
8 Brazil Interactive Tables Market Key Performance Indicators |
8.1 Average time spent on interactive tables per session |
8.2 Number of software updates and new applications developed for interactive tables |
8.3 Rate of adoption of interactive tables in new industry sectors |
9 Brazil Interactive Tables Market - Opportunity Assessment |
9.1 Brazil Interactive Tables Market Opportunity Assessment, By Technology, 2022 & 2032F |
9.2 Brazil Interactive Tables Market Opportunity Assessment, By Screen Size, 2022 & 2032F |
9.3 Brazil Interactive Tables Market Opportunity Assessment, By Application, 2022 & 2032F |
10 Brazil Interactive Tables Market - Competitive Landscape |
10.1 Brazil Interactive Tables Market Revenue Share, By Companies, 2025 |
10.2 Brazil Interactive Tables Market Competitive Benchmarking, By Operating and Technical Parameters |
11 Company Profiles |
12 Recommendations |
13 Disclaimer |
Global Go To Market Strategy - 2030
Export potential enables firms to identify high-growth global markets with greater confidence by combining advanced trade intelligence with a structured quantitative methodology. The framework analyzes emerging demand trends and country-level import patterns while integrating macroeconomic and trade datasets such as GDP and population forecasts, bilateral import–export flows, tariff structures, elasticity differentials between developed and developing economies, geographic distance, and import demand projections. Using weighted trade values from 2020–2024 as the base period to project country-to-country export potential for 2030, these inputs are operationalized through calculated drivers such as gravity model parameters, tariff impact factors, and projected GDP per-capita growth. Through an analysis of hidden potentials, demand hotspots, and market conditions that are most favorable to success, this method enables firms to focus on target countries, maximize returns, and global expansion with data, backed by accuracy.
By factoring in the projected importer demand gap that is currently unmet and could be potential opportunity, it identifies the potential for the Exporter (Country) among 190 countries, against the general trade analysis, which identifies the biggest importer or exporter.
To discover high-growth global markets and optimize your business strategy:
Click Here
Pricing
- Single User License$ 1,995
- Department License$ 2,400
- Site License$ 3,120
- Global License$ 3,795

Leadership Perspectives from Industry Events
Search
Thought Leadership and Analyst Meet


Our Clients
6WResearch In News
- India Air Conditioner Market Set for Strong Rebound in 2026 After Weather-Led Correction and GST-Driven Recovery: 6Wresearch
- ADAS in India: How Automatic Emergency Braking, Blind Spot Detection & Driver Monitoring are Transforming Road Safety
- Doha a strategic location for EV manufacturing hub: IPA Qatar
- Demand for luxury TVs surging in the GCC, says Samsung
- Empowering Growth: The Thriving Journey of Bangladesh’s Cable Industry
- Demand for luxury TVs surging in the GCC, says Samsung
Latest Reports
- Nicaragua RPG Gaming Market (2026-2032)
- New Zealand RPG Gaming Market (2026-2032)
- Netherlands RPG Gaming Market (2026-2032)
- Nauru RPG Gaming Market (2026-2032)
- Namibia RPG Gaming Market (2026-2032)
- Mozambique RPG Gaming Market (2026-2032)
- Montenegro RPG Gaming Market (2026-2032)
- Mongolia RPG Gaming Market (2026-2032)
- Monaco RPG Gaming Market (2026-2032)
- Micronesia RPG Gaming Market (2026-2032)
Industry Events and Analyst Meet

EV India Expo 2026

HIMTEX 2026

India Refining Summit 2026

India EV Show 2026

EV tech India Expo 2026
Whitepaper
- Middle East & Africa Commercial Security Market Click here to view more.
- Middle East & Africa Fire Safety Systems & Equipment Market Click here to view more.
- GCC Drone Market Click here to view more.
- Middle East Lighting Fixture Market Click here to view more.
- GCC Physical & Perimeter Security Market Click here to view more.