Bulgaria Operating Table Market (2026-2032) | Revenue, Value, Companies, Strategy, Opportunities, Demand, Challenges, Pricing Analysis, Drivers, Segments, Competitive, Trends, Growth, Industry, Size, Strategic Insights, Competition, Analysis, Outlook, Segmentation, Share, Restraints, Forecast, Supply, Consumer Insights, Investment Trends
Market Forecast By Type (Electric, Hydraulic, Manual, Adjustable), By Material (Stainless Steel, Aluminum, Carbon Fiber, Plastic), By Adjustment Mechanism (Manual, Motorized, Pneumatic, Hydraulic), By Functionality (Surgical, Orthopedic, ICU, Examination), By Weight Capacity (300kg, 500kg, 700kg, 800kg) And Competitive Landscape
| Product Code: ETC10705866 | Publication Date: Apr 2025 | Updated Date: Apr 2026 | Product Type: Market Research Report | |
| Publisher: 6Wresearch | No. of Pages: 65 | No. of Figures: 34 | No. of Tables: 19 | |
Bulgaria Operating Table Market Size (2020-2030)
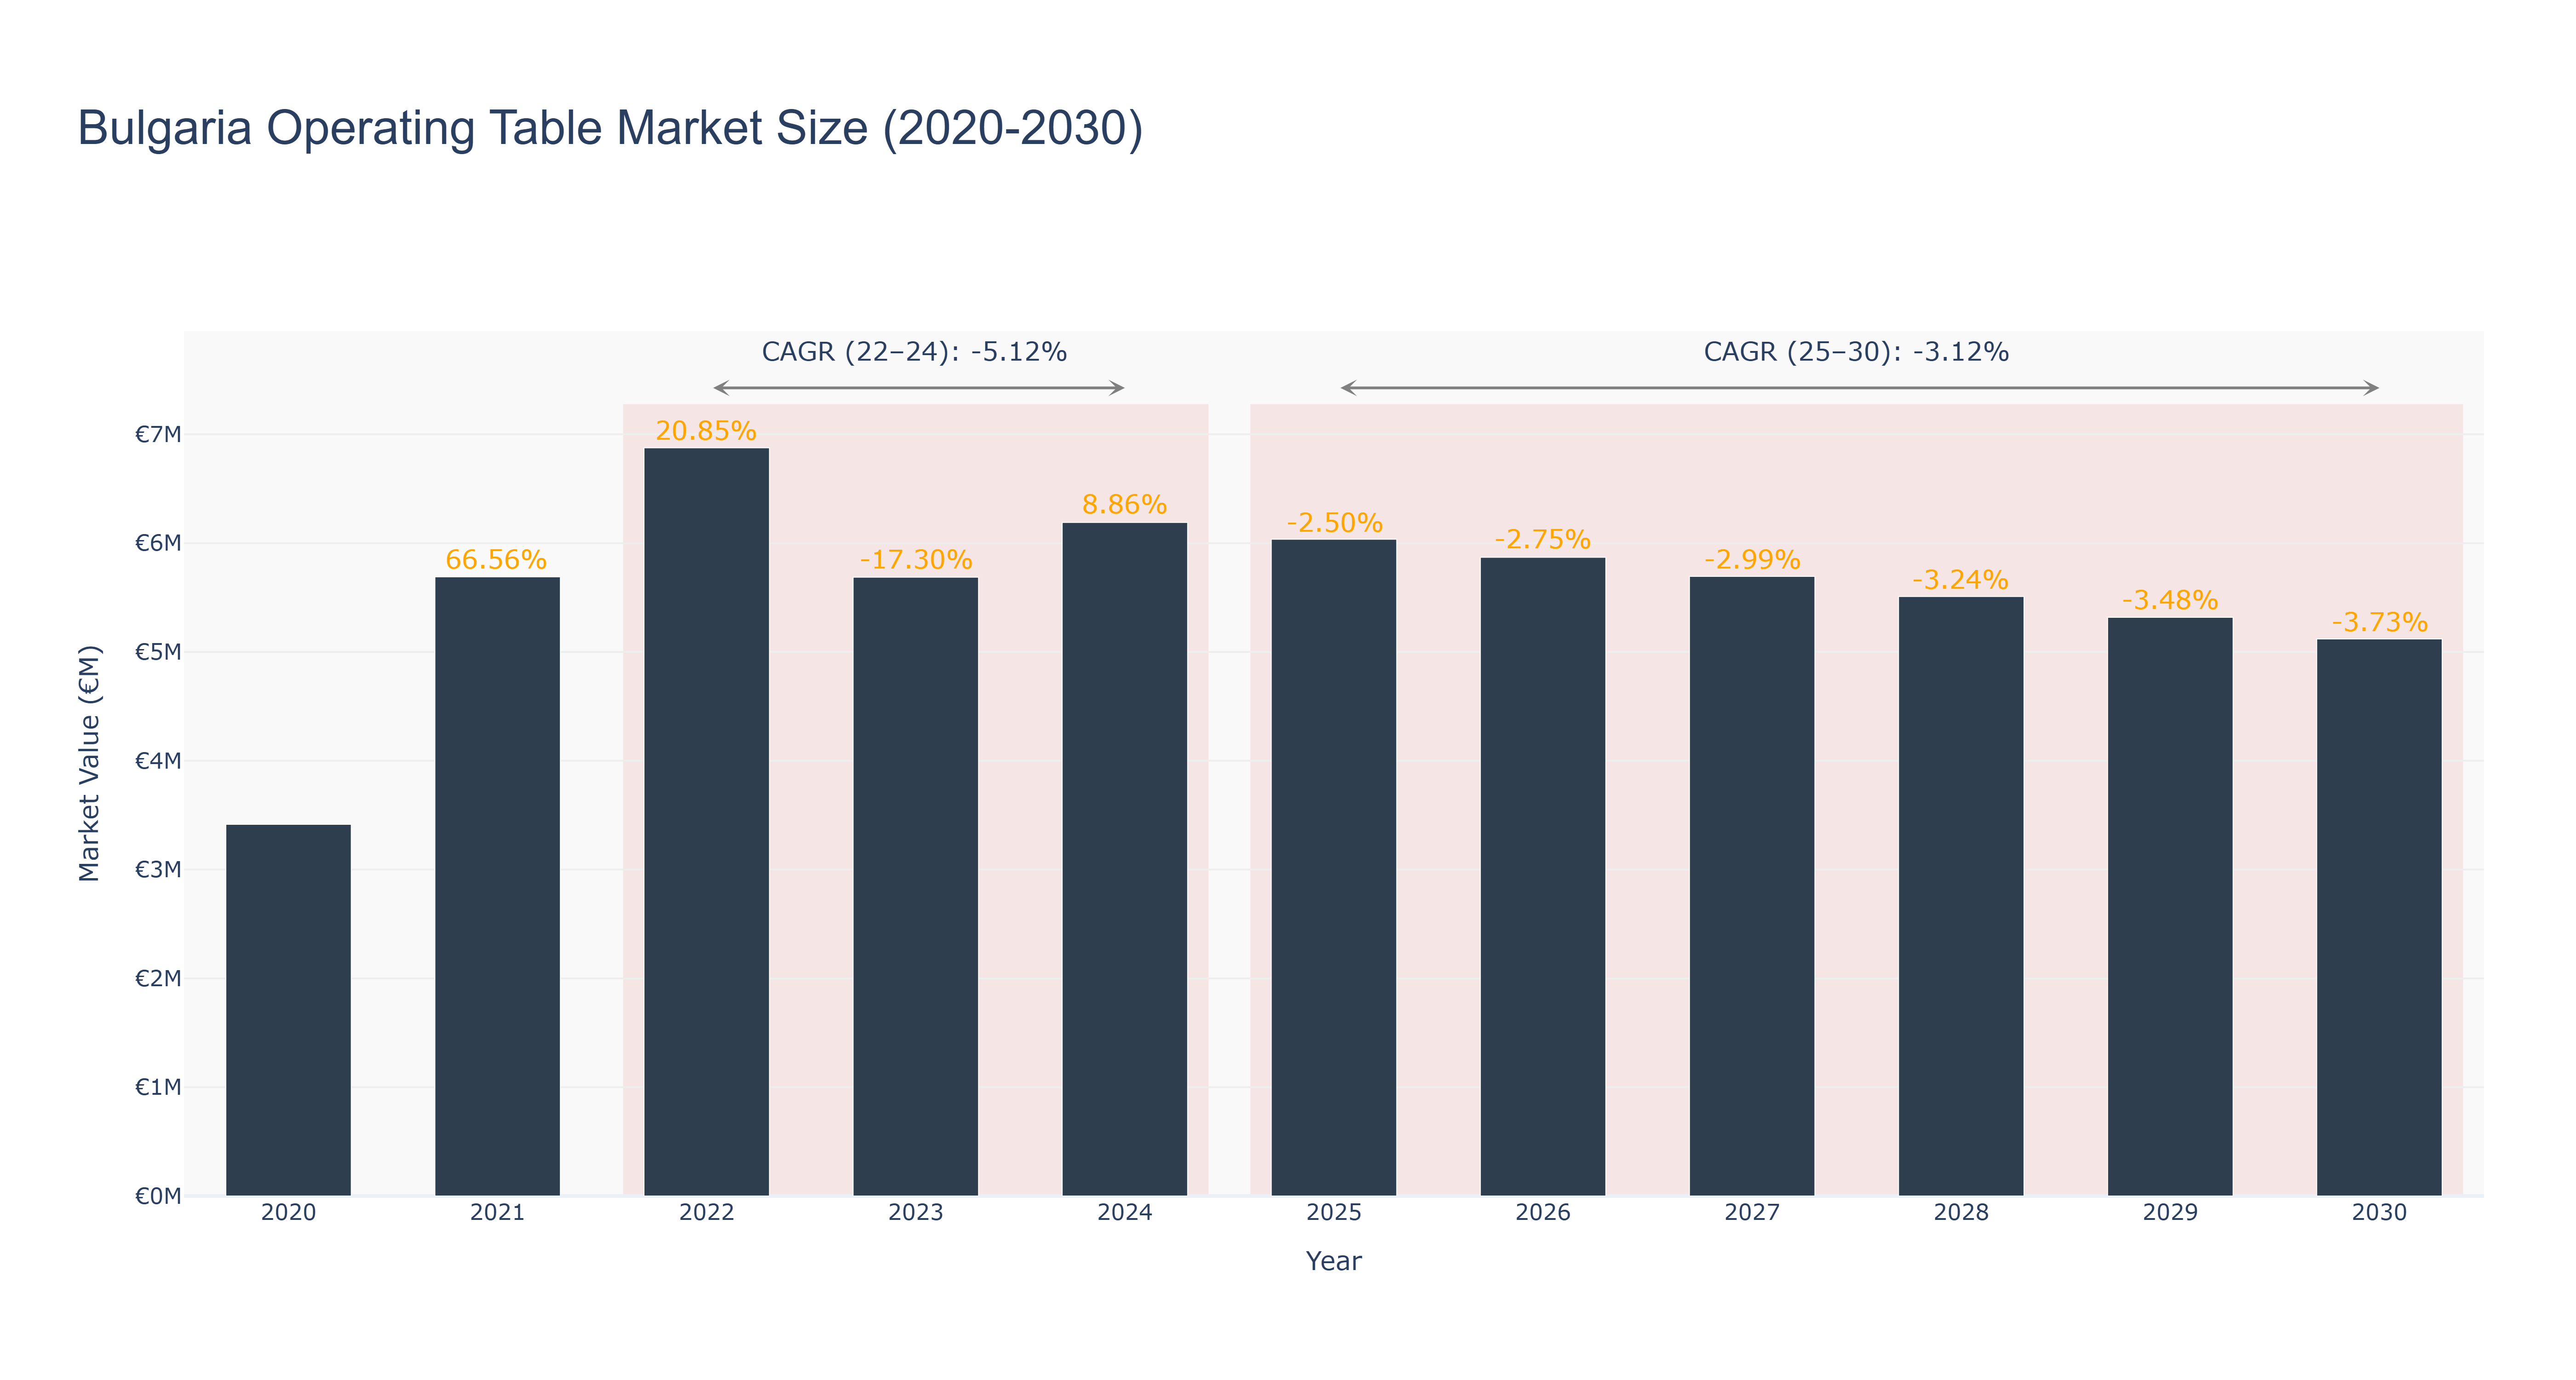
Bulgaria Operating Table Market has seen fluctuations in recent years. The peak market size was €6.88 million in 2022, with a subsequent drop to €5.69 million in 2023. Forecasted market sizes are €6.19 million in 2024 and a gradual decline to €5.12 million by 2030. The CAGR for the periods 2022-24 and 2025-30 are -5.12% and -3.12% respectively. The market experienced a decrease due to economic uncertainties and changing healthcare policies, impacting investment in healthcare infrastructure. Looking ahead, Bulgaria is set to implement a national healthcare modernization project aimed at upgrading medical facilities, which could potentially boost demand for operating tables in the country. It is crucial for market players to adapt to evolving industry regulations and technological advancements to stay competitive in this challenging landscape.
Bulgaria Operating Table Market: Production & Trade Performance (2019-2025)
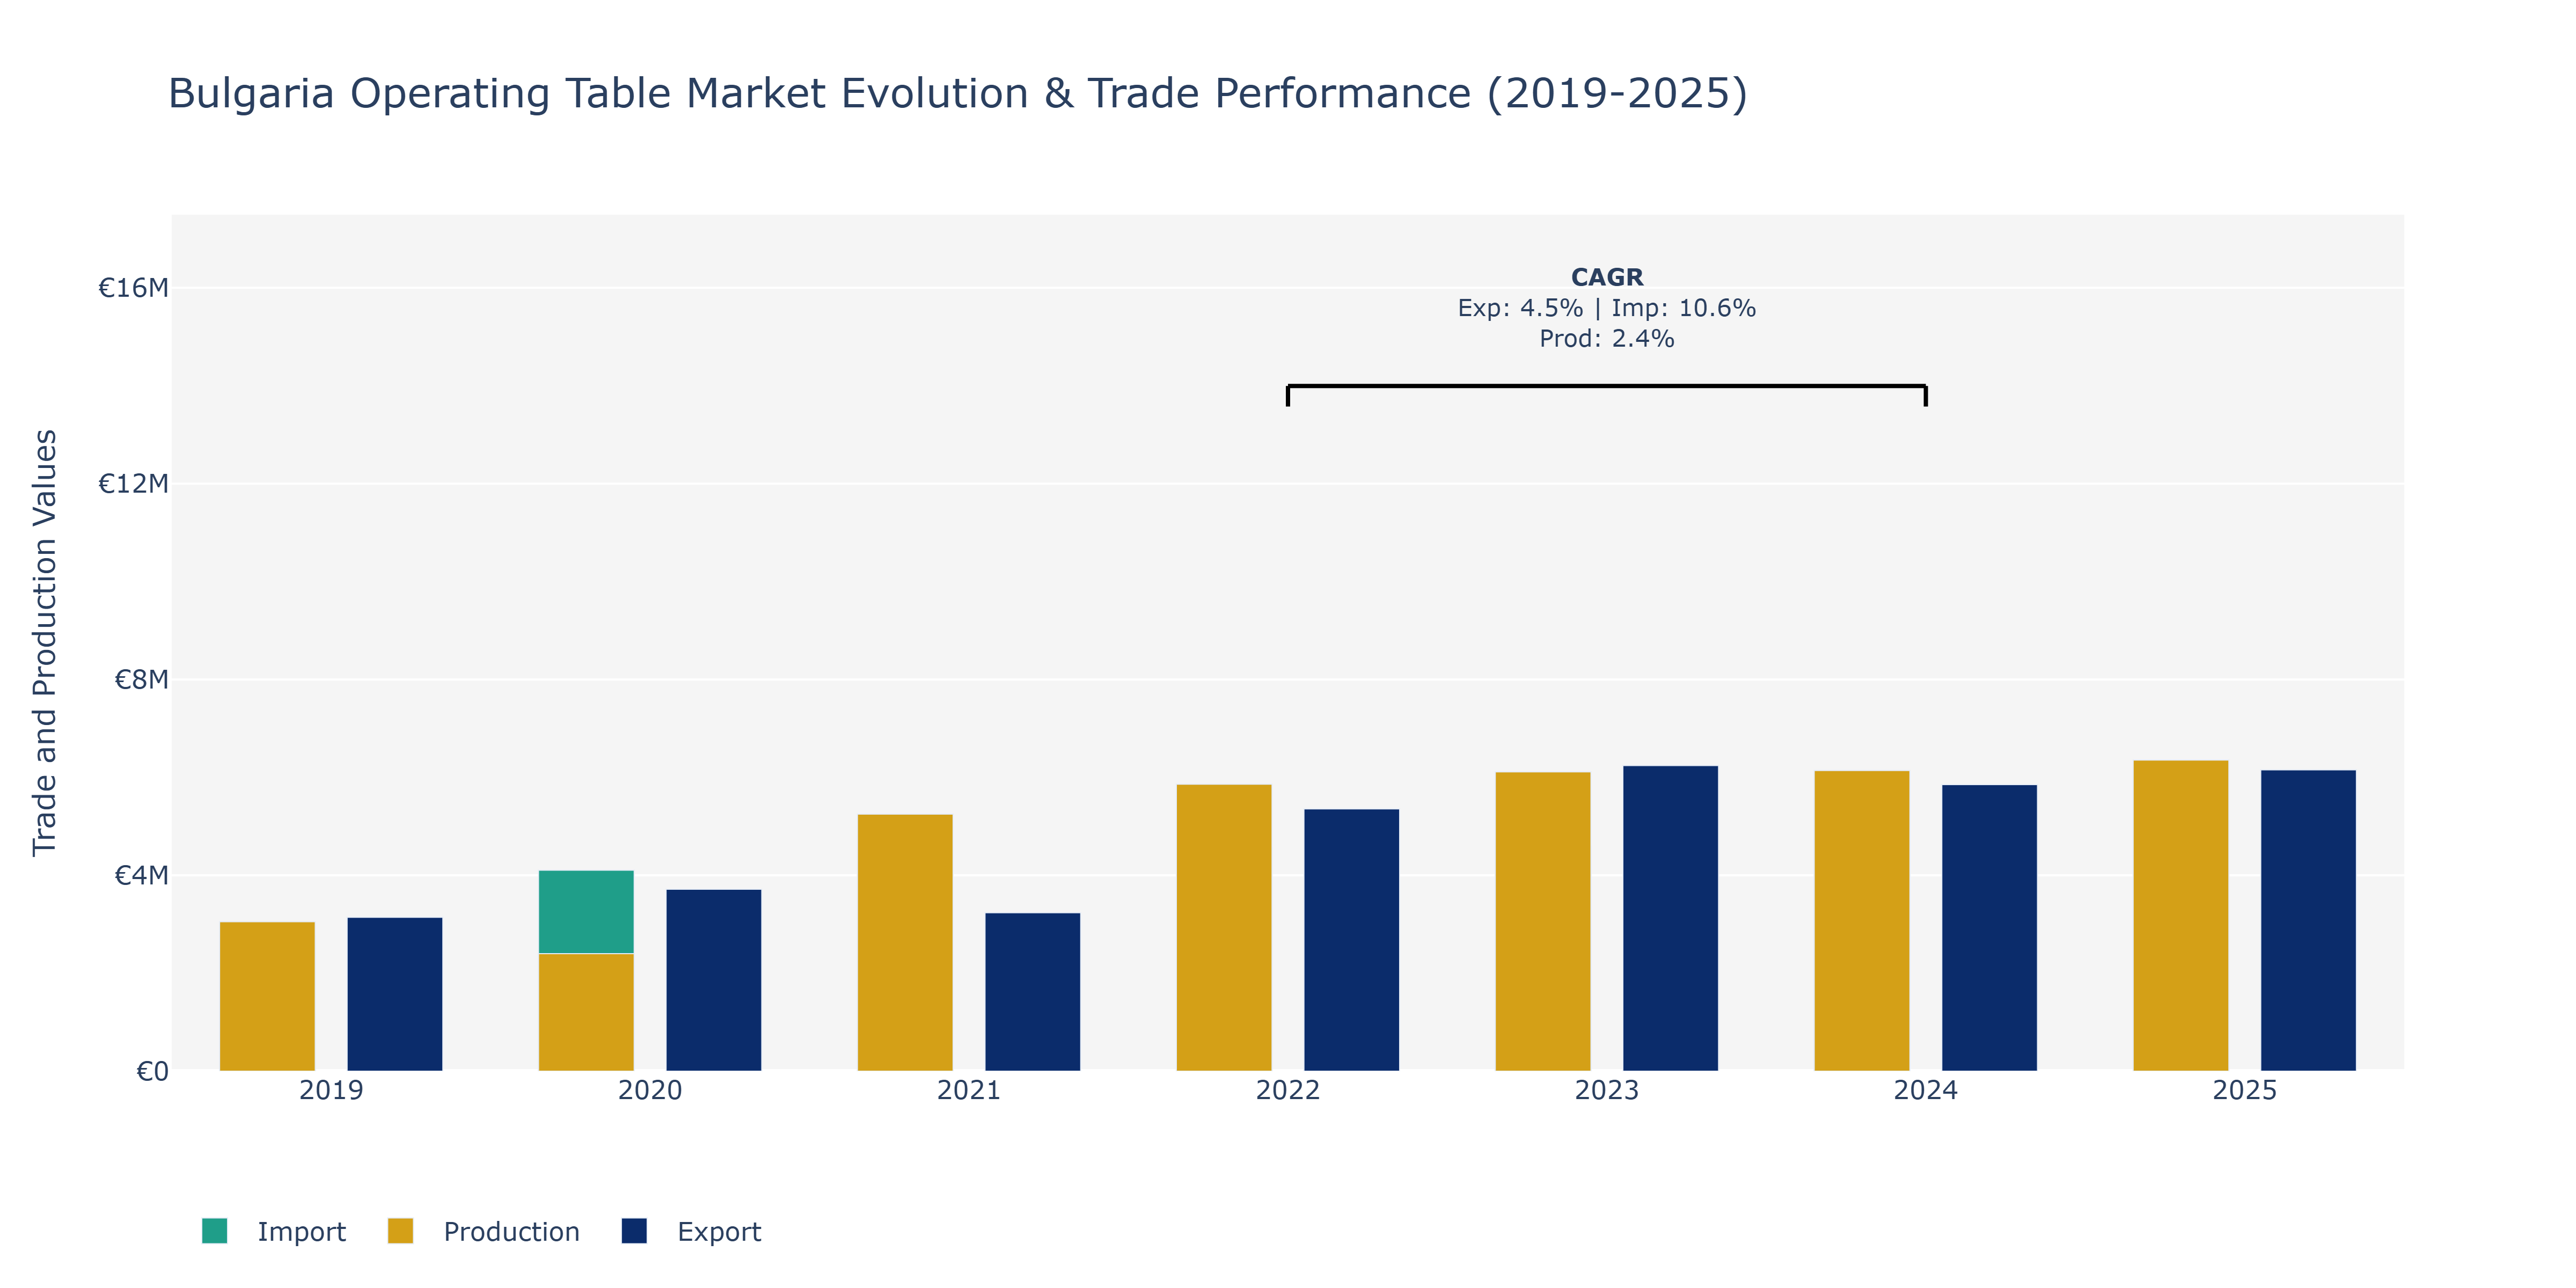
In the Bulgaria Operating Table Market, from 2019 to 2025, exports showcased a fluctuating pattern with a peak in 2023 at €6.24 million, followed by a slight decline in 2024 to €5.85 million, and a modest recovery in 2025 to €6.16 million. Imports steadily increased from €2.76 million in 2019 to €6.14 million in 2025, reflecting a growing demand for imported operating tables. Production experienced a notable decline in 2020 to €2.40 million before steadily rising to €6.35 million in 2025. The surge in production can be attributed to advancements in technology, leading to increased efficiency and quality of locally manufactured operating tables. The rise in imports could indicate a preference for specialized or technologically advanced tables not currently produced domestically, potentially driving manufacturers to enhance their offerings to remain competitive in the market.
Key Highlights of the Report:
- Bulgaria Operating Table Market Outlook
- Market Size of Bulgaria Operating Table Market, 2025
- Forecast of Bulgaria Operating Table Market, 2032
- Historical Data and Forecast of Bulgaria Operating Table Revenues & Volume for the Period 2022 - 2032F
- Bulgaria Operating Table Market Trend Evolution
- Bulgaria Operating Table Market Drivers and Challenges
- Bulgaria Operating Table Price Trends
- Bulgaria Operating Table Porter's Five Forces
- Bulgaria Operating Table Industry Life Cycle
- Historical Data and Forecast of Bulgaria Operating Table Market Revenues & Volume By Type for the Period 2022 - 2032F
- Historical Data and Forecast of Bulgaria Operating Table Market Revenues & Volume By Electric for the Period 2022 - 2032F
- Historical Data and Forecast of Bulgaria Operating Table Market Revenues & Volume By Hydraulic for the Period 2022 - 2032F
- Historical Data and Forecast of Bulgaria Operating Table Market Revenues & Volume By Manual for the Period 2022 - 2032F
- Historical Data and Forecast of Bulgaria Operating Table Market Revenues & Volume By Adjustable for the Period 2022 - 2032F
- Historical Data and Forecast of Bulgaria Operating Table Market Revenues & Volume By Material for the Period 2022 - 2032F
- Historical Data and Forecast of Bulgaria Operating Table Market Revenues & Volume By Stainless Steel for the Period 2022 - 2032F
- Historical Data and Forecast of Bulgaria Operating Table Market Revenues & Volume By Aluminum for the Period 2022 - 2032F
- Historical Data and Forecast of Bulgaria Operating Table Market Revenues & Volume By Carbon Fiber for the Period 2022 - 2032F
- Historical Data and Forecast of Bulgaria Operating Table Market Revenues & Volume By Plastic for the Period 2022 - 2032F
- Historical Data and Forecast of Bulgaria Operating Table Market Revenues & Volume By Adjustment Mechanism for the Period 2022 - 2032F
- Historical Data and Forecast of Bulgaria Operating Table Market Revenues & Volume By Manual for the Period 2022 - 2032F
- Historical Data and Forecast of Bulgaria Operating Table Market Revenues & Volume By Motorized for the Period 2022 - 2032F
- Historical Data and Forecast of Bulgaria Operating Table Market Revenues & Volume By Pneumatic for the Period 2022 - 2032F
- Historical Data and Forecast of Bulgaria Operating Table Market Revenues & Volume By Hydraulic for the Period 2022 - 2032F
- Historical Data and Forecast of Bulgaria Operating Table Market Revenues & Volume By Functionality for the Period 2022 - 2032F
- Historical Data and Forecast of Bulgaria Operating Table Market Revenues & Volume By Surgical for the Period 2022 - 2032F
- Historical Data and Forecast of Bulgaria Operating Table Market Revenues & Volume By Orthopedic for the Period 2022 - 2032F
- Historical Data and Forecast of Bulgaria Operating Table Market Revenues & Volume By ICU for the Period 2022 - 2032F
- Historical Data and Forecast of Bulgaria Operating Table Market Revenues & Volume By Examination for the Period 2022 - 2032F
- Historical Data and Forecast of Bulgaria Operating Table Market Revenues & Volume By Weight Capacity for the Period 2022 - 2032F
- Historical Data and Forecast of Bulgaria Operating Table Market Revenues & Volume By 300kg for the Period 2022 - 2032F
- Historical Data and Forecast of Bulgaria Operating Table Market Revenues & Volume By 500kg for the Period 2022 - 2032F
- Historical Data and Forecast of Bulgaria Operating Table Market Revenues & Volume By 700kg for the Period 2022 - 2032F
- Historical Data and Forecast of Bulgaria Operating Table Market Revenues & Volume By 800kg for the Period 2022 - 2032F
- Bulgaria Operating Table Import Export Trade Statistics
- Market Opportunity Assessment By Type
- Market Opportunity Assessment By Material
- Market Opportunity Assessment By Adjustment Mechanism
- Market Opportunity Assessment By Functionality
- Market Opportunity Assessment By Weight Capacity
- Bulgaria Operating Table Top Companies Market Share
- Bulgaria Operating Table Competitive Benchmarking By Technical and Operational Parameters
- Bulgaria Operating Table Company Profiles
- Bulgaria Operating Table Key Strategic Recommendations
Frequently Asked Questions About the Market Study (FAQs):
6Wresearch actively monitors the Bulgaria Operating Table Market and publishes its comprehensive annual report, highlighting emerging trends, growth drivers, revenue analysis, and forecast outlook. Our insights help businesses to make data-backed strategic decisions with ongoing market dynamics. Our analysts track relevent industries related to the Bulgaria Operating Table Market, allowing our clients with actionable intelligence and reliable forecasts tailored to emerging regional needs.
Yes, we provide customisation as per your requirements. To learn more, feel free to contact us on sales@6wresearch.com
1 Executive Summary |
2 Introduction |
2.1 Key Highlights of the Report |
2.2 Report Description |
2.3 Market Scope & Segmentation |
2.4 Research Methodology |
2.5 Assumptions |
3 Bulgaria Operating Table Market Overview |
3.1 Bulgaria Country Macro Economic Indicators |
3.2 Bulgaria Operating Table Market Revenues & Volume, 2022 & 2032F |
3.3 Bulgaria Operating Table Market - Industry Life Cycle |
3.4 Bulgaria Operating Table Market - Porter's Five Forces |
3.5 Bulgaria Operating Table Market Revenues & Volume Share, By Type, 2022 & 2032F |
3.6 Bulgaria Operating Table Market Revenues & Volume Share, By Material, 2022 & 2032F |
3.7 Bulgaria Operating Table Market Revenues & Volume Share, By Adjustment Mechanism, 2022 & 2032F |
3.8 Bulgaria Operating Table Market Revenues & Volume Share, By Functionality, 2022 & 2032F |
3.9 Bulgaria Operating Table Market Revenues & Volume Share, By Weight Capacity, 2022 & 2032F |
4 Bulgaria Operating Table Market Dynamics |
4.1 Impact Analysis |
4.2 Market Drivers |
4.2.1 Increasing demand for advanced healthcare facilities in Bulgaria |
4.2.2 Technological advancements in operating table designs and functionalities |
4.2.3 Growing investments in the healthcare sector in Bulgaria |
4.3 Market Restraints |
4.3.1 High initial costs associated with purchasing and installing advanced operating tables |
4.3.2 Limited budget allocations for healthcare infrastructure in Bulgaria |
4.3.3 Stringent regulations and standards for medical equipment in Bulgaria |
5 Bulgaria Operating Table Market Trends |
6 Bulgaria Operating Table Market, By Types |
6.1 Bulgaria Operating Table Market, By Type |
6.1.1 Overview and Analysis |
6.1.2 Bulgaria Operating Table Market Revenues & Volume, By Type, 2022 - 2032F |
6.1.3 Bulgaria Operating Table Market Revenues & Volume, By Electric, 2022 - 2032F |
6.1.4 Bulgaria Operating Table Market Revenues & Volume, By Hydraulic, 2022 - 2032F |
6.1.5 Bulgaria Operating Table Market Revenues & Volume, By Manual, 2022 - 2032F |
6.1.6 Bulgaria Operating Table Market Revenues & Volume, By Adjustable, 2022 - 2032F |
6.2 Bulgaria Operating Table Market, By Material |
6.2.1 Overview and Analysis |
6.2.2 Bulgaria Operating Table Market Revenues & Volume, By Stainless Steel, 2022 - 2032F |
6.2.3 Bulgaria Operating Table Market Revenues & Volume, By Aluminum, 2022 - 2032F |
6.2.4 Bulgaria Operating Table Market Revenues & Volume, By Carbon Fiber, 2022 - 2032F |
6.2.5 Bulgaria Operating Table Market Revenues & Volume, By Plastic, 2022 - 2032F |
6.3 Bulgaria Operating Table Market, By Adjustment Mechanism |
6.3.1 Overview and Analysis |
6.3.2 Bulgaria Operating Table Market Revenues & Volume, By Manual, 2022 - 2032F |
6.3.3 Bulgaria Operating Table Market Revenues & Volume, By Motorized, 2022 - 2032F |
6.3.4 Bulgaria Operating Table Market Revenues & Volume, By Pneumatic, 2022 - 2032F |
6.3.5 Bulgaria Operating Table Market Revenues & Volume, By Hydraulic, 2022 - 2032F |
6.4 Bulgaria Operating Table Market, By Functionality |
6.4.1 Overview and Analysis |
6.4.2 Bulgaria Operating Table Market Revenues & Volume, By Surgical, 2022 - 2032F |
6.4.3 Bulgaria Operating Table Market Revenues & Volume, By Orthopedic, 2022 - 2032F |
6.4.4 Bulgaria Operating Table Market Revenues & Volume, By ICU, 2022 - 2032F |
6.4.5 Bulgaria Operating Table Market Revenues & Volume, By Examination, 2022 - 2032F |
6.5 Bulgaria Operating Table Market, By Weight Capacity |
6.5.1 Overview and Analysis |
6.5.2 Bulgaria Operating Table Market Revenues & Volume, By 300kg, 2022 - 2032F |
6.5.3 Bulgaria Operating Table Market Revenues & Volume, By 500kg, 2022 - 2032F |
6.5.4 Bulgaria Operating Table Market Revenues & Volume, By 700kg, 2022 - 2032F |
6.5.5 Bulgaria Operating Table Market Revenues & Volume, By 800kg, 2022 - 2032F |
7 Bulgaria Operating Table Market Import-Export Trade Statistics |
7.1 Bulgaria Operating Table Market Export to Major Countries |
7.2 Bulgaria Operating Table Market Imports from Major Countries |
8 Bulgaria Operating Table Market Key Performance Indicators |
8.1 Average utilization rate of operating tables in medical facilities |
8.2 Number of surgical procedures performed per operating table per year |
8.3 Adoption rate of advanced operating table features by healthcare facilities |
9 Bulgaria Operating Table Market - Opportunity Assessment |
9.1 Bulgaria Operating Table Market Opportunity Assessment, By Type, 2022 & 2032F |
9.2 Bulgaria Operating Table Market Opportunity Assessment, By Material, 2022 & 2032F |
9.3 Bulgaria Operating Table Market Opportunity Assessment, By Adjustment Mechanism, 2022 & 2032F |
9.4 Bulgaria Operating Table Market Opportunity Assessment, By Functionality, 2022 & 2032F |
9.5 Bulgaria Operating Table Market Opportunity Assessment, By Weight Capacity, 2022 & 2032F |
10 Bulgaria Operating Table Market - Competitive Landscape |
10.1 Bulgaria Operating Table Market Revenue Share, By Companies, 2025 |
10.2 Bulgaria Operating Table Market Competitive Benchmarking, By Operating and Technical Parameters |
11 Company Profiles |
12 Recommendations |
13 Disclaimer |
Global Go To Market Strategy - 2030
Export potential enables firms to identify high-growth global markets with greater confidence by combining advanced trade intelligence with a structured quantitative methodology. The framework analyzes emerging demand trends and country-level import patterns while integrating macroeconomic and trade datasets such as GDP and population forecasts, bilateral import–export flows, tariff structures, elasticity differentials between developed and developing economies, geographic distance, and import demand projections. Using weighted trade values from 2020–2024 as the base period to project country-to-country export potential for 2030, these inputs are operationalized through calculated drivers such as gravity model parameters, tariff impact factors, and projected GDP per-capita growth. Through an analysis of hidden potentials, demand hotspots, and market conditions that are most favorable to success, this method enables firms to focus on target countries, maximize returns, and global expansion with data, backed by accuracy.
By factoring in the projected importer demand gap that is currently unmet and could be potential opportunity, it identifies the potential for the Exporter (Country) among 190 countries, against the general trade analysis, which identifies the biggest importer or exporter.
To discover high-growth global markets and optimize your business strategy:
Click Here
Pricing
- Single User License$ 1,995
- Department License$ 2,400
- Site License$ 3,120
- Global License$ 3,795

Leadership Perspectives from Industry Events
Search
Thought Leadership and Analyst Meet


Our Clients
6WResearch In News
- Doha a strategic location for EV manufacturing hub: IPA Qatar
- Demand for luxury TVs surging in the GCC, says Samsung
- Empowering Growth: The Thriving Journey of Bangladesh’s Cable Industry
- Demand for luxury TVs surging in the GCC, says Samsung
- Video call with a traditional healer? Once unthinkable, it’s now common in South Africa
- Intelligent Buildings To Smooth GCC’s Path To Net Zero
Latest Reports
- Cape Verde Portable Hand-Thrown Extinguisher Market (2026-2032)
- Canada Portable Hand-Thrown Extinguisher Market (2026-2032)
- Cameroon Portable Hand-Thrown Extinguisher Market (2026-2032)
- Burundi Portable Hand-Thrown Extinguisher Market (2026-2032)
- Burkina Faso Portable Hand-Thrown Extinguisher Market (2026-2032)
- Bulgaria Portable Hand-Thrown Extinguisher Market (2026-2032)
- Brunei Portable Hand-Thrown Extinguisher Market (2026-2032)
- Botswana Portable Hand-Thrown Extinguisher Market (2026-2032)
- Bosnia and Herzegovina Portable Hand-Thrown Extinguisher Market (2026-2032)
- Bolivia Portable Hand-Thrown Extinguisher Market (2026-2032)
Industry Events and Analyst Meet

HIMTEX 2026

India Refining Summit 2026

India EV Show 2026

EV tech India Expo 2026

Auto Tech Asia 2026
Whitepaper
- Middle East & Africa Commercial Security Market Click here to view more.
- Middle East & Africa Fire Safety Systems & Equipment Market Click here to view more.
- GCC Drone Market Click here to view more.
- Middle East Lighting Fixture Market Click here to view more.
- GCC Physical & Perimeter Security Market Click here to view more.