Cape Verde OEM Insulation Market (2025-2031) | Industry, Companies, Growth, Analysis, Share, Revenue, Outlook, Size, Trends, Value, Segmentation & Forecast
Market Forecast By Material Type (Mineral Wool, Polyurethane Foam, Flexible Elastomeric Foam, Other Insulations), By End Use (Building & Construction, Industrial, Transportation, Consumer) And Competitive Landscape
| Product Code: ETC5742405 | Publication Date: Nov 2023 | Updated Date: Nov 2025 | Product Type: Market Research Report | |
| Publisher: 6Wresearch | Author: Sumit Sagar | No. of Pages: 60 | No. of Figures: 30 | No. of Tables: 5 |
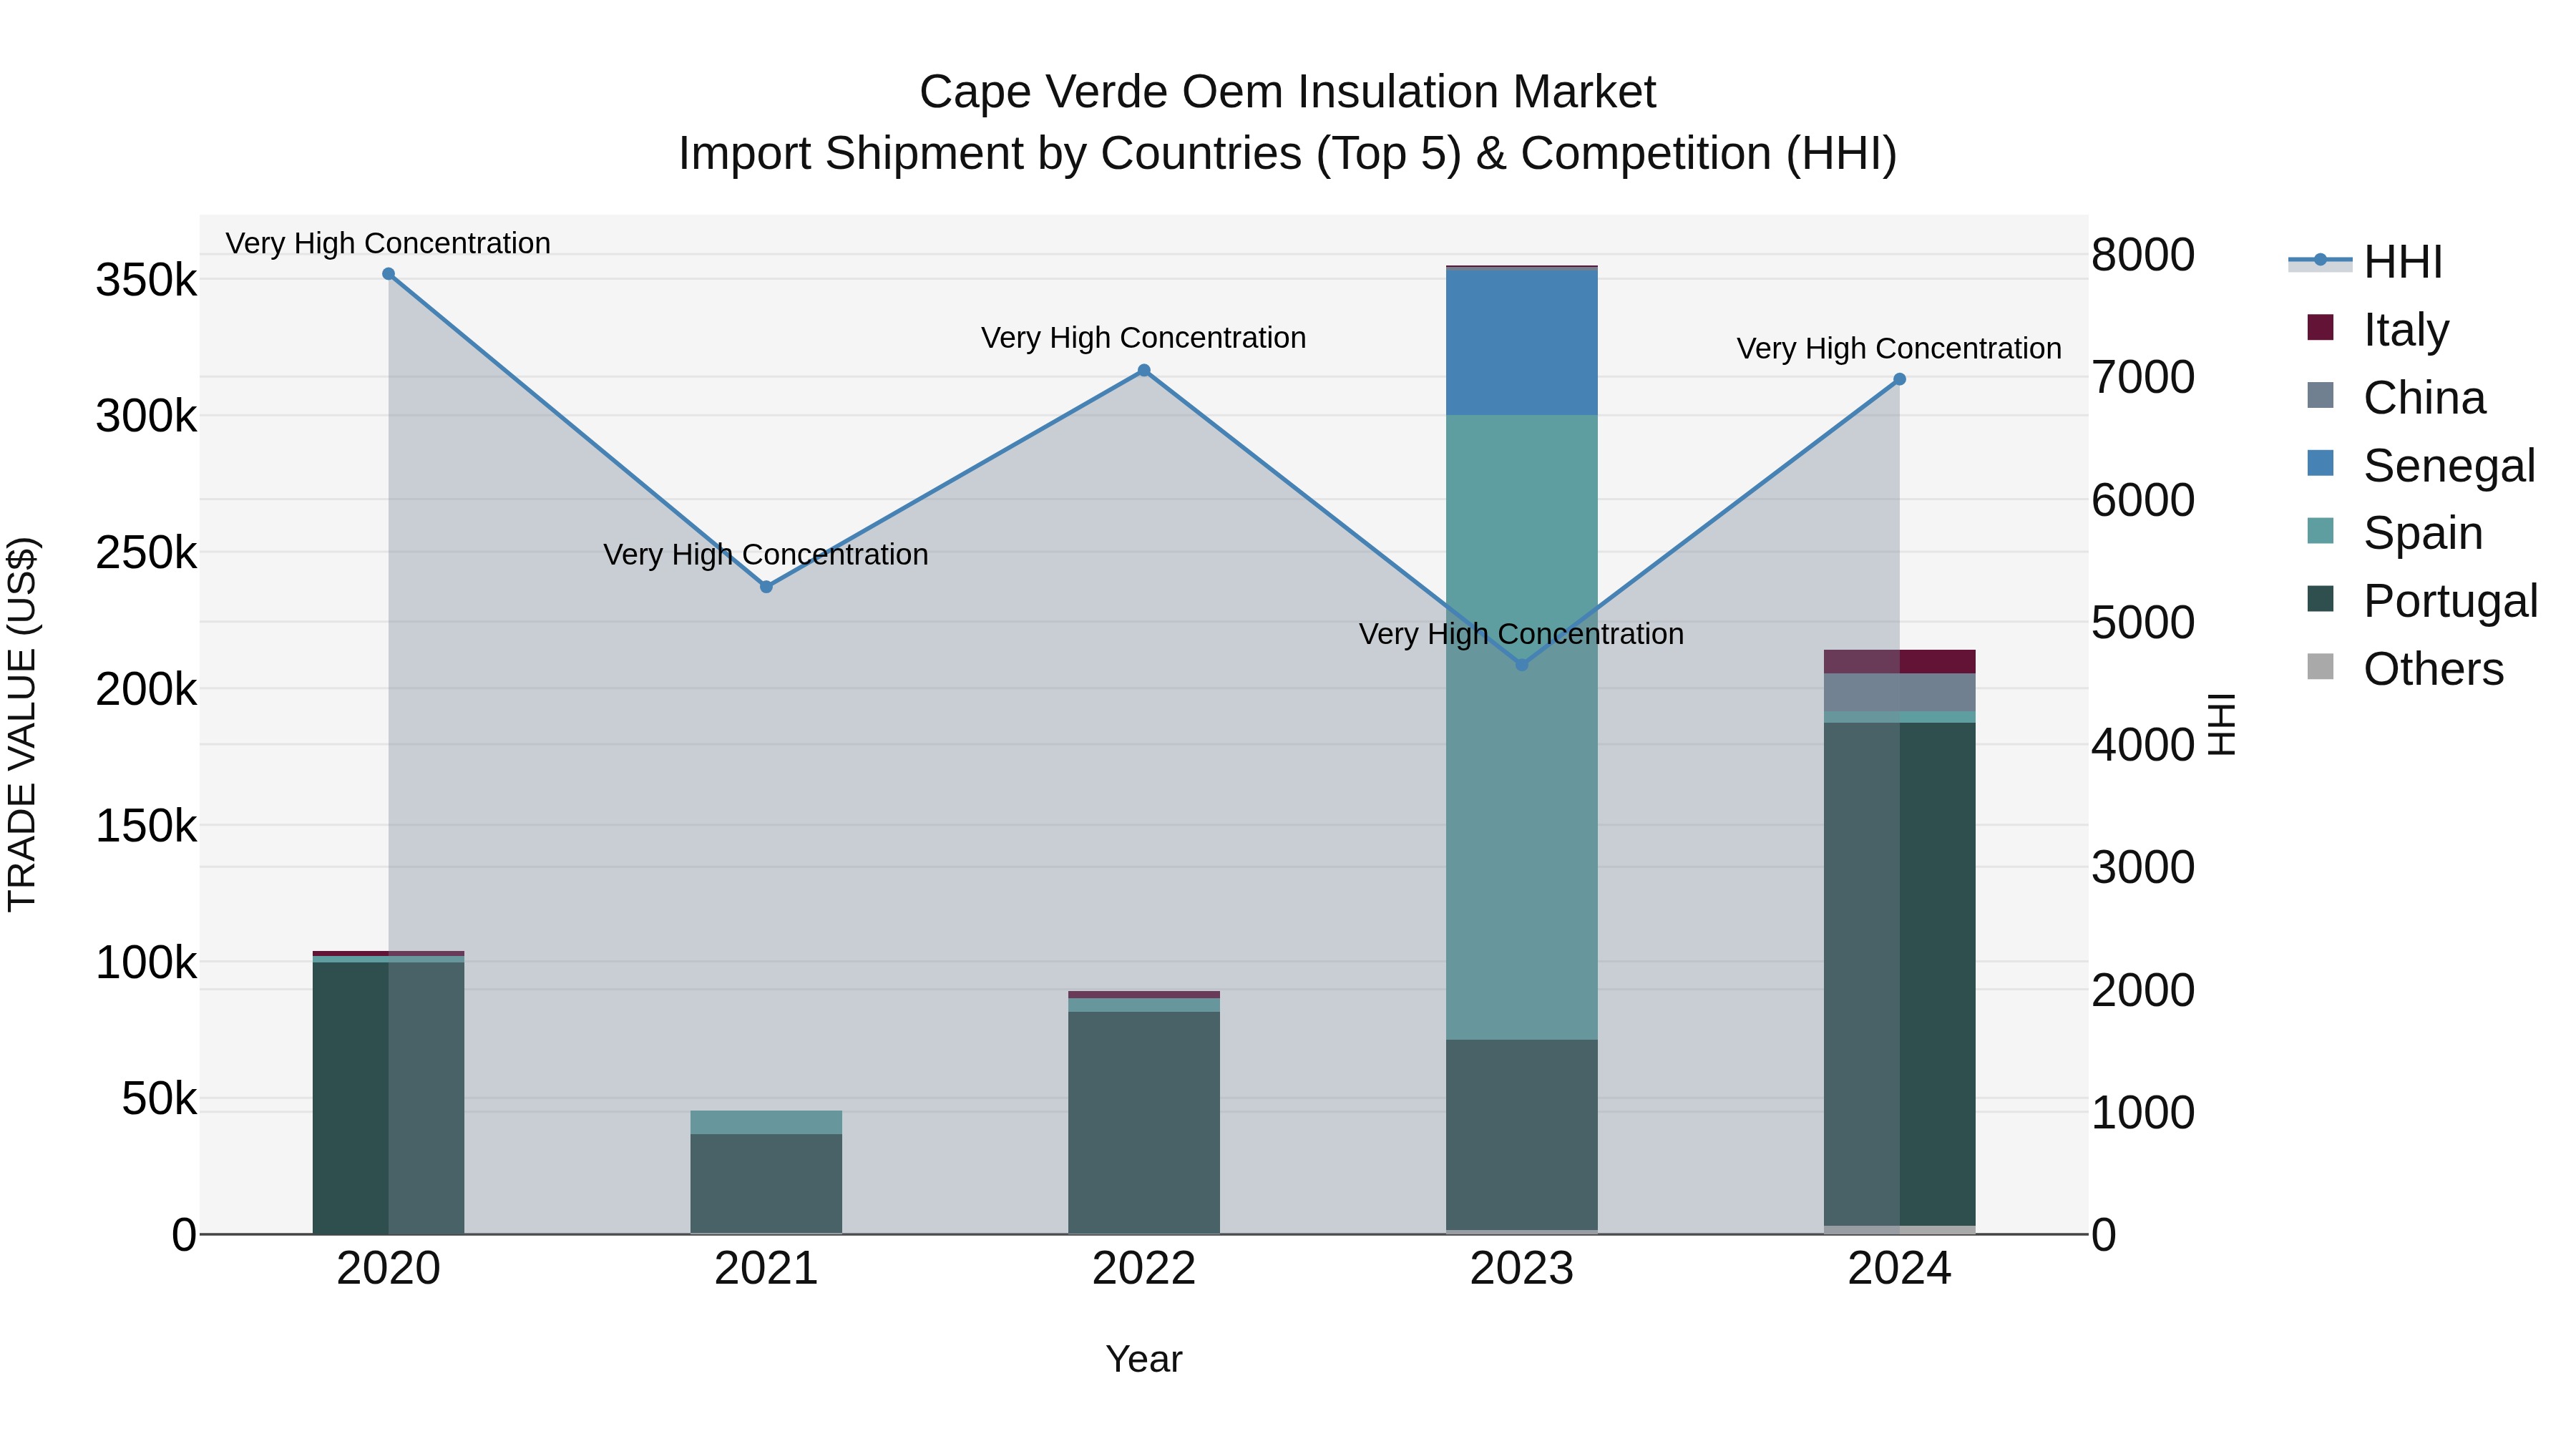
Cape Verde Oem Insulation Market: Top 5 Importing Countries and Market Competition (HHI) Analysis
Cape Verde continues to rely on key suppliers such as Portugal, China, Italy, Spain, and Turkey for OEM insulation imports in 2024. Despite high concentration with a high Herfindahl-Hirschman Index (HHI), the market shows robust growth with a notable CAGR of 19.87% from 2020 to 2024. However, there was a significant decline in growth rate from 2023 to 2024 at -39.63%, indicating a potential shift in market dynamics or external factors impacting the industry. Monitoring these trends will be crucial for stakeholders in the insulation sector.
Cape Verde OEM Insulation Market Overview
This market focuses on insulation materials supplied to original equipment manufacturers (OEMs) for use in products such as appliances, vehicles, and industrial machinery. The market is driven by the need for energy efficiency and thermal management.
Drivers of the market
The OEM insulation market in Cape Verde is influenced by the growing construction and manufacturing sectors. As infrastructure projects and industrial activities increase, the need for effective insulation solutions to enhance energy efficiency and meet regulatory standards drives market expansion. The rise in OEM (Original Equipment Manufacturer) activities in various industries also boosts demand for high-quality insulation materials.
Challenges of the market
The OEM insulation market in Cape Verde is hindered by high costs associated with importing insulation materials and a lack of local manufacturing facilities. The market also struggles with a shortage of technical expertise for installing and maintaining insulation systems. Additionally, there is limited awareness among businesses about the importance of high-quality insulation for energy efficiency and safety. The lack of local standards and regulations for insulation further complicates market development.
Government Policy of the market
To support the OEM insulation market, Cape Verdes government may implement policies that promote the use of high-quality insulation materials in original equipment manufacturing. This could include providing incentives for local production, establishing regulations for insulation performance and safety, and supporting research and development in advanced insulation technologies.
Key Highlights of the Report:
- Cape Verde OEM Insulation Market Outlook
- Market Size of Cape Verde OEM Insulation Market, 2024
- Forecast of Cape Verde OEM Insulation Market, 2031
- Historical Data and Forecast of Cape Verde OEM Insulation Revenues & Volume for the Period 2021-2031
- Cape Verde OEM Insulation Market Trend Evolution
- Cape Verde OEM Insulation Market Drivers and Challenges
- Cape Verde OEM Insulation Price Trends
- Cape Verde OEM Insulation Porter`s Five Forces
- Cape Verde OEM Insulation Industry Life Cycle
- Historical Data and Forecast of Cape Verde OEM Insulation Market Revenues & Volume By Material Type for the Period 2021-2031
- Historical Data and Forecast of Cape Verde OEM Insulation Market Revenues & Volume By Mineral Wool for the Period 2021-2031
- Historical Data and Forecast of Cape Verde OEM Insulation Market Revenues & Volume By Polyurethane Foam for the Period 2021-2031
- Historical Data and Forecast of Cape Verde OEM Insulation Market Revenues & Volume By Flexible Elastomeric Foam for the Period 2021-2031
- Historical Data and Forecast of Cape Verde OEM Insulation Market Revenues & Volume By Other Insulations for the Period 2021-2031
- Historical Data and Forecast of Cape Verde OEM Insulation Market Revenues & Volume By End Use for the Period 2021-2031
- Historical Data and Forecast of Cape Verde OEM Insulation Market Revenues & Volume By Building & Construction for the Period 2021-2031
- Historical Data and Forecast of Cape Verde OEM Insulation Market Revenues & Volume By Industrial for the Period 2021-2031
- Historical Data and Forecast of Cape Verde OEM Insulation Market Revenues & Volume By Transportation for the Period 2021-2031
- Historical Data and Forecast of Cape Verde OEM Insulation Market Revenues & Volume By Consumer for the Period 2021-2031
- Cape Verde OEM Insulation Import Export Trade Statistics
- Market Opportunity Assessment By Material Type
- Market Opportunity Assessment By End Use
- Cape Verde OEM Insulation Top Companies Market Share
- Cape Verde OEM Insulation Competitive Benchmarking By Technical and Operational Parameters
- Cape Verde OEM Insulation Company Profiles
- Cape Verde OEM Insulation Key Strategic Recommendations
Frequently Asked Questions About the Market Study (FAQs):
6Wresearch actively monitors the Cape Verde OEM Insulation Market and publishes its comprehensive annual report, highlighting emerging trends, growth drivers, revenue analysis, and forecast outlook. Our insights help businesses to make data-backed strategic decisions with ongoing market dynamics. Our analysts track relevent industries related to the Cape Verde OEM Insulation Market, allowing our clients with actionable intelligence and reliable forecasts tailored to emerging regional needs.
Yes, we provide customisation as per your requirements. To learn more, feel free to contact us on sales@6wresearch.com
1 Executive Summary |
2 Introduction |
2.1 Key Highlights of the Report |
2.2 Report Description |
2.3 Market Scope & Segmentation |
2.4 Research Methodology |
2.5 Assumptions |
3 Cape Verde OEM Insulation Market Overview |
3.1 Cape Verde Country Macro Economic Indicators |
3.2 Cape Verde OEM Insulation Market Revenues & Volume, 2021 & 2031F |
3.3 Cape Verde OEM Insulation Market - Industry Life Cycle |
3.4 Cape Verde OEM Insulation Market - Porter's Five Forces |
3.5 Cape Verde OEM Insulation Market Revenues & Volume Share, By Material Type, 2021 & 2031F |
3.6 Cape Verde OEM Insulation Market Revenues & Volume Share, By End Use, 2021 & 2031F |
4 Cape Verde OEM Insulation Market Dynamics |
4.1 Impact Analysis |
4.2 Market Drivers |
4.2.1 Increasing demand for energy-efficient buildings in Cape Verde |
4.2.2 Growing construction industry in Cape Verde |
4.2.3 Favorable government regulations promoting the use of insulation materials |
4.3 Market Restraints |
4.3.1 Limited availability of skilled labor for installation of insulation materials |
4.3.2 Fluctuating raw material prices |
4.3.3 Economic downturn impacting construction activities |
5 Cape Verde OEM Insulation Market Trends |
6 Cape Verde OEM Insulation Market Segmentations |
6.1 Cape Verde OEM Insulation Market, By Material Type |
6.1.1 Overview and Analysis |
6.1.2 Cape Verde OEM Insulation Market Revenues & Volume, By Mineral Wool, 2021-2031F |
6.1.3 Cape Verde OEM Insulation Market Revenues & Volume, By Polyurethane Foam, 2021-2031F |
6.1.4 Cape Verde OEM Insulation Market Revenues & Volume, By Flexible Elastomeric Foam, 2021-2031F |
6.1.5 Cape Verde OEM Insulation Market Revenues & Volume, By Other Insulations, 2021-2031F |
6.2 Cape Verde OEM Insulation Market, By End Use |
6.2.1 Overview and Analysis |
6.2.2 Cape Verde OEM Insulation Market Revenues & Volume, By Building & Construction, 2021-2031F |
6.2.3 Cape Verde OEM Insulation Market Revenues & Volume, By Industrial, 2021-2031F |
6.2.4 Cape Verde OEM Insulation Market Revenues & Volume, By Transportation, 2021-2031F |
6.2.5 Cape Verde OEM Insulation Market Revenues & Volume, By Consumer, 2021-2031F |
7 Cape Verde OEM Insulation Market Import-Export Trade Statistics |
7.1 Cape Verde OEM Insulation Market Export to Major Countries |
7.2 Cape Verde OEM Insulation Market Imports from Major Countries |
8 Cape Verde OEM Insulation Market Key Performance Indicators |
8.1 Energy efficiency ratings of buildings in Cape Verde |
8.2 Number of new construction projects using insulation materials |
8.3 Adoption rate of innovative insulation technologies |
8.4 Percentage of government projects incorporating insulation materials |
8.5 Average energy savings achieved through insulation installations |
9 Cape Verde OEM Insulation Market - Opportunity Assessment |
9.1 Cape Verde OEM Insulation Market Opportunity Assessment, By Material Type, 2021 & 2031F |
9.2 Cape Verde OEM Insulation Market Opportunity Assessment, By End Use, 2021 & 2031F |
10 Cape Verde OEM Insulation Market - Competitive Landscape |
10.1 Cape Verde OEM Insulation Market Revenue Share, By Companies, 2024 |
10.2 Cape Verde OEM Insulation Market Competitive Benchmarking, By Operating and Technical Parameters |
11 Company Profiles |
12 Recommendations | 13 Disclaimer |
Global Go To Market Strategy - 2030
Export potential enables firms to identify high-growth global markets with greater confidence by combining advanced trade intelligence with a structured quantitative methodology. The framework analyzes emerging demand trends and country-level import patterns while integrating macroeconomic and trade datasets such as GDP and population forecasts, bilateral import–export flows, tariff structures, elasticity differentials between developed and developing economies, geographic distance, and import demand projections. Using weighted trade values from 2020–2024 as the base period to project country-to-country export potential for 2030, these inputs are operationalized through calculated drivers such as gravity model parameters, tariff impact factors, and projected GDP per-capita growth. Through an analysis of hidden potentials, demand hotspots, and market conditions that are most favorable to success, this method enables firms to focus on target countries, maximize returns, and global expansion with data, backed by accuracy.
By factoring in the projected importer demand gap that is currently unmet and could be potential opportunity, it identifies the potential for the Exporter (Country) among 190 countries, against the general trade analysis, which identifies the biggest importer or exporter.
To discover high-growth global markets and optimize your business strategy:
Click Here
Pricing
- Single User License$ 1,995
- Department License$ 2,400
- Site License$ 3,120
- Global License$ 3,795

Leadership Perspectives from Industry Events
Search
Thought Leadership and Analyst Meet


Our Clients
6WResearch In News
- Doha a strategic location for EV manufacturing hub: IPA Qatar
- Demand for luxury TVs surging in the GCC, says Samsung
- Empowering Growth: The Thriving Journey of Bangladesh’s Cable Industry
- Demand for luxury TVs surging in the GCC, says Samsung
- Video call with a traditional healer? Once unthinkable, it’s now common in South Africa
- Intelligent Buildings To Smooth GCC’s Path To Net Zero
Latest Reports
- Cape Verde Portable Hand-Thrown Extinguisher Market (2026-2032)
- Canada Portable Hand-Thrown Extinguisher Market (2026-2032)
- Cameroon Portable Hand-Thrown Extinguisher Market (2026-2032)
- Burundi Portable Hand-Thrown Extinguisher Market (2026-2032)
- Burkina Faso Portable Hand-Thrown Extinguisher Market (2026-2032)
- Bulgaria Portable Hand-Thrown Extinguisher Market (2026-2032)
- Brunei Portable Hand-Thrown Extinguisher Market (2026-2032)
- Botswana Portable Hand-Thrown Extinguisher Market (2026-2032)
- Bosnia and Herzegovina Portable Hand-Thrown Extinguisher Market (2026-2032)
- Bolivia Portable Hand-Thrown Extinguisher Market (2026-2032)
Industry Events and Analyst Meet

HIMTEX 2026

India Refining Summit 2026

India EV Show 2026

EV tech India Expo 2026

Auto Tech Asia 2026
Whitepaper
- Middle East & Africa Commercial Security Market Click here to view more.
- Middle East & Africa Fire Safety Systems & Equipment Market Click here to view more.
- GCC Drone Market Click here to view more.
- Middle East Lighting Fixture Market Click here to view more.
- GCC Physical & Perimeter Security Market Click here to view more.