Cape Verde Power Amplifier Market (2025-2031) | Analysis, Trends, Value, Segmentation, Industry, Growth, Size, Forecast, Revenue, Outlook, Companies & Share
Market Forecast By Product (Audio Power Amplifier, RF Power Amplifier, Traveling-Wave Tube Amplifier, Solid State Power Amplifier), By Technology (Silicon, Silicon Germanium, Gallium Arsenide, Others), By Vertical (Consumer Electronics, Industrial, Telecommunication, Automotive, Military & Defense, Others) And Competitive Landscape
| Product Code: ETC4732023 | Publication Date: Nov 2023 | Updated Date: Nov 2025 | Product Type: Market Research Report | |
| Publisher: 6Wresearch | Author: Shubham Deep | No. of Pages: 60 | No. of Figures: 30 | No. of Tables: 5 |
Cape Verde Power Amplifier Market: Top 5 Importing Countries and Market Competition (HHI) Analysis
The Cape Verde power amplifier import market saw a significant increase in concentration in 2024, with top exporting countries being Portugal, Areas, nes, Senegal, Spain, and China. Despite a negative CAGR from 2020 to 2024, there was a notable growth spike of 20.85% in 2024. This indicates a potential shift in market dynamics and an opportunity for further analysis on the evolving landscape of power amplifier imports in Cape Verde.

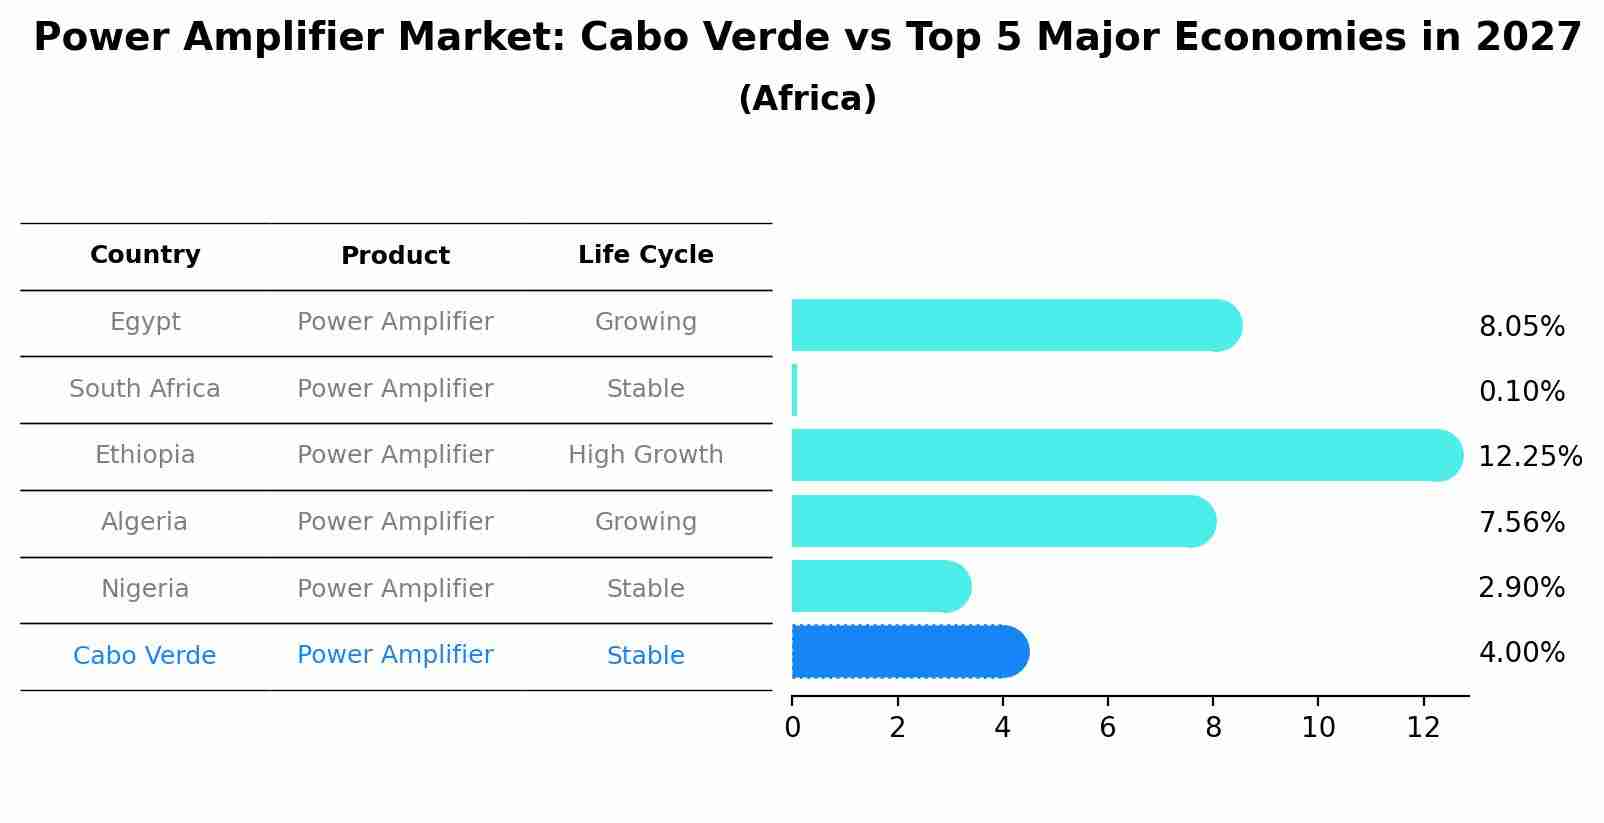
Power Amplifier Market: Cabo Verde vs Top 5 Major Economies in 2027 (Africa)
The Power Amplifier market in Cabo Verde is projected to grow at a stable growth rate of 4.00% by 2027, within the Africa region led by Egypt, along with other countries like South Africa, Ethiopia, Algeria and Nigeria, collectively shaping a dynamic and evolving market environment driven by innovation and increasing adoption of emerging technologies.
Cape Verde Power Amplifier Market Overview
Power amplifiers, essential in telecommunications and broadcasting, have a growing market in Cape Verde. The demand is driven by the expansion of communication networks and the increasing need for reliable signal amplification. As the country continues to improve its telecommunications infrastructure, the power amplifier market is likely to expand.
Drivers of the market
The power amplifier market in Cape Verde is influenced by the increasing demand for high-quality audio and communication systems. Power amplifiers are essential for boosting signal strength in various applications, including broadcasting, telecommunications, and consumer electronics. The growth in entertainment, telecommunications, and broadcasting sectors supports the demand for advanced power amplification technologies.
Challenges of the market
The power amplifier market in Cape Verde is challenged by high import costs and the need for advanced technology and components. There is a lack of local manufacturing facilities and technical expertise required for effective production and maintenance. The market faces competition from international brands and alternative amplification solutions. Additionally, distribution and supply chain issues impact the availability and cost of power amplifiers in the local market.
Government Policy of the market
Cape Verdes government could enhance the power amplifier market by promoting its use in telecommunications and broadcasting. Policies might include providing support for local manufacturing, setting standards for amplifier performance, and encouraging research into new technologies to improve efficiency and performance.
Key Highlights of the Report:
- Cape Verde Power Amplifier Market Outlook
- Market Size of Cape Verde Power Amplifier Market, 2024
- Forecast of Cape Verde Power Amplifier Market, 2031
- Historical Data and Forecast of Cape Verde Power Amplifier Revenues & Volume for the Period 2021-2031
- Cape Verde Power Amplifier Market Trend Evolution
- Cape Verde Power Amplifier Market Drivers and Challenges
- Cape Verde Power Amplifier Price Trends
- Cape Verde Power Amplifier Porter`s Five Forces
- Cape Verde Power Amplifier Industry Life Cycle
- Historical Data and Forecast of Cape Verde Power Amplifier Market Revenues & Volume By Product for the Period 2021-2031
- Historical Data and Forecast of Cape Verde Power Amplifier Market Revenues & Volume By Audio Power Amplifier for the Period 2021-2031
- Historical Data and Forecast of Cape Verde Power Amplifier Market Revenues & Volume By RF Power Amplifier for the Period 2021-2031
- Historical Data and Forecast of Cape Verde Power Amplifier Market Revenues & Volume By Traveling-Wave Tube Amplifier for the Period 2021-2031
- Historical Data and Forecast of Cape Verde Power Amplifier Market Revenues & Volume By Solid State Power Amplifier for the Period 2021-2031
- Historical Data and Forecast of Cape Verde Power Amplifier Market Revenues & Volume By Technology for the Period 2021-2031
- Historical Data and Forecast of Cape Verde Power Amplifier Market Revenues & Volume By Silicon for the Period 2021-2031
- Historical Data and Forecast of Cape Verde Power Amplifier Market Revenues & Volume By Silicon Germanium for the Period 2021-2031
- Historical Data and Forecast of Cape Verde Power Amplifier Market Revenues & Volume By Gallium Arsenide for the Period 2021-2031
- Historical Data and Forecast of Cape Verde Power Amplifier Market Revenues & Volume By Others for the Period 2021-2031
- Historical Data and Forecast of Cape Verde Power Amplifier Market Revenues & Volume By Vertical for the Period 2021-2031
- Historical Data and Forecast of Cape Verde Power Amplifier Market Revenues & Volume By Consumer Electronics for the Period 2021-2031
- Historical Data and Forecast of Cape Verde Power Amplifier Market Revenues & Volume By Industrial for the Period 2021-2031
- Historical Data and Forecast of Cape Verde Power Amplifier Market Revenues & Volume By Telecommunication for the Period 2021-2031
- Historical Data and Forecast of Cape Verde Power Amplifier Market Revenues & Volume By Automotive for the Period 2021-2031
- Historical Data and Forecast of Cape Verde Power Amplifier Market Revenues & Volume By Military & Defense for the Period 2021-2031
- Historical Data and Forecast of Cape Verde Power Amplifier Market Revenues & Volume By Others for the Period 2021-2031
- Cape Verde Power Amplifier Import Export Trade Statistics
- Market Opportunity Assessment By Product
- Market Opportunity Assessment By Technology
- Market Opportunity Assessment By Vertical
- Cape Verde Power Amplifier Top Companies Market Share
- Cape Verde Power Amplifier Competitive Benchmarking By Technical and Operational Parameters
- Cape Verde Power Amplifier Company Profiles
- Cape Verde Power Amplifier Key Strategic Recommendations
Frequently Asked Questions About the Market Study (FAQs):
6Wresearch actively monitors the Cape Verde Power Amplifier Market and publishes its comprehensive annual report, highlighting emerging trends, growth drivers, revenue analysis, and forecast outlook. Our insights help businesses to make data-backed strategic decisions with ongoing market dynamics. Our analysts track relevent industries related to the Cape Verde Power Amplifier Market, allowing our clients with actionable intelligence and reliable forecasts tailored to emerging regional needs.
Yes, we provide customisation as per your requirements. To learn more, feel free to contact us on sales@6wresearch.com
1 Executive Summary |
2 Introduction |
2.1 Key Highlights of the Report |
2.2 Report Description |
2.3 Market Scope & Segmentation |
2.4 Research Methodology |
2.5 Assumptions |
3 Cape Verde Power Amplifier Market Overview |
3.1 Cape Verde Country Macro Economic Indicators |
3.2 Cape Verde Power Amplifier Market Revenues & Volume, 2021 & 2031F |
3.3 Cape Verde Power Amplifier Market - Industry Life Cycle |
3.4 Cape Verde Power Amplifier Market - Porter's Five Forces |
3.5 Cape Verde Power Amplifier Market Revenues & Volume Share, By Product, 2021 & 2031F |
3.6 Cape Verde Power Amplifier Market Revenues & Volume Share, By Technology, 2021 & 2031F |
3.7 Cape Verde Power Amplifier Market Revenues & Volume Share, By Vertical, 2021 & 2031F |
4 Cape Verde Power Amplifier Market Dynamics |
4.1 Impact Analysis |
4.2 Market Drivers |
4.3 Market Restraints |
5 Cape Verde Power Amplifier Market Trends |
6 Cape Verde Power Amplifier Market Segmentations |
6.1 Cape Verde Power Amplifier Market, By Product |
6.1.1 Overview and Analysis |
6.1.2 Cape Verde Power Amplifier Market Revenues & Volume, By Audio Power Amplifier, 2021-2031F |
6.1.3 Cape Verde Power Amplifier Market Revenues & Volume, By RF Power Amplifier, 2021-2031F |
6.1.4 Cape Verde Power Amplifier Market Revenues & Volume, By Traveling-Wave Tube Amplifier, 2021-2031F |
6.1.5 Cape Verde Power Amplifier Market Revenues & Volume, By Solid State Power Amplifier, 2021-2031F |
6.2 Cape Verde Power Amplifier Market, By Technology |
6.2.1 Overview and Analysis |
6.2.2 Cape Verde Power Amplifier Market Revenues & Volume, By Silicon, 2021-2031F |
6.2.3 Cape Verde Power Amplifier Market Revenues & Volume, By Silicon Germanium, 2021-2031F |
6.2.4 Cape Verde Power Amplifier Market Revenues & Volume, By Gallium Arsenide, 2021-2031F |
6.2.5 Cape Verde Power Amplifier Market Revenues & Volume, By Others, 2021-2031F |
6.3 Cape Verde Power Amplifier Market, By Vertical |
6.3.1 Overview and Analysis |
6.3.2 Cape Verde Power Amplifier Market Revenues & Volume, By Consumer Electronics, 2021-2031F |
6.3.3 Cape Verde Power Amplifier Market Revenues & Volume, By Industrial, 2021-2031F |
6.3.4 Cape Verde Power Amplifier Market Revenues & Volume, By Telecommunication, 2021-2031F |
6.3.5 Cape Verde Power Amplifier Market Revenues & Volume, By Automotive, 2021-2031F |
6.3.6 Cape Verde Power Amplifier Market Revenues & Volume, By Military & Defense, 2021-2031F |
6.3.7 Cape Verde Power Amplifier Market Revenues & Volume, By Others, 2021-2031F |
7 Cape Verde Power Amplifier Market Import-Export Trade Statistics |
7.1 Cape Verde Power Amplifier Market Export to Major Countries |
7.2 Cape Verde Power Amplifier Market Imports from Major Countries |
8 Cape Verde Power Amplifier Market Key Performance Indicators |
9 Cape Verde Power Amplifier Market - Opportunity Assessment |
9.1 Cape Verde Power Amplifier Market Opportunity Assessment, By Product, 2021 & 2031F |
9.2 Cape Verde Power Amplifier Market Opportunity Assessment, By Technology, 2021 & 2031F |
9.3 Cape Verde Power Amplifier Market Opportunity Assessment, By Vertical, 2021 & 2031F |
10 Cape Verde Power Amplifier Market - Competitive Landscape |
10.1 Cape Verde Power Amplifier Market Revenue Share, By Companies, 2024 |
10.2 Cape Verde Power Amplifier Market Competitive Benchmarking, By Operating and Technical Parameters |
11 Company Profiles |
12 Recommendations | 13 Disclaimer |
Global Go To Market Strategy - 2030
Export potential enables firms to identify high-growth global markets with greater confidence by combining advanced trade intelligence with a structured quantitative methodology. The framework analyzes emerging demand trends and country-level import patterns while integrating macroeconomic and trade datasets such as GDP and population forecasts, bilateral import–export flows, tariff structures, elasticity differentials between developed and developing economies, geographic distance, and import demand projections. Using weighted trade values from 2020–2024 as the base period to project country-to-country export potential for 2030, these inputs are operationalized through calculated drivers such as gravity model parameters, tariff impact factors, and projected GDP per-capita growth. Through an analysis of hidden potentials, demand hotspots, and market conditions that are most favorable to success, this method enables firms to focus on target countries, maximize returns, and global expansion with data, backed by accuracy.
By factoring in the projected importer demand gap that is currently unmet and could be potential opportunity, it identifies the potential for the Exporter (Country) among 190 countries, against the general trade analysis, which identifies the biggest importer or exporter.
To discover high-growth global markets and optimize your business strategy:
Click Here
Pricing
- Single User License$ 1,995
- Department License$ 2,400
- Site License$ 3,120
- Global License$ 3,795

Leadership Perspectives from Industry Events
Search
Thought Leadership and Analyst Meet


Our Clients
6WResearch In News
- Doha a strategic location for EV manufacturing hub: IPA Qatar
- Demand for luxury TVs surging in the GCC, says Samsung
- Empowering Growth: The Thriving Journey of Bangladesh’s Cable Industry
- Demand for luxury TVs surging in the GCC, says Samsung
- Video call with a traditional healer? Once unthinkable, it’s now common in South Africa
- Intelligent Buildings To Smooth GCC’s Path To Net Zero
Latest Reports
- Cape Verde Portable Hand-Thrown Extinguisher Market (2026-2032)
- Canada Portable Hand-Thrown Extinguisher Market (2026-2032)
- Cameroon Portable Hand-Thrown Extinguisher Market (2026-2032)
- Burundi Portable Hand-Thrown Extinguisher Market (2026-2032)
- Burkina Faso Portable Hand-Thrown Extinguisher Market (2026-2032)
- Bulgaria Portable Hand-Thrown Extinguisher Market (2026-2032)
- Brunei Portable Hand-Thrown Extinguisher Market (2026-2032)
- Botswana Portable Hand-Thrown Extinguisher Market (2026-2032)
- Bosnia and Herzegovina Portable Hand-Thrown Extinguisher Market (2026-2032)
- Bolivia Portable Hand-Thrown Extinguisher Market (2026-2032)
Industry Events and Analyst Meet

HIMTEX 2026

India Refining Summit 2026

India EV Show 2026

EV tech India Expo 2026

Auto Tech Asia 2026
Whitepaper
- Middle East & Africa Commercial Security Market Click here to view more.
- Middle East & Africa Fire Safety Systems & Equipment Market Click here to view more.
- GCC Drone Market Click here to view more.
- Middle East Lighting Fixture Market Click here to view more.
- GCC Physical & Perimeter Security Market Click here to view more.