Cape Verde Preserved Flowers Market (2025-2031) | Growth, Forecast, Segmentation, Value, Trends, Size, Outlook, Analysis, Revenue, Industry, Share & Companies
Market Forecast By Flower Type (Rose, Orchid, Gardenia, Lavender, Carnations, Peony, Others), By Preservation Technique (Air Drying, Glycerin, Silica Gel, Pressing, Sand, Others), By Application (Weddings & Events Decoration, Unique Gifts, Home Decoration, Jewelry & Fashion Accessories, Others), By Price (Low, Medium, High), By Distribution Channel (Online, Offline) And Competitive Landscape
| Product Code: ETC5310573 | Publication Date: Nov 2023 | Updated Date: Nov 2025 | Product Type: Market Research Report | |
| Publisher: 6Wresearch | Author: Bhawna Singh | No. of Pages: 60 | No. of Figures: 30 | No. of Tables: 5 |
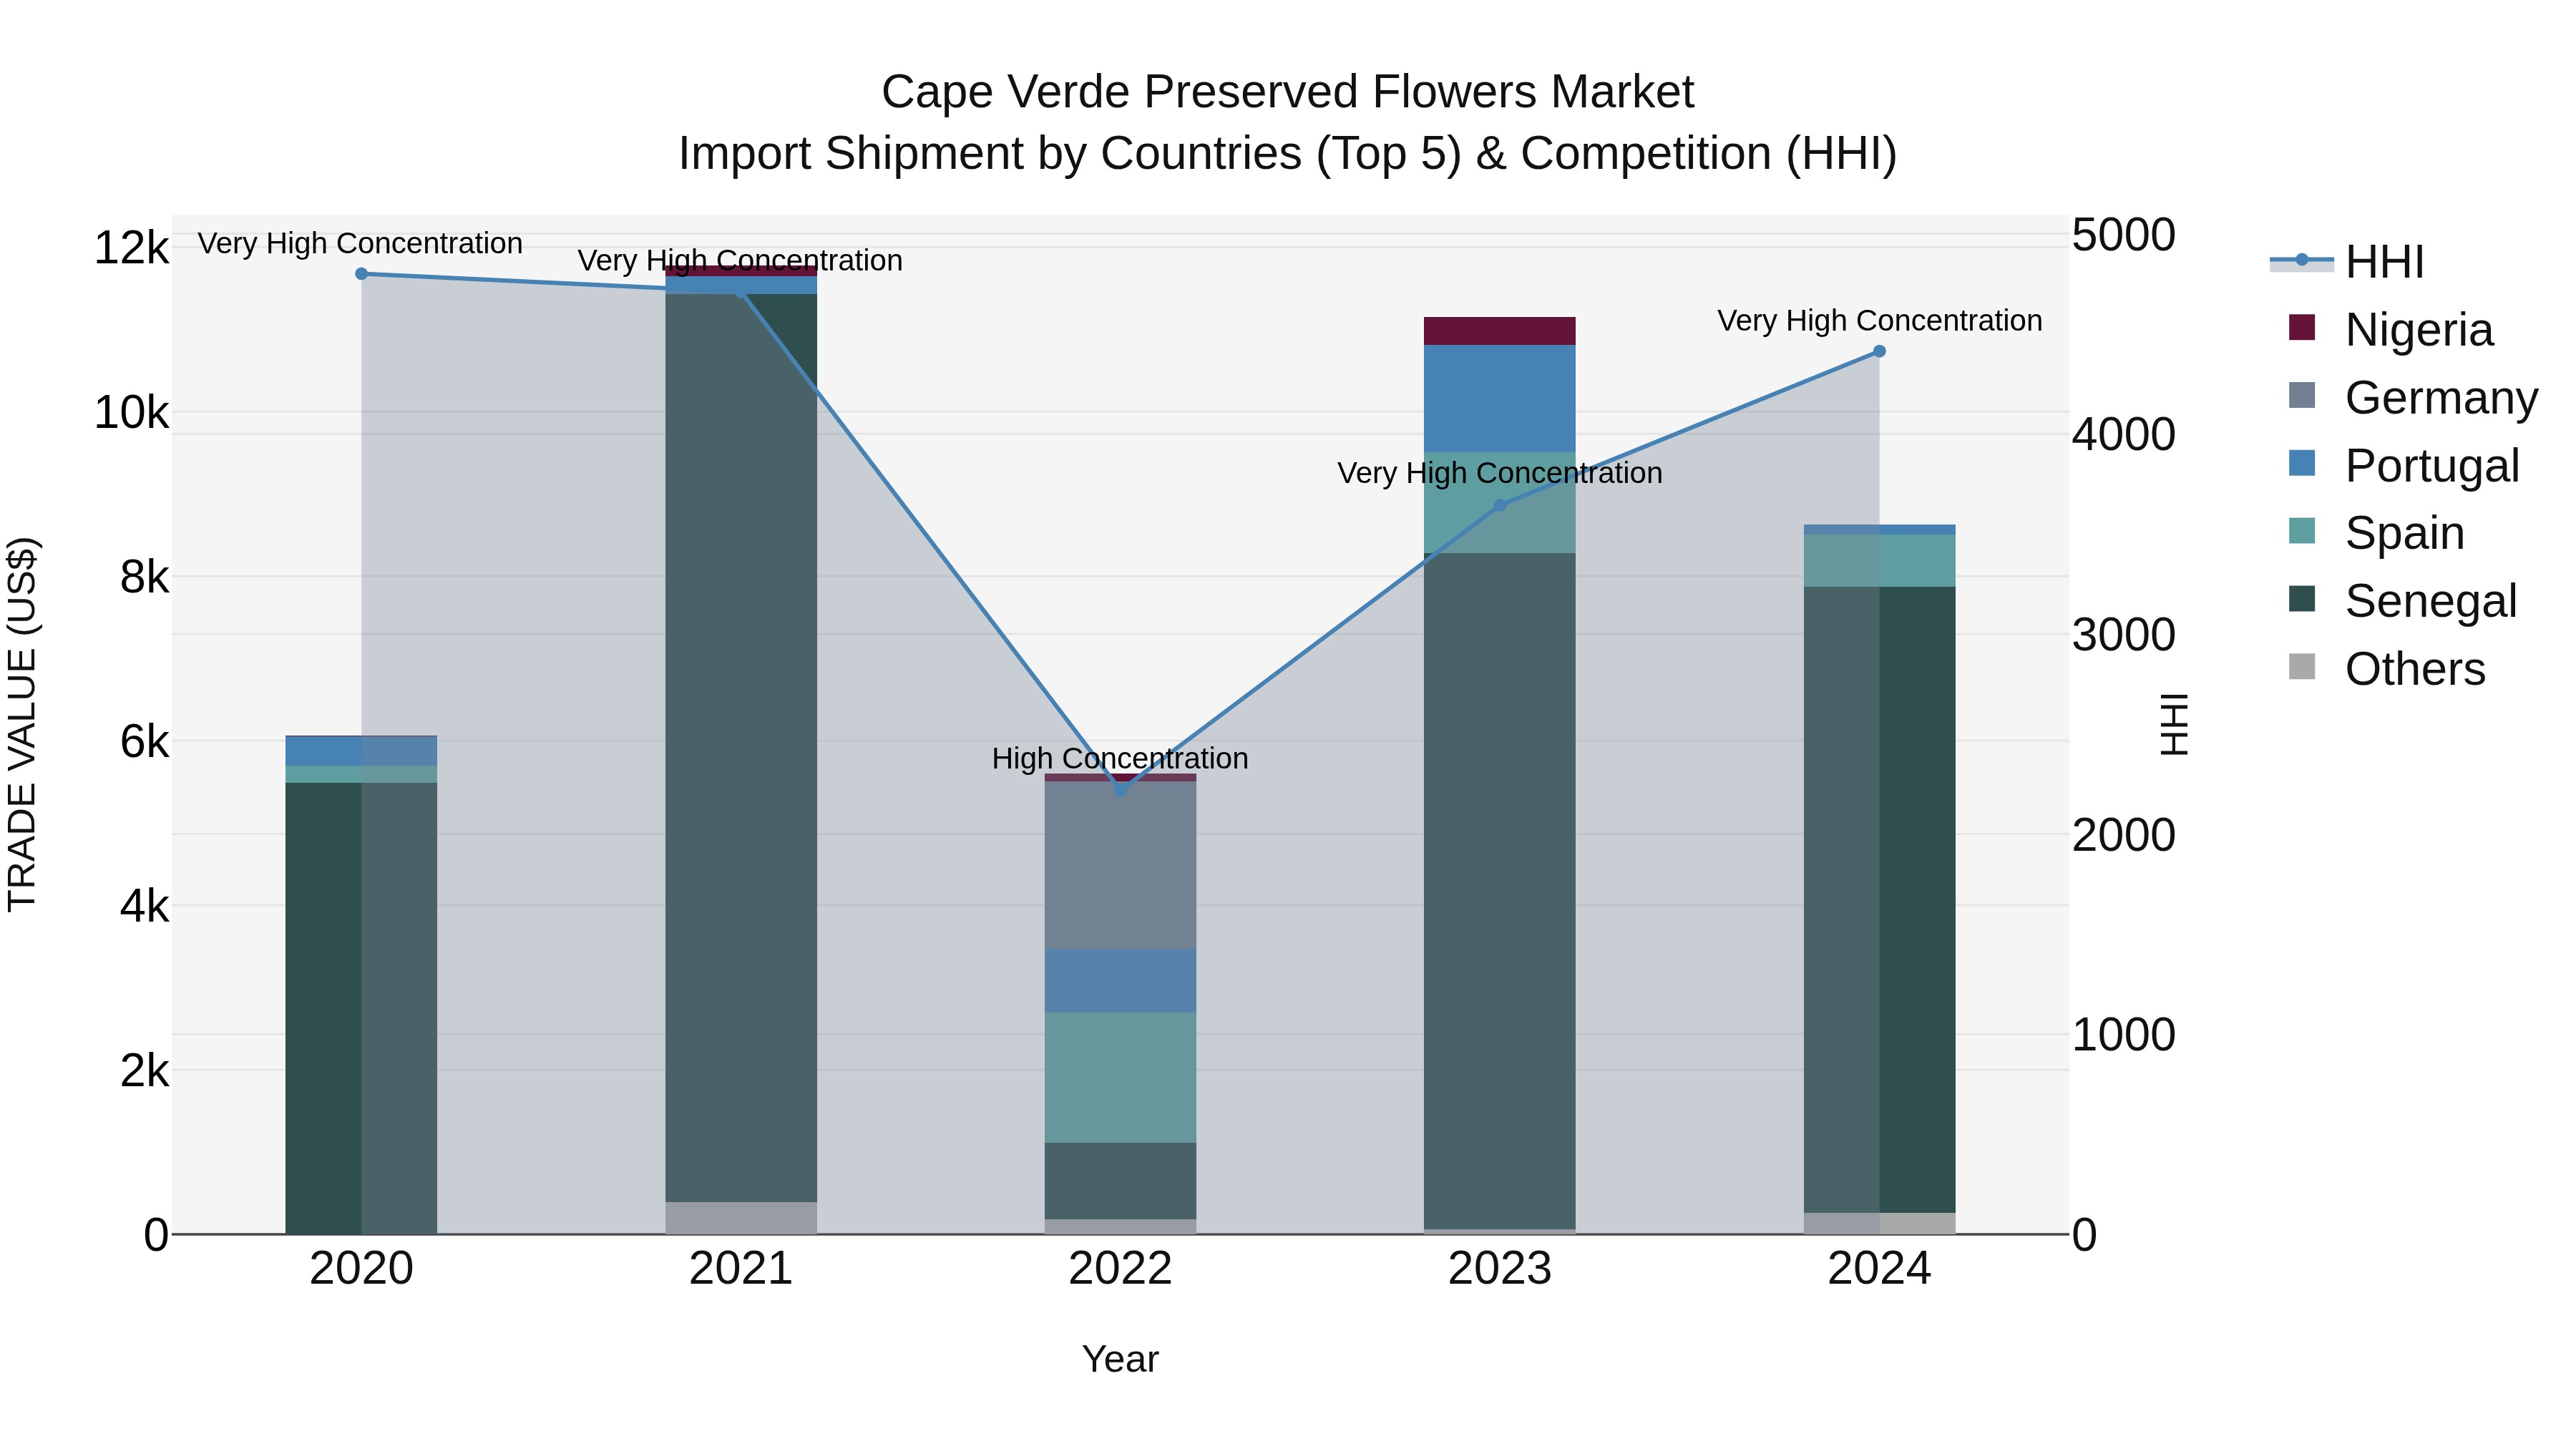
Cape Verde Preserved Flowers Market: Top 5 Importing Countries and Market Competition (HHI) Analysis
Cape Verde`s preserved flowers import market in 2024 continues to be dominated by key exporters such as Senegal, Spain, Areas, nes, Portugal, and China. Despite a notable decline in growth rate from 2023 to 2024, the market has shown a strong compound annual growth rate (CAGR) of 9.23% from 2020 to 2024. The high Herfindahl-Hirschman Index (HHI) indicates a concentrated market structure, offering both opportunities and challenges for importers and suppliers in the preserved flowers industry in Cape Verde.
Cape Verde Preserved Flowers Market Overview
The preserved flowers market in Cape Verde caters to consumers looking for long-lasting floral arrangements for decoration and gifts. These flowers are treated to maintain their appearance for an extended period, offering a durable alternative to fresh flowers. As consumer preferences shift towards more sustainable and long-lasting products, the market for preserved flowers in Cape Verde is expected to grow, driven by both domestic demand and tourism-related purchases.
Drivers of the market
The preserved flowers market in Cape Verde is driven by the growing popularity of long-lasting floral arrangements for decorative purposes. Preserved flowers offer the beauty of fresh flowers with extended longevity and minimal maintenance. The demand for unique and enduring floral products in events and home decor supports the market for preserved flowers.
Challenges of the market
In Cape Verde, the preserved flowers market faces challenges such as high import costs and limited local production capabilities. There is a need for specialized preservation technology and expertise that are not readily available locally. The market is also impacted by competition from global suppliers and alternative decorative solutions. Supply chain logistics and distribution issues further complicate market growth and accessibility.
Government Policy of the market
To support the preserved flowers market, the government might focus on promoting the use of preserved flowers in decorative and commercial applications. Policies could include providing incentives for local production, setting standards for flower quality and preservation methods, and encouraging research into new technologies and applications for preserved flowers.
Key Highlights of the Report:
- Cape Verde Preserved Flowers Market Outlook
- Market Size of Cape Verde Preserved Flowers Market, 2024
- Forecast of Cape Verde Preserved Flowers Market, 2031
- Historical Data and Forecast of Cape Verde Preserved Flowers Revenues & Volume for the Period 2021-2031
- Cape Verde Preserved Flowers Market Trend Evolution
- Cape Verde Preserved Flowers Market Drivers and Challenges
- Cape Verde Preserved Flowers Price Trends
- Cape Verde Preserved Flowers Porter`s Five Forces
- Cape Verde Preserved Flowers Industry Life Cycle
- Historical Data and Forecast of Cape Verde Preserved Flowers Market Revenues & Volume By Flower Type for the Period 2021-2031
- Historical Data and Forecast of Cape Verde Preserved Flowers Market Revenues & Volume By Rose for the Period 2021-2031
- Historical Data and Forecast of Cape Verde Preserved Flowers Market Revenues & Volume By Orchid for the Period 2021-2031
- Historical Data and Forecast of Cape Verde Preserved Flowers Market Revenues & Volume By Gardenia for the Period 2021-2031
- Historical Data and Forecast of Cape Verde Preserved Flowers Market Revenues & Volume By Lavender for the Period 2021-2031
- Historical Data and Forecast of Cape Verde Preserved Flowers Market Revenues & Volume By Carnations for the Period 2021-2031
- Historical Data and Forecast of Cape Verde Preserved Flowers Market Revenues & Volume By Peony for the Period 2021-2031
- Historical Data and Forecast of Cape Verde Preserved Flowers Market Revenues & Volume By Others for the Period 2021-2031
- Historical Data and Forecast of Cape Verde Preserved Flowers Market Revenues & Volume By Preservation Technique for the Period 2021-2031
- Historical Data and Forecast of Cape Verde Preserved Flowers Market Revenues & Volume By Air Drying for the Period 2021-2031
- Historical Data and Forecast of Cape Verde Preserved Flowers Market Revenues & Volume By Glycerin for the Period 2021-2031
- Historical Data and Forecast of Cape Verde Preserved Flowers Market Revenues & Volume By Silica Gel for the Period 2021-2031
- Historical Data and Forecast of Cape Verde Preserved Flowers Market Revenues & Volume By Pressing for the Period 2021-2031
- Historical Data and Forecast of Cape Verde Preserved Flowers Market Revenues & Volume By Sand for the Period 2021-2031
- Historical Data and Forecast of Cape Verde Preserved Flowers Market Revenues & Volume By Others for the Period 2021-2031
- Historical Data and Forecast of Cape Verde Preserved Flowers Market Revenues & Volume By Application for the Period 2021-2031
- Historical Data and Forecast of Cape Verde Preserved Flowers Market Revenues & Volume By Weddings & Events Decoration for the Period 2021-2031
- Historical Data and Forecast of Cape Verde Preserved Flowers Market Revenues & Volume By Unique Gifts for the Period 2021-2031
- Historical Data and Forecast of Cape Verde Preserved Flowers Market Revenues & Volume By Home Decoration for the Period 2021-2031
- Historical Data and Forecast of Cape Verde Preserved Flowers Market Revenues & Volume By Jewelry & Fashion Accessories for the Period 2021-2031
- Historical Data and Forecast of Cape Verde Preserved Flowers Market Revenues & Volume By Others for the Period 2021-2031
- Historical Data and Forecast of Cape Verde Preserved Flowers Market Revenues & Volume By Price for the Period 2021-2031
- Historical Data and Forecast of Cape Verde Preserved Flowers Market Revenues & Volume By Low for the Period 2021-2031
- Historical Data and Forecast of Cape Verde Preserved Flowers Market Revenues & Volume By Medium for the Period 2021-2031
- Historical Data and Forecast of Cape Verde Preserved Flowers Market Revenues & Volume By High for the Period 2021-2031
- Historical Data and Forecast of Cape Verde Preserved Flowers Market Revenues & Volume By Distribution Channel for the Period 2021-2031
- Historical Data and Forecast of Cape Verde Preserved Flowers Market Revenues & Volume By Online for the Period 2021-2031
- Historical Data and Forecast of Cape Verde Preserved Flowers Market Revenues & Volume By Offline for the Period 2021-2031
- Cape Verde Preserved Flowers Import Export Trade Statistics
- Market Opportunity Assessment By Flower Type
- Market Opportunity Assessment By Preservation Technique
- Market Opportunity Assessment By Application
- Market Opportunity Assessment By Price
- Market Opportunity Assessment By Distribution Channel
- Cape Verde Preserved Flowers Top Companies Market Share
- Cape Verde Preserved Flowers Competitive Benchmarking By Technical and Operational Parameters
- Cape Verde Preserved Flowers Company Profiles
- Cape Verde Preserved Flowers Key Strategic Recommendations
Frequently Asked Questions About the Market Study (FAQs):
6Wresearch actively monitors the Cape Verde Preserved Flowers Market and publishes its comprehensive annual report, highlighting emerging trends, growth drivers, revenue analysis, and forecast outlook. Our insights help businesses to make data-backed strategic decisions with ongoing market dynamics. Our analysts track relevent industries related to the Cape Verde Preserved Flowers Market, allowing our clients with actionable intelligence and reliable forecasts tailored to emerging regional needs.
Yes, we provide customisation as per your requirements. To learn more, feel free to contact us on sales@6wresearch.com
1 Executive Summary |
2 Introduction |
2.1 Key Highlights of the Report |
2.2 Report Description |
2.3 Market Scope & Segmentation |
2.4 Research Methodology |
2.5 Assumptions |
3 Cape Verde Preserved Flowers Market Overview |
3.1 Cape Verde Country Macro Economic Indicators |
3.2 Cape Verde Preserved Flowers Market Revenues & Volume, 2021 & 2031F |
3.3 Cape Verde Preserved Flowers Market - Industry Life Cycle |
3.4 Cape Verde Preserved Flowers Market - Porter's Five Forces |
3.5 Cape Verde Preserved Flowers Market Revenues & Volume Share, By Flower Type, 2021 & 2031F |
3.6 Cape Verde Preserved Flowers Market Revenues & Volume Share, By Preservation Technique, 2021 & 2031F |
3.7 Cape Verde Preserved Flowers Market Revenues & Volume Share, By Application, 2021 & 2031F |
3.8 Cape Verde Preserved Flowers Market Revenues & Volume Share, By Price, 2021 & 2031F |
3.9 Cape Verde Preserved Flowers Market Revenues & Volume Share, By Distribution Channel, 2021 & 2031F |
4 Cape Verde Preserved Flowers Market Dynamics |
4.1 Impact Analysis |
4.2 Market Drivers |
4.2.1 Growing demand for eco-friendly and long-lasting floral products |
4.2.2 Increasing awareness and preference for sustainable and natural décor options |
4.2.3 Rise in gifting culture and demand for unique gift items |
4.3 Market Restraints |
4.3.1 Seasonal availability and limited variety of preserved flowers |
4.3.2 High initial cost compared to fresh flowers |
4.3.3 Challenges in maintaining the quality and color of preserved flowers over time |
5 Cape Verde Preserved Flowers Market Trends |
6 Cape Verde Preserved Flowers Market Segmentations |
6.1 Cape Verde Preserved Flowers Market, By Flower Type |
6.1.1 Overview and Analysis |
6.1.2 Cape Verde Preserved Flowers Market Revenues & Volume, By Rose, 2021-2031F |
6.1.3 Cape Verde Preserved Flowers Market Revenues & Volume, By Orchid, 2021-2031F |
6.1.4 Cape Verde Preserved Flowers Market Revenues & Volume, By Gardenia, 2021-2031F |
6.1.5 Cape Verde Preserved Flowers Market Revenues & Volume, By Lavender, 2021-2031F |
6.1.6 Cape Verde Preserved Flowers Market Revenues & Volume, By Carnations, 2021-2031F |
6.1.7 Cape Verde Preserved Flowers Market Revenues & Volume, By Peony, 2021-2031F |
6.2 Cape Verde Preserved Flowers Market, By Preservation Technique |
6.2.1 Overview and Analysis |
6.2.2 Cape Verde Preserved Flowers Market Revenues & Volume, By Air Drying, 2021-2031F |
6.2.3 Cape Verde Preserved Flowers Market Revenues & Volume, By Glycerin, 2021-2031F |
6.2.4 Cape Verde Preserved Flowers Market Revenues & Volume, By Silica Gel, 2021-2031F |
6.2.5 Cape Verde Preserved Flowers Market Revenues & Volume, By Pressing, 2021-2031F |
6.2.6 Cape Verde Preserved Flowers Market Revenues & Volume, By Sand, 2021-2031F |
6.2.7 Cape Verde Preserved Flowers Market Revenues & Volume, By Others, 2021-2031F |
6.3 Cape Verde Preserved Flowers Market, By Application |
6.3.1 Overview and Analysis |
6.3.2 Cape Verde Preserved Flowers Market Revenues & Volume, By Weddings & Events Decoration, 2021-2031F |
6.3.3 Cape Verde Preserved Flowers Market Revenues & Volume, By Unique Gifts, 2021-2031F |
6.3.4 Cape Verde Preserved Flowers Market Revenues & Volume, By Home Decoration, 2021-2031F |
6.3.5 Cape Verde Preserved Flowers Market Revenues & Volume, By Jewelry & Fashion Accessories, 2021-2031F |
6.3.6 Cape Verde Preserved Flowers Market Revenues & Volume, By Others, 2021-2031F |
6.4 Cape Verde Preserved Flowers Market, By Price |
6.4.1 Overview and Analysis |
6.4.2 Cape Verde Preserved Flowers Market Revenues & Volume, By Low, 2021-2031F |
6.4.3 Cape Verde Preserved Flowers Market Revenues & Volume, By Medium, 2021-2031F |
6.4.4 Cape Verde Preserved Flowers Market Revenues & Volume, By High, 2021-2031F |
6.5 Cape Verde Preserved Flowers Market, By Distribution Channel |
6.5.1 Overview and Analysis |
6.5.2 Cape Verde Preserved Flowers Market Revenues & Volume, By Online, 2021-2031F |
6.5.3 Cape Verde Preserved Flowers Market Revenues & Volume, By Offline, 2021-2031F |
7 Cape Verde Preserved Flowers Market Import-Export Trade Statistics |
7.1 Cape Verde Preserved Flowers Market Export to Major Countries |
7.2 Cape Verde Preserved Flowers Market Imports from Major Countries |
8 Cape Verde Preserved Flowers Market Key Performance Indicators |
8.1 Customer satisfaction score related to the longevity and quality of preserved flowers |
8.2 Percentage of repeat customers purchasing preserved flowers |
8.3 Number of partnerships with event planners, interior designers, and retailers for showcasing preserved flowers |
9 Cape Verde Preserved Flowers Market - Opportunity Assessment |
9.1 Cape Verde Preserved Flowers Market Opportunity Assessment, By Flower Type, 2021 & 2031F |
9.2 Cape Verde Preserved Flowers Market Opportunity Assessment, By Preservation Technique, 2021 & 2031F |
9.3 Cape Verde Preserved Flowers Market Opportunity Assessment, By Application, 2021 & 2031F |
9.4 Cape Verde Preserved Flowers Market Opportunity Assessment, By Price, 2021 & 2031F |
9.5 Cape Verde Preserved Flowers Market Opportunity Assessment, By Distribution Channel, 2021 & 2031F |
10 Cape Verde Preserved Flowers Market - Competitive Landscape |
10.1 Cape Verde Preserved Flowers Market Revenue Share, By Companies, 2024 |
10.2 Cape Verde Preserved Flowers Market Competitive Benchmarking, By Operating and Technical Parameters |
11 Company Profiles |
12 Recommendations | 13 Disclaimer |
Global Go To Market Strategy - 2030
Export potential enables firms to identify high-growth global markets with greater confidence by combining advanced trade intelligence with a structured quantitative methodology. The framework analyzes emerging demand trends and country-level import patterns while integrating macroeconomic and trade datasets such as GDP and population forecasts, bilateral import–export flows, tariff structures, elasticity differentials between developed and developing economies, geographic distance, and import demand projections. Using weighted trade values from 2020–2024 as the base period to project country-to-country export potential for 2030, these inputs are operationalized through calculated drivers such as gravity model parameters, tariff impact factors, and projected GDP per-capita growth. Through an analysis of hidden potentials, demand hotspots, and market conditions that are most favorable to success, this method enables firms to focus on target countries, maximize returns, and global expansion with data, backed by accuracy.
By factoring in the projected importer demand gap that is currently unmet and could be potential opportunity, it identifies the potential for the Exporter (Country) among 190 countries, against the general trade analysis, which identifies the biggest importer or exporter.
To discover high-growth global markets and optimize your business strategy:
Click Here
Pricing
- Single User License$ 1,995
- Department License$ 2,400
- Site License$ 3,120
- Global License$ 3,795

Leadership Perspectives from Industry Events
Search
Thought Leadership and Analyst Meet


Our Clients
6WResearch In News
- India Export Attractiveness Tracker 2026
- India Air Conditioner Market Set for Strong Rebound in 2026 After Weather-Led Correction and GST-Driven Recovery: 6Wresearch
- ADAS in India: How Automatic Emergency Braking, Blind Spot Detection & Driver Monitoring are Transforming Road Safety
- Doha a strategic location for EV manufacturing hub: IPA Qatar
- Demand for luxury TVs surging in the GCC, says Samsung
- Empowering Growth: The Thriving Journey of Bangladesh’s Cable Industry
Latest Reports
- Nicaragua RPG Gaming Market (2026-2032)
- New Zealand RPG Gaming Market (2026-2032)
- Netherlands RPG Gaming Market (2026-2032)
- Nauru RPG Gaming Market (2026-2032)
- Namibia RPG Gaming Market (2026-2032)
- Mozambique RPG Gaming Market (2026-2032)
- Montenegro RPG Gaming Market (2026-2032)
- Mongolia RPG Gaming Market (2026-2032)
- Monaco RPG Gaming Market (2026-2032)
- Micronesia RPG Gaming Market (2026-2032)
Industry Events and Analyst Meet

EV India Expo 2026

HIMTEX 2026

India Refining Summit 2026

India EV Show 2026

EV tech India Expo 2026
Whitepaper
- Middle East & Africa Commercial Security Market Click here to view more.
- Middle East & Africa Fire Safety Systems & Equipment Market Click here to view more.
- GCC Drone Market Click here to view more.
- Middle East Lighting Fixture Market Click here to view more.
- GCC Physical & Perimeter Security Market Click here to view more.