China Absorbent Mats Market (2026-2032) | Growth, Segmentation, Value, Trends, Industry, Share, Analysis, Forecast, Competitive Landscape, Size & Revenue, Companies, Outlook
Market Forecast By Material (Polypropylene, PVC, Nitrile, Rubber, Others), By Category (Grease & Oil Absorbing Mats, Chemical Absorbent Mats, Universal Absorbent Mats), By End-user (Food & Beverages, Automotive, Chemicals, Oil & Gas, Pharmaceuticals, Others), By Price (Low, Medium, High), By Distribution Channel (Direct Sales, Indirect Sales) And Competitive Landscape
| Product Code: ETC6735535 | Publication Date: Sep 2024 | Updated Date: Apr 2026 | Product Type: Market Research Report | |
| Publisher: 6Wresearch | Author: Sumit Sagar | No. of Pages: 75 | No. of Figures: 35 | No. of Tables: 20 |
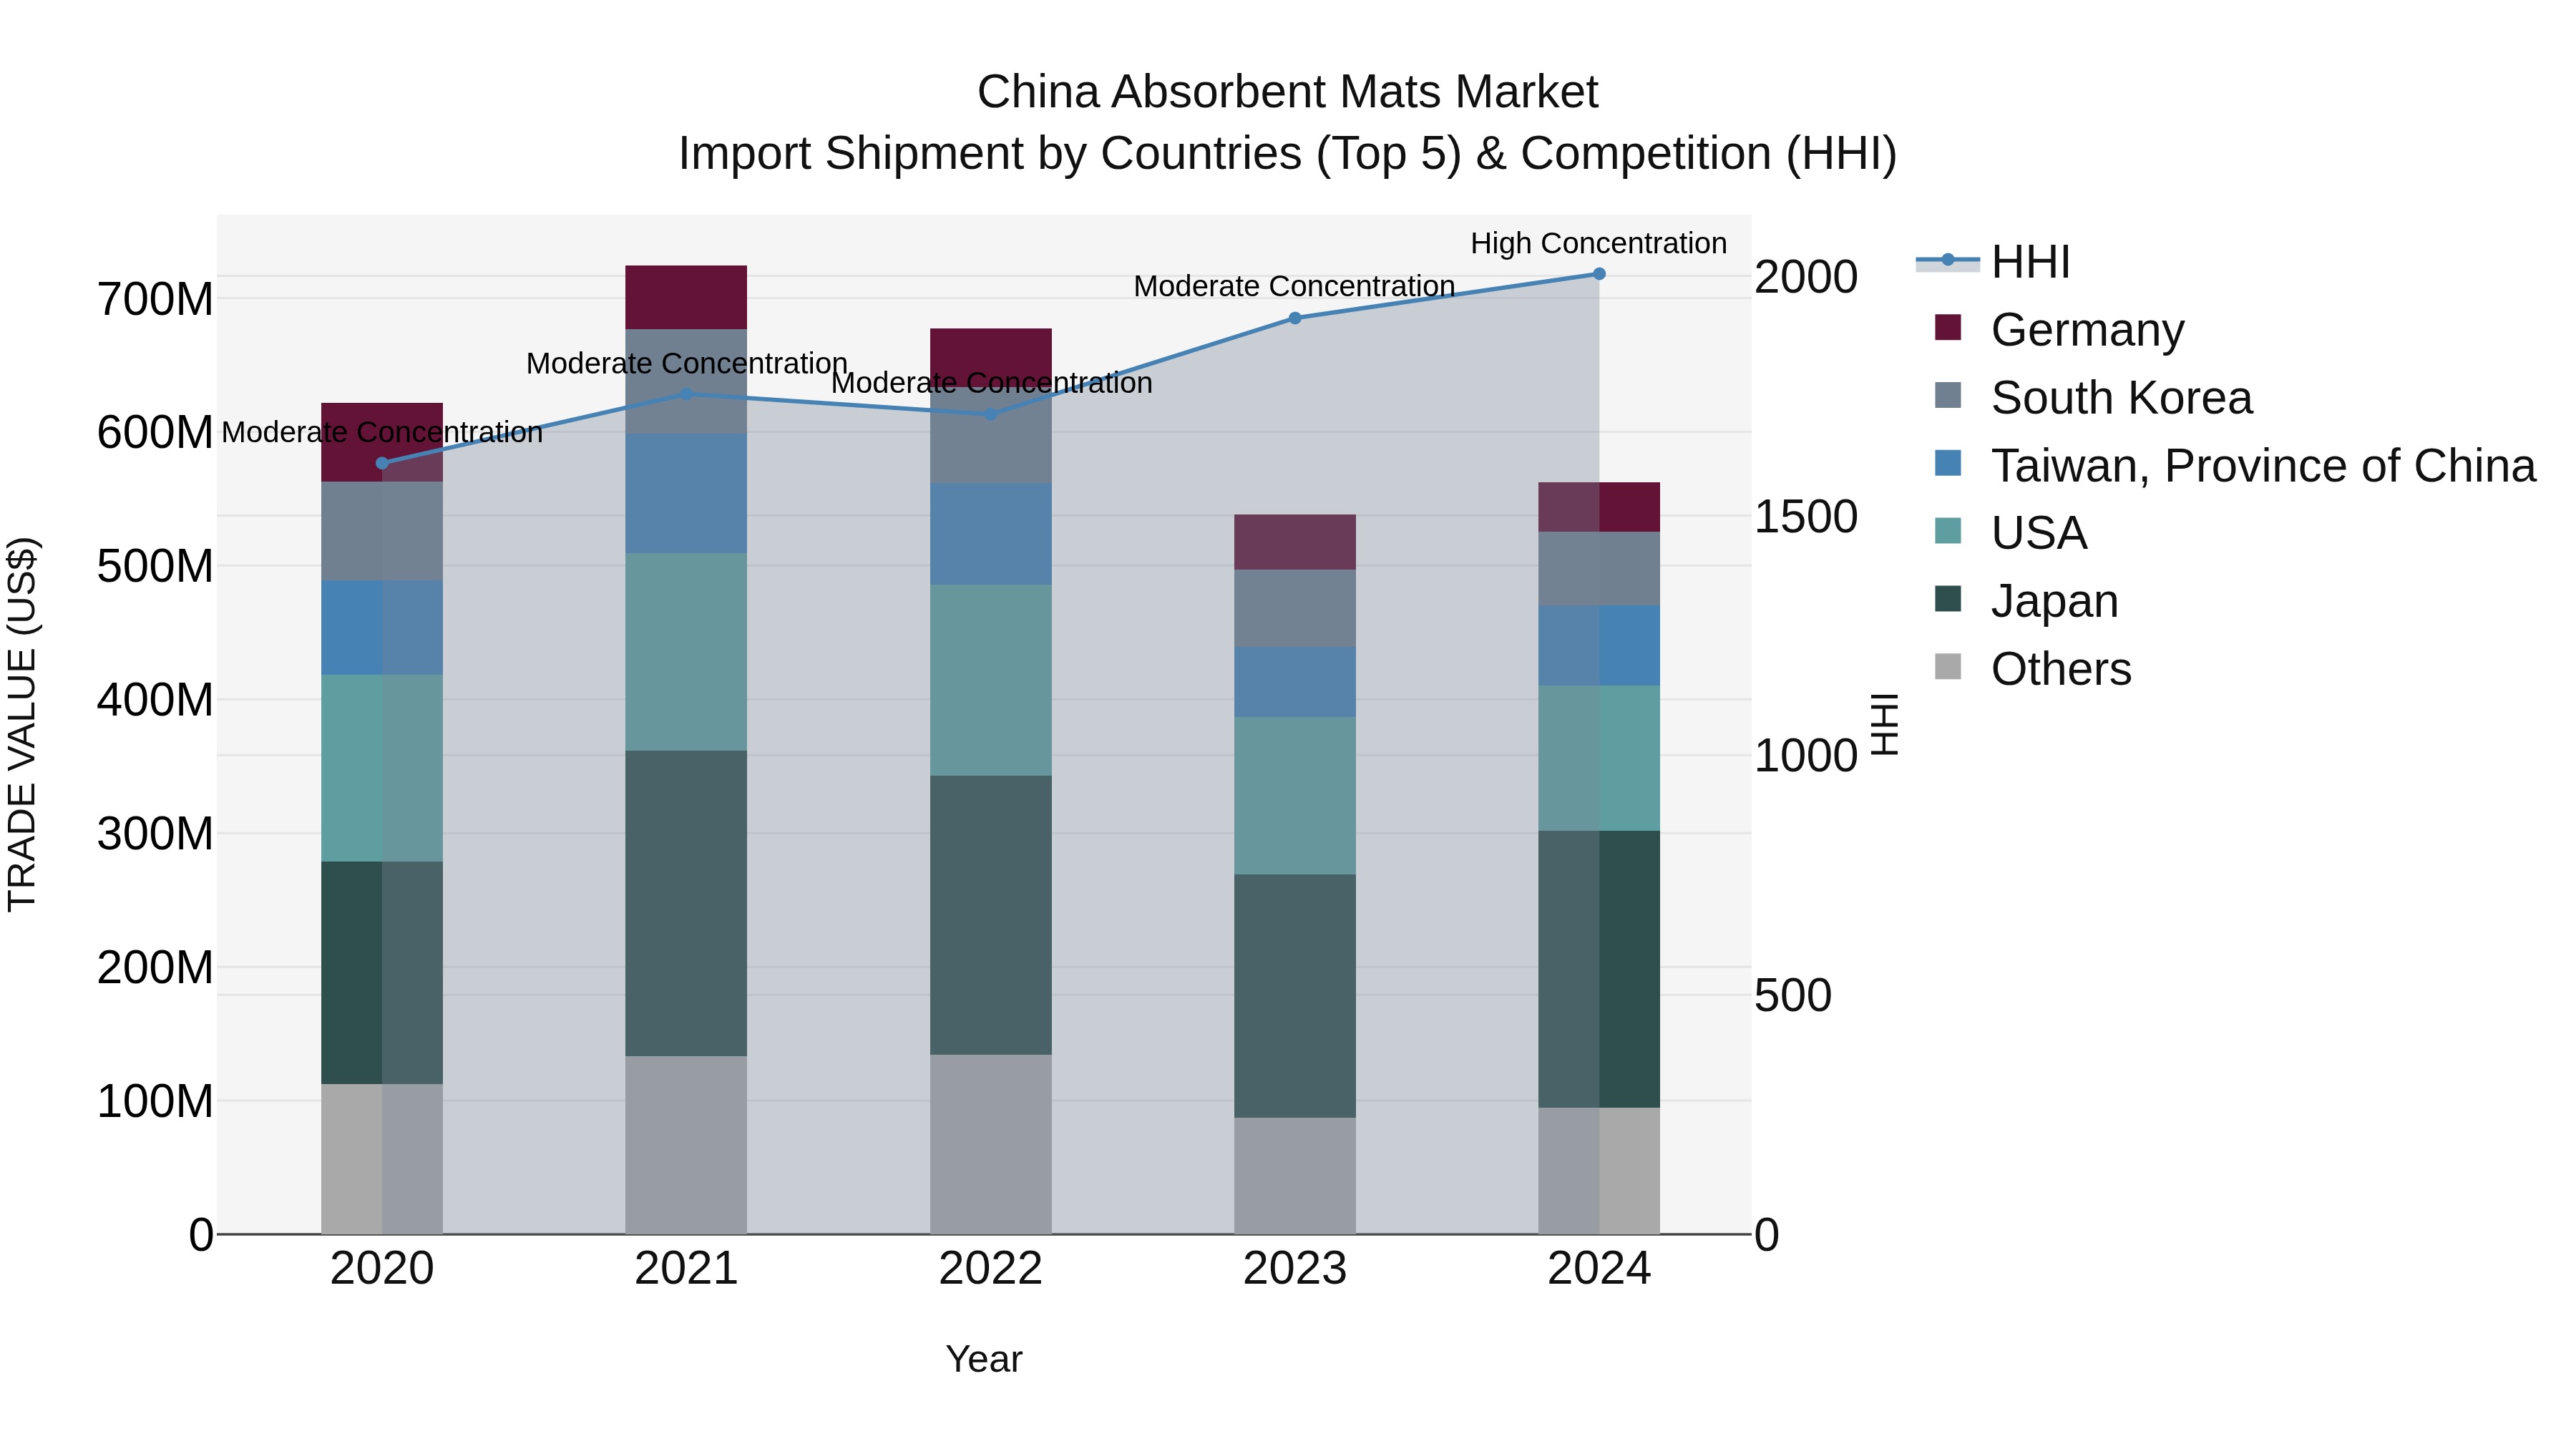
China Absorbent Mats Market Top 5 Importing Countries and Market Competition (HHI) Analysis
China absorbent mats import market saw a shift in concentration levels from moderate to high in 2024, with top exporting countries being Japan, USA, Taiwan, South Korea, and Germany. Despite a negative CAGR of -2.48% from 2020 to 2024, there was a positive growth rate of 4.5% in 2023-24. This indicates a dynamic market landscape with potential opportunities for both domestic and international players looking to capitalize on the growing demand for absorbent mats in China.
Key Highlights of the Report:
- China Absorbent Mats Market Outlook
- Market Size of China Absorbent Mats Market, 2025
- Forecast of China Absorbent Mats Market, 2032
- Historical Data and Forecast of China Absorbent Mats Revenues & Volume for the Period 2022 - 2032
- China Absorbent Mats Market Trend Evolution
- China Absorbent Mats Market Drivers and Challenges
- China Absorbent Mats Price Trends
- China Absorbent Mats Porter's Five Forces
- China Absorbent Mats Industry Life Cycle
- Historical Data and Forecast of China Absorbent Mats Market Revenues & Volume By Material for the Period 2022 - 2032
- Historical Data and Forecast of China Absorbent Mats Market Revenues & Volume By Polypropylene for the Period 2022 - 2032
- Historical Data and Forecast of China Absorbent Mats Market Revenues & Volume By PVC for the Period 2022 - 2032
- Historical Data and Forecast of China Absorbent Mats Market Revenues & Volume By Nitrile for the Period 2022 - 2032
- Historical Data and Forecast of China Absorbent Mats Market Revenues & Volume By Rubber for the Period 2022 - 2032
- Historical Data and Forecast of China Absorbent Mats Market Revenues & Volume By Others for the Period 2022 - 2032
- Historical Data and Forecast of China Absorbent Mats Market Revenues & Volume By Category for the Period 2022 - 2032
- Historical Data and Forecast of China Absorbent Mats Market Revenues & Volume By Grease & Oil Absorbing Mats for the Period 2022 - 2032
- Historical Data and Forecast of China Absorbent Mats Market Revenues & Volume By Chemical Absorbent Mats for the Period 2022 - 2032
- Historical Data and Forecast of China Absorbent Mats Market Revenues & Volume By Universal Absorbent Mats for the Period 2022 - 2032
- Historical Data and Forecast of China Absorbent Mats Market Revenues & Volume By End-user for the Period 2022 - 2032
- Historical Data and Forecast of China Absorbent Mats Market Revenues & Volume By Food & Beverages for the Period 2022 - 2032
- Historical Data and Forecast of China Absorbent Mats Market Revenues & Volume By Automotive for the Period 2022 - 2032
- Historical Data and Forecast of China Absorbent Mats Market Revenues & Volume By Chemicals for the Period 2022 - 2032
- Historical Data and Forecast of China Absorbent Mats Market Revenues & Volume By Oil & Gas for the Period 2022 - 2032
- Historical Data and Forecast of China Absorbent Mats Market Revenues & Volume By Pharmaceuticals for the Period 2022 - 2032
- Historical Data and Forecast of China Absorbent Mats Market Revenues & Volume By Others for the Period 2022 - 2032
- Historical Data and Forecast of China Absorbent Mats Market Revenues & Volume By Price for the Period 2022 - 2032
- Historical Data and Forecast of China Absorbent Mats Market Revenues & Volume By Low for the Period 2022 - 2032
- Historical Data and Forecast of China Absorbent Mats Market Revenues & Volume By Medium for the Period 2022 - 2032
- Historical Data and Forecast of China Absorbent Mats Market Revenues & Volume By High for the Period 2022 - 2032
- Historical Data and Forecast of China Absorbent Mats Market Revenues & Volume By Distribution Channel for the Period 2022 - 2032
- Historical Data and Forecast of China Absorbent Mats Market Revenues & Volume By Direct Sales for the Period 2022 - 2032
- Historical Data and Forecast of China Absorbent Mats Market Revenues & Volume By Indirect Sales for the Period 2022 - 2032
- China Absorbent Mats Import Export Trade Statistics
- Market Opportunity Assessment By Material
- Market Opportunity Assessment By Category
- Market Opportunity Assessment By End-user
- Market Opportunity Assessment By Price
- Market Opportunity Assessment By Distribution Channel
- China Absorbent Mats Top Companies Market Share
- China Absorbent Mats Competitive Benchmarking By Technical and Operational Parameters
- China Absorbent Mats Company Profiles
- China Absorbent Mats Key Strategic Recommendations
Frequently Asked Questions About the Market Study (FAQs):
6Wresearch actively monitors the China Absorbent Mats Market and publishes its comprehensive annual report, highlighting emerging trends, growth drivers, revenue analysis, and forecast outlook. Our insights help businesses to make data-backed strategic decisions with ongoing market dynamics. Our analysts track relevent industries related to the China Absorbent Mats Market, allowing our clients with actionable intelligence and reliable forecasts tailored to emerging regional needs.
Yes, we provide customisation as per your requirements. To learn more, feel free to contact us on sales@6wresearch.com
1 Executive Summary |
2 Introduction |
2.1 Key Highlights of the Report |
2.2 Report Description |
2.3 Market Scope & Segmentation |
2.4 Research Methodology |
2.5 Assumptions |
3 China Absorbent Mats Market Overview |
3.1 China Country Macro Economic Indicators |
3.2 China Absorbent Mats Market Revenues & Volume, 2022 & 2032F |
3.3 China Absorbent Mats Market - Industry Life Cycle |
3.4 China Absorbent Mats Market - Porter's Five Forces |
3.5 China Absorbent Mats Market Revenues & Volume Share, By Material, 2022 & 2032F |
3.6 China Absorbent Mats Market Revenues & Volume Share, By Category, 2022 & 2032F |
3.7 China Absorbent Mats Market Revenues & Volume Share, By End-user, 2022 & 2032F |
3.8 China Absorbent Mats Market Revenues & Volume Share, By Price, 2022 & 2032F |
3.9 China Absorbent Mats Market Revenues & Volume Share, By Distribution Channel, 2022 & 2032F |
4 China Absorbent Mats Market Dynamics |
4.1 Impact Analysis |
4.2 Market Drivers |
4.2.1 Growing awareness about environmental concerns and the need for sustainable solutions |
4.2.2 Increasing industrial activities leading to higher demand for absorbent mats in factories and warehouses |
4.2.3 Stringent regulations promoting the use of absorbent mats for spill containment and pollution prevention |
4.3 Market Restraints |
4.3.1 Fluctuating raw material prices impacting the overall cost of absorbent mats |
4.3.2 Limited availability of advanced technologies for manufacturing high-quality absorbent mats |
4.3.3 Competition from alternative spill containment products such as spill kits and socks |
5 China Absorbent Mats Market Trends |
6 China Absorbent Mats Market, By Types |
6.1 China Absorbent Mats Market, By Material |
6.1.1 Overview and Analysis |
6.1.2 China Absorbent Mats Market Revenues & Volume, By Material, 2022 - 2032F |
6.1.3 China Absorbent Mats Market Revenues & Volume, By Polypropylene, 2022 - 2032F |
6.1.4 China Absorbent Mats Market Revenues & Volume, By PVC, 2022 - 2032F |
6.1.5 China Absorbent Mats Market Revenues & Volume, By Nitrile, 2022 - 2032F |
6.1.6 China Absorbent Mats Market Revenues & Volume, By Rubber, 2022 - 2032F |
6.1.7 China Absorbent Mats Market Revenues & Volume, By Others, 2022 - 2032F |
6.2 China Absorbent Mats Market, By Category |
6.2.1 Overview and Analysis |
6.2.2 China Absorbent Mats Market Revenues & Volume, By Grease & Oil Absorbing Mats, 2022 - 2032F |
6.2.3 China Absorbent Mats Market Revenues & Volume, By Chemical Absorbent Mats, 2022 - 2032F |
6.2.4 China Absorbent Mats Market Revenues & Volume, By Universal Absorbent Mats, 2022 - 2032F |
6.3 China Absorbent Mats Market, By End-user |
6.3.1 Overview and Analysis |
6.3.2 China Absorbent Mats Market Revenues & Volume, By Food & Beverages, 2022 - 2032F |
6.3.3 China Absorbent Mats Market Revenues & Volume, By Automotive, 2022 - 2032F |
6.3.4 China Absorbent Mats Market Revenues & Volume, By Chemicals, 2022 - 2032F |
6.3.5 China Absorbent Mats Market Revenues & Volume, By Oil & Gas, 2022 - 2032F |
6.3.6 China Absorbent Mats Market Revenues & Volume, By Pharmaceuticals, 2022 - 2032F |
6.3.7 China Absorbent Mats Market Revenues & Volume, By Others, 2022 - 2032F |
6.4 China Absorbent Mats Market, By Price |
6.4.1 Overview and Analysis |
6.4.2 China Absorbent Mats Market Revenues & Volume, By Low, 2022 - 2032F |
6.4.3 China Absorbent Mats Market Revenues & Volume, By Medium, 2022 - 2032F |
6.4.4 China Absorbent Mats Market Revenues & Volume, By High, 2022 - 2032F |
6.5 China Absorbent Mats Market, By Distribution Channel |
6.5.1 Overview and Analysis |
6.5.2 China Absorbent Mats Market Revenues & Volume, By Direct Sales, 2022 - 2032F |
6.5.3 China Absorbent Mats Market Revenues & Volume, By Indirect Sales, 2022 - 2032F |
7 China Absorbent Mats Market Import-Export Trade Statistics |
7.1 China Absorbent Mats Market Export to Major Countries |
7.2 China Absorbent Mats Market Imports from Major Countries |
8 China Absorbent Mats Market Key Performance Indicators |
8.1 Adoption rate of eco-friendly absorbent mats in industries |
8.2 Number of new regulations mandating the use of absorbent mats in different sectors |
8.3 Rate of innovation in absorbent mat technology and materials |
8.4 Percentage of market share held by sustainable absorbent mat products |
8.5 Customer satisfaction levels with the performance and durability of absorbent mats |
9 China Absorbent Mats Market - Opportunity Assessment |
9.1 China Absorbent Mats Market Opportunity Assessment, By Material, 2022 & 2032F |
9.2 China Absorbent Mats Market Opportunity Assessment, By Category, 2022 & 2032F |
9.3 China Absorbent Mats Market Opportunity Assessment, By End-user, 2022 & 2032F |
9.4 China Absorbent Mats Market Opportunity Assessment, By Price, 2022 & 2032F |
9.5 China Absorbent Mats Market Opportunity Assessment, By Distribution Channel, 2022 & 2032F |
10 China Absorbent Mats Market - Competitive Landscape |
10.1 China Absorbent Mats Market Revenue Share, By Companies, 2025 |
10.2 China Absorbent Mats Market Competitive Benchmarking, By Operating and Technical Parameters |
11 Company Profiles |
12 Recommendations |
13 Disclaimer |
Global Go To Market Strategy - 2030
Export potential enables firms to identify high-growth global markets with greater confidence by combining advanced trade intelligence with a structured quantitative methodology. The framework analyzes emerging demand trends and country-level import patterns while integrating macroeconomic and trade datasets such as GDP and population forecasts, bilateral import–export flows, tariff structures, elasticity differentials between developed and developing economies, geographic distance, and import demand projections. Using weighted trade values from 2020–2024 as the base period to project country-to-country export potential for 2030, these inputs are operationalized through calculated drivers such as gravity model parameters, tariff impact factors, and projected GDP per-capita growth. Through an analysis of hidden potentials, demand hotspots, and market conditions that are most favorable to success, this method enables firms to focus on target countries, maximize returns, and global expansion with data, backed by accuracy.
By factoring in the projected importer demand gap that is currently unmet and could be potential opportunity, it identifies the potential for the Exporter (Country) among 190 countries, against the general trade analysis, which identifies the biggest importer or exporter.
To discover high-growth global markets and optimize your business strategy:
Click Here
Pricing
- Single User License$ 1,995
- Department License$ 2,400
- Site License$ 3,120
- Global License$ 3,795

Leadership Perspectives from Industry Events
Search
Thought Leadership and Analyst Meet


Our Clients
6WResearch In News
- ADAS in India: How Automatic Emergency Braking, Blind Spot Detection & Driver Monitoring are Transforming Road Safety
- Doha a strategic location for EV manufacturing hub: IPA Qatar
- Demand for luxury TVs surging in the GCC, says Samsung
- Empowering Growth: The Thriving Journey of Bangladesh’s Cable Industry
- Demand for luxury TVs surging in the GCC, says Samsung
- Video call with a traditional healer? Once unthinkable, it’s now common in South Africa
Latest Reports
- Poland Fire Protection Systems Market (2026-2032)
- Cape Verde Portable Hand-Thrown Extinguisher Market (2026-2032)
- Canada Portable Hand-Thrown Extinguisher Market (2026-2032)
- Cameroon Portable Hand-Thrown Extinguisher Market (2026-2032)
- Burundi Portable Hand-Thrown Extinguisher Market (2026-2032)
- Burkina Faso Portable Hand-Thrown Extinguisher Market (2026-2032)
- Bulgaria Portable Hand-Thrown Extinguisher Market (2026-2032)
- Brunei Portable Hand-Thrown Extinguisher Market (2026-2032)
- Botswana Portable Hand-Thrown Extinguisher Market (2026-2032)
- Bosnia and Herzegovina Portable Hand-Thrown Extinguisher Market (2026-2032)
Industry Events and Analyst Meet

HIMTEX 2026

India Refining Summit 2026

India EV Show 2026

EV tech India Expo 2026

Auto Tech Asia 2026
Whitepaper
- Middle East & Africa Commercial Security Market Click here to view more.
- Middle East & Africa Fire Safety Systems & Equipment Market Click here to view more.
- GCC Drone Market Click here to view more.
- Middle East Lighting Fixture Market Click here to view more.
- GCC Physical & Perimeter Security Market Click here to view more.