China Coffee and Tea Manufacturing Market (2026-2032) | Analysis, Segmentation, Forecast, Industry, Share, Size & Revenue, Companies, Competitive Landscape, Growth, Value, Trends, Outlook
Market Forecast By Type (Coffee, Tea), By Distribution Channel (Supermarkets/Hypermarkets, Convenience Stores, E-Commerce, Others), By Form (Liquid, Powder, Capsules), By Packaging (Containers, Bags, Packets, Pouches) And Competitive Landscape
| Product Code: ETC6739907 | Publication Date: Sep 2024 | Updated Date: Apr 2026 | Product Type: Market Research Report | |
| Publisher: 6Wresearch | Author: Vasudha | No. of Pages: 75 | No. of Figures: 35 | No. of Tables: 20 |
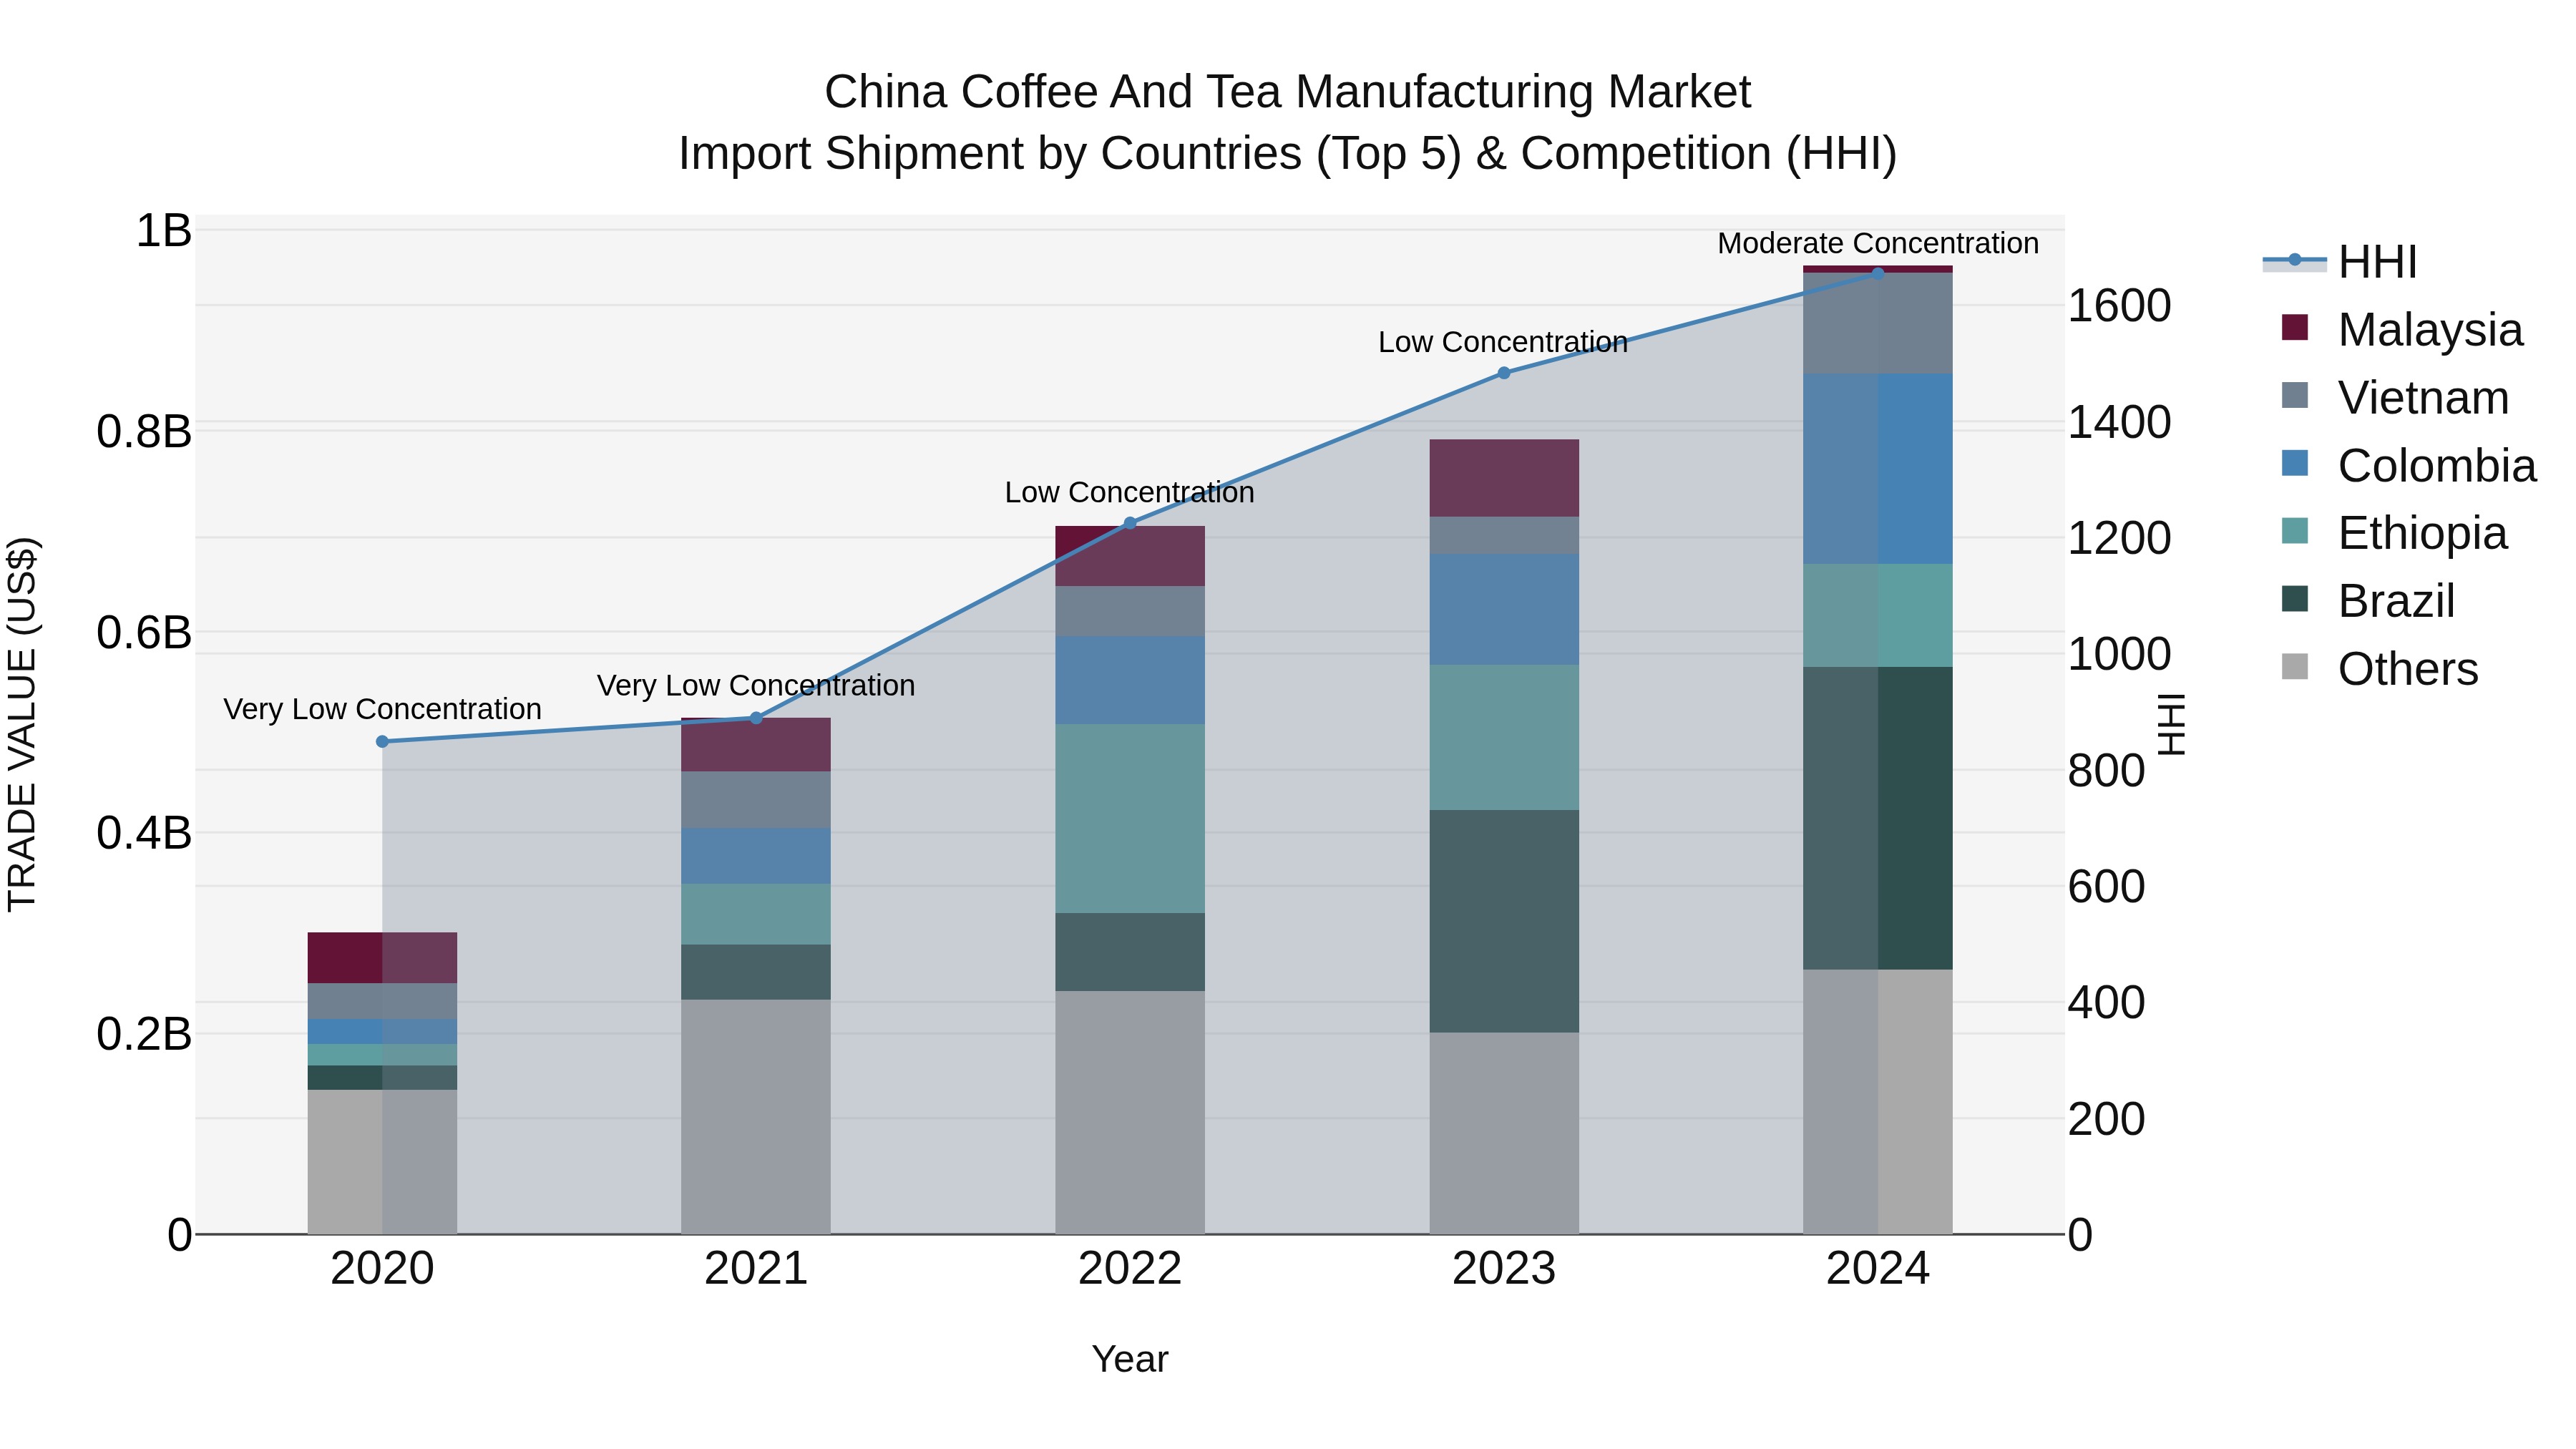
China Coffee and Tea Manufacturing Market Top 5 Importing Countries and Market Competition (HHI) Analysis
China coffee and tea manufacturing import shipments saw a notable shift in concentration levels from low to moderate in 2024, reflecting a more balanced market share among top exporting countries. Brazil, Colombia, Ethiopia, Vietnam, and Indonesia emerged as key players, driving the impressive 33.79% CAGR between 2020-24. The sector`s growth momentum remained strong in 2024 with a growth rate of 21.84% compared to the previous year, indicating sustained interest and demand for coffee and tea products in the Chinese market.
Key Highlights of the Report:
- China Coffee and Tea Manufacturing Market Outlook
- Market Size of China Coffee and Tea Manufacturing Market, 2025
- Forecast of China Coffee and Tea Manufacturing Market, 2032
- Historical Data and Forecast of China Coffee and Tea Manufacturing Revenues & Volume for the Period 2022 - 2032
- China Coffee and Tea Manufacturing Market Trend Evolution
- China Coffee and Tea Manufacturing Market Drivers and Challenges
- China Coffee and Tea Manufacturing Price Trends
- China Coffee and Tea Manufacturing Porter's Five Forces
- China Coffee and Tea Manufacturing Industry Life Cycle
- Historical Data and Forecast of China Coffee and Tea Manufacturing Market Revenues & Volume By Type for the Period 2022 - 2032
- Historical Data and Forecast of China Coffee and Tea Manufacturing Market Revenues & Volume By Coffee for the Period 2022 - 2032
- Historical Data and Forecast of China Coffee and Tea Manufacturing Market Revenues & Volume By Tea for the Period 2022 - 2032
- Historical Data and Forecast of China Coffee and Tea Manufacturing Market Revenues & Volume By Distribution Channel for the Period 2022 - 2032
- Historical Data and Forecast of China Coffee and Tea Manufacturing Market Revenues & Volume By Supermarkets/Hypermarkets for the Period 2022 - 2032
- Historical Data and Forecast of China Coffee and Tea Manufacturing Market Revenues & Volume By Convenience Stores for the Period 2022 - 2032
- Historical Data and Forecast of China Coffee and Tea Manufacturing Market Revenues & Volume By E-Commerce for the Period 2022 - 2032
- Historical Data and Forecast of China Coffee and Tea Manufacturing Market Revenues & Volume By Others for the Period 2022 - 2032
- Historical Data and Forecast of China Coffee and Tea Manufacturing Market Revenues & Volume By Form for the Period 2022 - 2032
- Historical Data and Forecast of China Coffee and Tea Manufacturing Market Revenues & Volume By Liquid for the Period 2022 - 2032
- Historical Data and Forecast of China Coffee and Tea Manufacturing Market Revenues & Volume By Powder for the Period 2022 - 2032
- Historical Data and Forecast of China Coffee and Tea Manufacturing Market Revenues & Volume By Capsules for the Period 2022 - 2032
- Historical Data and Forecast of China Coffee and Tea Manufacturing Market Revenues & Volume By Packaging for the Period 2022 - 2032
- Historical Data and Forecast of China Coffee and Tea Manufacturing Market Revenues & Volume By Containers for the Period 2022 - 2032
- Historical Data and Forecast of China Coffee and Tea Manufacturing Market Revenues & Volume By Bags for the Period 2022 - 2032
- Historical Data and Forecast of China Coffee and Tea Manufacturing Market Revenues & Volume By Packets for the Period 2022 - 2032
- Historical Data and Forecast of China Coffee and Tea Manufacturing Market Revenues & Volume By Pouches for the Period 2022 - 2032
- China Coffee and Tea Manufacturing Import Export Trade Statistics
- Market Opportunity Assessment By Type
- Market Opportunity Assessment By Distribution Channel
- Market Opportunity Assessment By Form
- Market Opportunity Assessment By Packaging
- China Coffee and Tea Manufacturing Top Companies Market Share
- China Coffee and Tea Manufacturing Competitive Benchmarking By Technical and Operational Parameters
- China Coffee and Tea Manufacturing Company Profiles
- China Coffee and Tea Manufacturing Key Strategic Recommendations
Frequently Asked Questions About the Market Study (FAQs):
6Wresearch actively monitors the China Coffee and Tea Manufacturing Market and publishes its comprehensive annual report, highlighting emerging trends, growth drivers, revenue analysis, and forecast outlook. Our insights help businesses to make data-backed strategic decisions with ongoing market dynamics. Our analysts track relevent industries related to the China Coffee and Tea Manufacturing Market, allowing our clients with actionable intelligence and reliable forecasts tailored to emerging regional needs.
Yes, we provide customisation as per your requirements. To learn more, feel free to contact us on sales@6wresearch.com
1 Executive Summary |
2 Introduction |
2.1 Key Highlights of the Report |
2.2 Report Description |
2.3 Market Scope & Segmentation |
2.4 Research Methodology |
2.5 Assumptions |
3 China Coffee and Tea Manufacturing Market Overview |
3.1 China Country Macro Economic Indicators |
3.2 China Coffee and Tea Manufacturing Market Revenues & Volume, 2022 & 2032F |
3.3 China Coffee and Tea Manufacturing Market - Industry Life Cycle |
3.4 China Coffee and Tea Manufacturing Market - Porter's Five Forces |
3.5 China Coffee and Tea Manufacturing Market Revenues & Volume Share, By Type, 2022 & 2032F |
3.6 China Coffee and Tea Manufacturing Market Revenues & Volume Share, By Distribution Channel, 2022 & 2032F |
3.7 China Coffee and Tea Manufacturing Market Revenues & Volume Share, By Form, 2022 & 2032F |
3.8 China Coffee and Tea Manufacturing Market Revenues & Volume Share, By Packaging, 2022 & 2032F |
4 China Coffee and Tea Manufacturing Market Dynamics |
4.1 Impact Analysis |
4.2 Market Drivers |
4.2.1 Increasing health consciousness among consumers leading to higher demand for specialty teas and herbal beverages. |
4.2.2 Rising disposable income levels in China driving the consumption of premium coffee and tea products. |
4.2.3 Growing popularity of coffee shop culture and tea ceremonies, boosting the demand for high-quality coffee and tea products. |
4.3 Market Restraints |
4.3.1 Fluctuating raw material prices such as coffee beans and tea leaves impacting production costs. |
4.3.2 Intense competition among coffee and tea manufacturers leading to pricing pressure. |
4.3.3 Regulatory challenges and compliance requirements affecting the manufacturing processes in the industry. |
5 China Coffee and Tea Manufacturing Market Trends |
6 China Coffee and Tea Manufacturing Market, By Types |
6.1 China Coffee and Tea Manufacturing Market, By Type |
6.1.1 Overview and Analysis |
6.1.2 China Coffee and Tea Manufacturing Market Revenues & Volume, By Type, 2022 - 2032F |
6.1.3 China Coffee and Tea Manufacturing Market Revenues & Volume, By Coffee, 2022 - 2032F |
6.1.4 China Coffee and Tea Manufacturing Market Revenues & Volume, By Tea, 2022 - 2032F |
6.2 China Coffee and Tea Manufacturing Market, By Distribution Channel |
6.2.1 Overview and Analysis |
6.2.2 China Coffee and Tea Manufacturing Market Revenues & Volume, By Supermarkets/Hypermarkets, 2022 - 2032F |
6.2.3 China Coffee and Tea Manufacturing Market Revenues & Volume, By Convenience Stores, 2022 - 2032F |
6.2.4 China Coffee and Tea Manufacturing Market Revenues & Volume, By E-Commerce, 2022 - 2032F |
6.2.5 China Coffee and Tea Manufacturing Market Revenues & Volume, By Others, 2022 - 2032F |
6.3 China Coffee and Tea Manufacturing Market, By Form |
6.3.1 Overview and Analysis |
6.3.2 China Coffee and Tea Manufacturing Market Revenues & Volume, By Liquid, 2022 - 2032F |
6.3.3 China Coffee and Tea Manufacturing Market Revenues & Volume, By Powder, 2022 - 2032F |
6.3.4 China Coffee and Tea Manufacturing Market Revenues & Volume, By Capsules, 2022 - 2032F |
6.4 China Coffee and Tea Manufacturing Market, By Packaging |
6.4.1 Overview and Analysis |
6.4.2 China Coffee and Tea Manufacturing Market Revenues & Volume, By Containers, 2022 - 2032F |
6.4.3 China Coffee and Tea Manufacturing Market Revenues & Volume, By Bags, 2022 - 2032F |
6.4.4 China Coffee and Tea Manufacturing Market Revenues & Volume, By Packets, 2022 - 2032F |
6.4.5 China Coffee and Tea Manufacturing Market Revenues & Volume, By Pouches, 2022 - 2032F |
7 China Coffee and Tea Manufacturing Market Import-Export Trade Statistics |
7.1 China Coffee and Tea Manufacturing Market Export to Major Countries |
7.2 China Coffee and Tea Manufacturing Market Imports from Major Countries |
8 China Coffee and Tea Manufacturing Market Key Performance Indicators |
8.1 Average selling price per unit of coffee and tea products. |
8.2 Percentage of revenue from new product launches indicating innovation and market responsiveness. |
8.3 Customer satisfaction scores reflecting the quality of products and brand loyalty. |
8.4 Percentage of market share in specific segments or regions showing growth and market penetration. |
8.5 Number of partnerships or collaborations with suppliers or distributors to expand market reach and distribution channels. |
9 China Coffee and Tea Manufacturing Market - Opportunity Assessment |
9.1 China Coffee and Tea Manufacturing Market Opportunity Assessment, By Type, 2022 & 2032F |
9.2 China Coffee and Tea Manufacturing Market Opportunity Assessment, By Distribution Channel, 2022 & 2032F |
9.3 China Coffee and Tea Manufacturing Market Opportunity Assessment, By Form, 2022 & 2032F |
9.4 China Coffee and Tea Manufacturing Market Opportunity Assessment, By Packaging, 2022 & 2032F |
10 China Coffee and Tea Manufacturing Market - Competitive Landscape |
10.1 China Coffee and Tea Manufacturing Market Revenue Share, By Companies, 2025 |
10.2 China Coffee and Tea Manufacturing Market Competitive Benchmarking, By Operating and Technical Parameters |
11 Company Profiles |
12 Recommendations |
13 Disclaimer |
Global Go To Market Strategy - 2030
Export potential enables firms to identify high-growth global markets with greater confidence by combining advanced trade intelligence with a structured quantitative methodology. The framework analyzes emerging demand trends and country-level import patterns while integrating macroeconomic and trade datasets such as GDP and population forecasts, bilateral import–export flows, tariff structures, elasticity differentials between developed and developing economies, geographic distance, and import demand projections. Using weighted trade values from 2020–2024 as the base period to project country-to-country export potential for 2030, these inputs are operationalized through calculated drivers such as gravity model parameters, tariff impact factors, and projected GDP per-capita growth. Through an analysis of hidden potentials, demand hotspots, and market conditions that are most favorable to success, this method enables firms to focus on target countries, maximize returns, and global expansion with data, backed by accuracy.
By factoring in the projected importer demand gap that is currently unmet and could be potential opportunity, it identifies the potential for the Exporter (Country) among 190 countries, against the general trade analysis, which identifies the biggest importer or exporter.
To discover high-growth global markets and optimize your business strategy:
Click Here
Pricing
- Single User License$ 1,995
- Department License$ 2,400
- Site License$ 3,120
- Global License$ 3,795

Leadership Perspectives from Industry Events
Search
Thought Leadership and Analyst Meet


Our Clients
6WResearch In News
- Doha a strategic location for EV manufacturing hub: IPA Qatar
- Demand for luxury TVs surging in the GCC, says Samsung
- Empowering Growth: The Thriving Journey of Bangladesh’s Cable Industry
- Demand for luxury TVs surging in the GCC, says Samsung
- Video call with a traditional healer? Once unthinkable, it’s now common in South Africa
- Intelligent Buildings To Smooth GCC’s Path To Net Zero
Latest Reports
- New Zealand Aseptic Manufacturing Market (2026-2032)
- Netherlands Aseptic Manufacturing Market (2026-2032)
- Nauru Aseptic Manufacturing Market (2026-2032)
- Namibia Aseptic Manufacturing Market (2026-2032)
- Mozambique Aseptic Manufacturing Market (2026-2032)
- Montenegro Aseptic Manufacturing Market (2026-2032)
- Mongolia Aseptic Manufacturing Market (2026-2032)
- Monaco Aseptic Manufacturing Market (2026-2032)
- Micronesia Aseptic Manufacturing Market (2026-2032)
- Mauritius Aseptic Manufacturing Market (2026-2032)
Industry Events and Analyst Meet

HIMTEX 2026

India Refining Summit 2026

India EV Show 2026

EV tech India Expo 2026

Auto Tech Asia 2026
Whitepaper
- Middle East & Africa Commercial Security Market Click here to view more.
- Middle East & Africa Fire Safety Systems & Equipment Market Click here to view more.
- GCC Drone Market Click here to view more.
- Middle East Lighting Fixture Market Click here to view more.
- GCC Physical & Perimeter Security Market Click here to view more.