Croatia AR and VR Smart Glasses Market (2026-2032) | Trends, Analysis, Forecast, Competitive Landscape, Share, Size & Revenue, Growth, Value, Companies, Segmentation, Outlook, Industry
Market Forecast By Type (Optical See Through, Video See Through), By End Use (Gaming Industry, Healthcare, Education, Military and Defense, Others) And Competitive Landscape
| Product Code: ETC6843667 | Publication Date: Sep 2024 | Updated Date: Apr 2026 | Product Type: Market Research Report | |
| Publisher: 6Wresearch | Author: Sumit Sagar | No. of Pages: 75 | No. of Figures: 35 | No. of Tables: 20 |
Croatia Ar And Vr Smart Glasses Market Size (2020-2030)
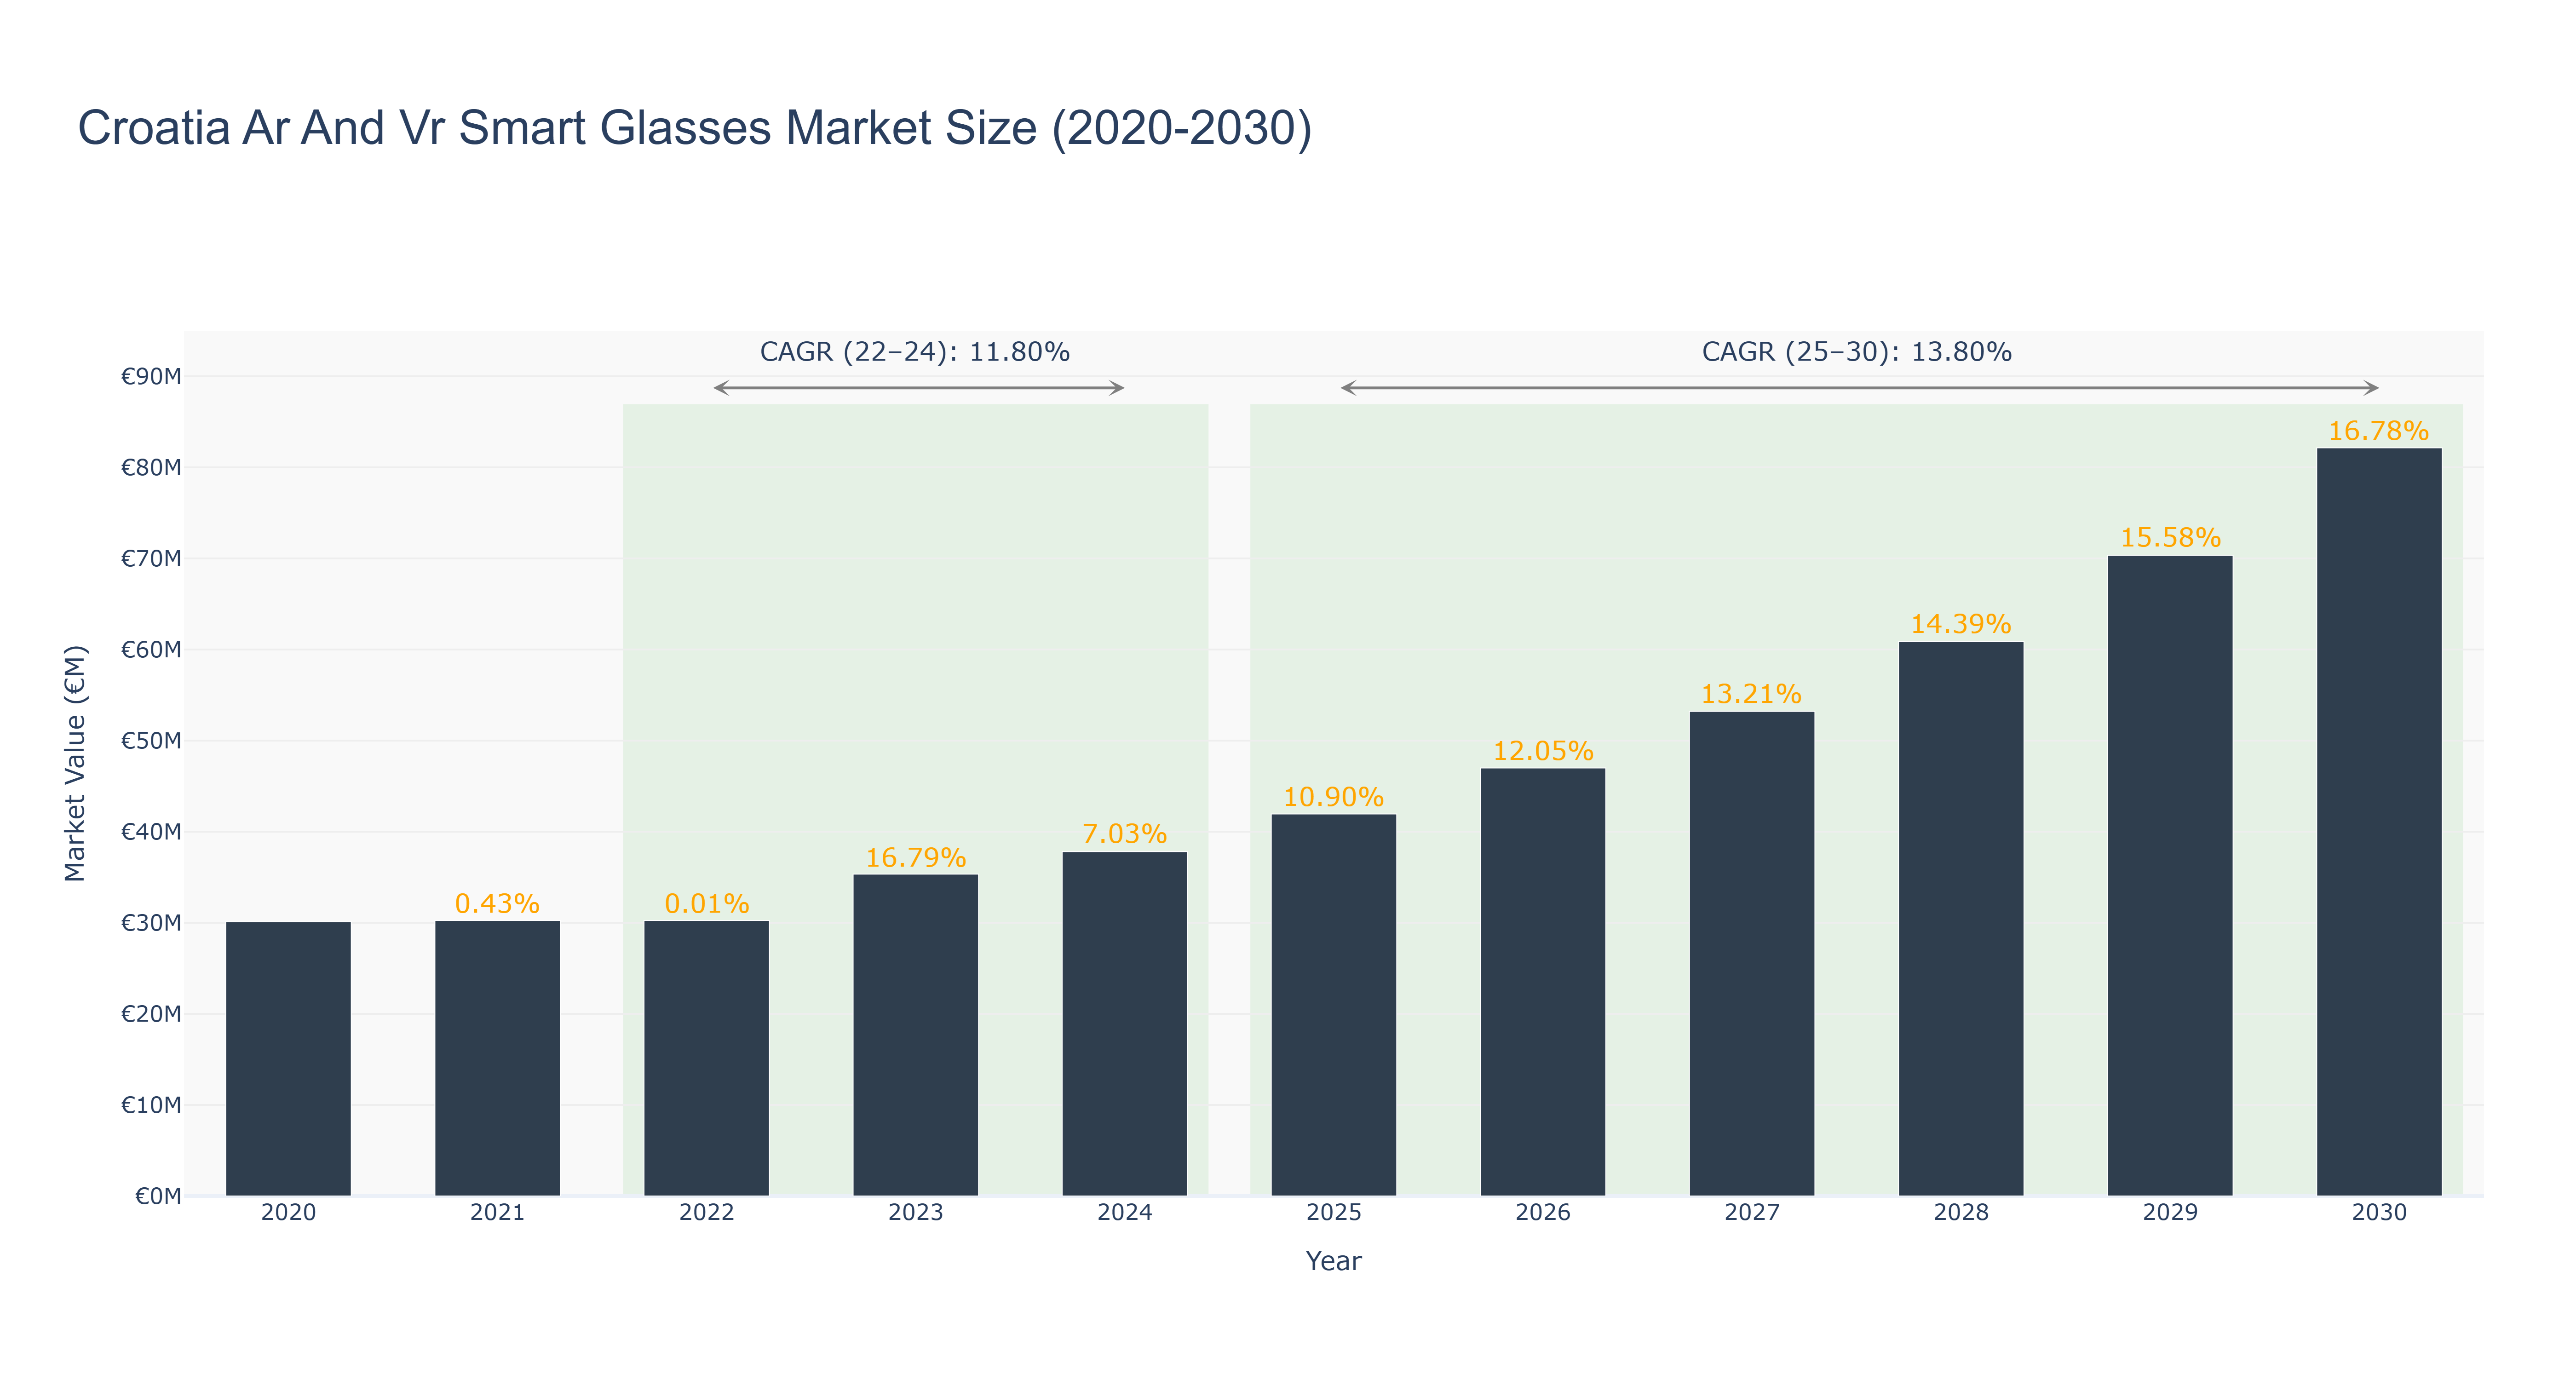
The Croatia AR and VR Smart Glasses Market has shown a steady growth trajectory over the years. The peak market size is expected to reach in 2030 at €82.16 million. From 2020 to 2024, the market size increased from €30.13 million to €37.82 million, with a notable growth rate of 7.03% in 2024. Looking ahead, the forecasted market size from 2025 to 2030 is expected to grow further, with a CAGR of 13.80%. The market saw a significant CAGR of 11.80% from 2022 to 2024. This growth can be attributed to the increasing demand for AR and VR technologies in various industries, driving innovation and enhancing user experiences. In the near future, Croatia is set to launch a national initiative promoting the adoption of AR and VR technologies in education, further boosting market growth and technological advancements.
Croatia Ar And Vr Smart Glasses Market: Production & Trade Performance (2019-2025)
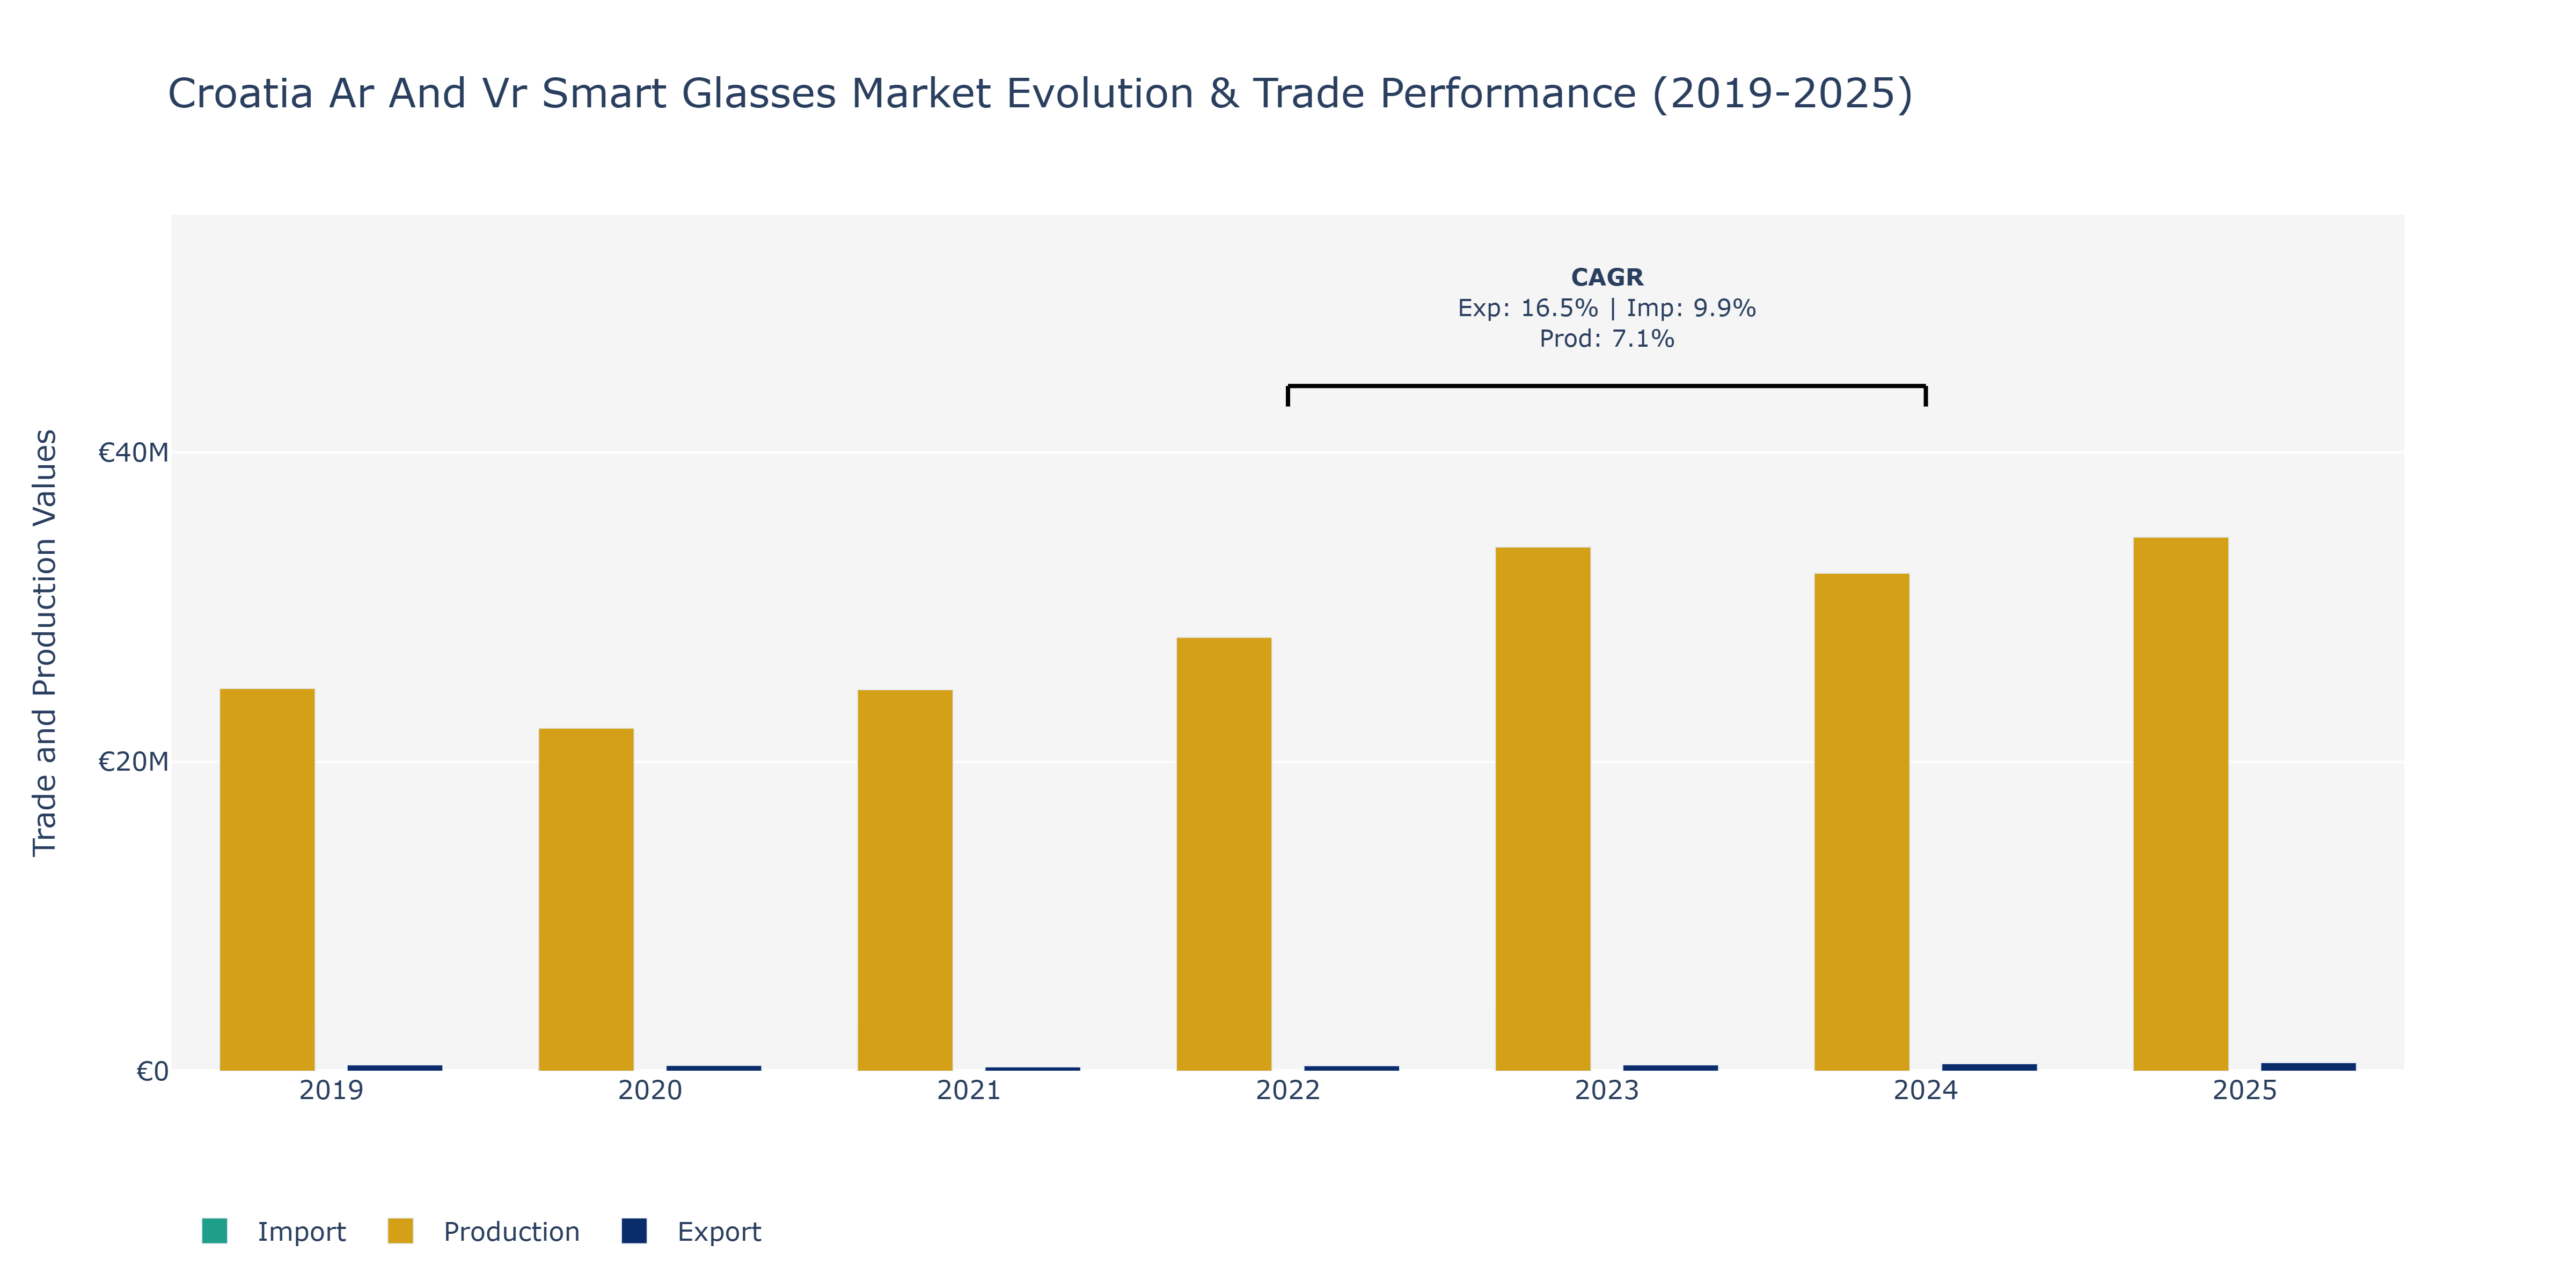
In the Croatia AR and VR smart glasses market, exports experienced fluctuations over the years, starting at €405.68 thousand in 2019, dropping to €282.32 thousand in 2021, and then showing a steady increase to €552.79 thousand in 2025. This growth can be attributed to the continuous innovation in AR and VR technologies, driving demand globally. Imports, on the other hand, saw a consistent upward trend, increasing from €3.05 million in 2019 to €5.02 million in 2025. This rise could be a result of Croatia's increasing adoption of AR and VR solutions, necessitating higher import volumes to meet market demands. Production levels peaked in 2023 at €33.88 billion before declining to €34.52 billion in 2025. This drop may indicate market saturation or increased competition leading to pricing pressures, encouraging companies to explore new innovative solutions to maintain growth in the AR and VR smart glasses market.
Key Highlights of the Report:
- Croatia AR and VR Smart Glasses Market Outlook
- Market Size of Croatia AR and VR Smart Glasses Market, 2025
- Forecast of Croatia AR and VR Smart Glasses Market, 2032
- Historical Data and Forecast of Croatia AR and VR Smart Glasses Revenues & Volume for the Period 2022 - 2032
- Croatia AR and VR Smart Glasses Market Trend Evolution
- Croatia AR and VR Smart Glasses Market Drivers and Challenges
- Croatia AR and VR Smart Glasses Price Trends
- Croatia AR and VR Smart Glasses Porter's Five Forces
- Croatia AR and VR Smart Glasses Industry Life Cycle
- Historical Data and Forecast of Croatia AR and VR Smart Glasses Market Revenues & Volume By Type for the Period 2022 - 2032
- Historical Data and Forecast of Croatia AR and VR Smart Glasses Market Revenues & Volume By Optical See Through for the Period 2022 - 2032
- Historical Data and Forecast of Croatia AR and VR Smart Glasses Market Revenues & Volume By Video See Through for the Period 2022 - 2032
- Historical Data and Forecast of Croatia AR and VR Smart Glasses Market Revenues & Volume By End Use for the Period 2022 - 2032
- Historical Data and Forecast of Croatia AR and VR Smart Glasses Market Revenues & Volume By Gaming Industry for the Period 2022 - 2032
- Historical Data and Forecast of Croatia AR and VR Smart Glasses Market Revenues & Volume By Healthcare for the Period 2022 - 2032
- Historical Data and Forecast of Croatia AR and VR Smart Glasses Market Revenues & Volume By Education for the Period 2022 - 2032
- Historical Data and Forecast of Croatia AR and VR Smart Glasses Market Revenues & Volume By Military and Defense for the Period 2022 - 2032
- Historical Data and Forecast of Croatia AR and VR Smart Glasses Market Revenues & Volume By Others for the Period 2022 - 2032
- Croatia AR and VR Smart Glasses Import Export Trade Statistics
- Market Opportunity Assessment By Type
- Market Opportunity Assessment By End Use
- Croatia AR and VR Smart Glasses Top Companies Market Share
- Croatia AR and VR Smart Glasses Competitive Benchmarking By Technical and Operational Parameters
- Croatia AR and VR Smart Glasses Company Profiles
- Croatia AR and VR Smart Glasses Key Strategic Recommendations
Frequently Asked Questions About the Market Study (FAQs):
6Wresearch actively monitors the Croatia AR and VR Smart Glasses Market and publishes its comprehensive annual report, highlighting emerging trends, growth drivers, revenue analysis, and forecast outlook. Our insights help businesses to make data-backed strategic decisions with ongoing market dynamics. Our analysts track relevent industries related to the Croatia AR and VR Smart Glasses Market, allowing our clients with actionable intelligence and reliable forecasts tailored to emerging regional needs.
Yes, we provide customisation as per your requirements. To learn more, feel free to contact us on sales@6wresearch.com
1 Executive Summary |
2 Introduction |
2.1 Key Highlights of the Report |
2.2 Report Description |
2.3 Market Scope & Segmentation |
2.4 Research Methodology |
2.5 Assumptions |
3 Croatia AR and VR Smart Glasses Market Overview |
3.1 Croatia Country Macro Economic Indicators |
3.2 Croatia AR and VR Smart Glasses Market Revenues & Volume, 2022 & 2032F |
3.3 Croatia AR and VR Smart Glasses Market - Industry Life Cycle |
3.4 Croatia AR and VR Smart Glasses Market - Porter's Five Forces |
3.5 Croatia AR and VR Smart Glasses Market Revenues & Volume Share, By Type, 2022 & 2032F |
3.6 Croatia AR and VR Smart Glasses Market Revenues & Volume Share, By End Use, 2022 & 2032F |
4 Croatia AR and VR Smart Glasses Market Dynamics |
4.1 Impact Analysis |
4.2 Market Drivers |
4.2.1 Increasing adoption of augmented reality (AR) and virtual reality (VR) technologies in various industries in Croatia |
4.2.2 Rising demand for innovative and immersive technologies for entertainment and gaming purposes |
4.2.3 Growing investments in research and development activities to enhance AR and VR smart glasses technology |
4.3 Market Restraints |
4.3.1 High initial costs associated with AR and VR smart glasses |
4.3.2 Limited awareness and understanding of AR and VR technology among consumers in Croatia |
4.3.3 Concerns regarding data privacy and security issues related to the use of AR and VR smart glasses |
5 Croatia AR and VR Smart Glasses Market Trends |
6 Croatia AR and VR Smart Glasses Market, By Types |
6.1 Croatia AR and VR Smart Glasses Market, By Type |
6.1.1 Overview and Analysis |
6.1.2 Croatia AR and VR Smart Glasses Market Revenues & Volume, By Type, 2022 - 2032F |
6.1.3 Croatia AR and VR Smart Glasses Market Revenues & Volume, By Optical See Through, 2022 - 2032F |
6.1.4 Croatia AR and VR Smart Glasses Market Revenues & Volume, By Video See Through, 2022 - 2032F |
6.2 Croatia AR and VR Smart Glasses Market, By End Use |
6.2.1 Overview and Analysis |
6.2.2 Croatia AR and VR Smart Glasses Market Revenues & Volume, By Gaming Industry, 2022 - 2032F |
6.2.3 Croatia AR and VR Smart Glasses Market Revenues & Volume, By Healthcare, 2022 - 2032F |
6.2.4 Croatia AR and VR Smart Glasses Market Revenues & Volume, By Education, 2022 - 2032F |
6.2.5 Croatia AR and VR Smart Glasses Market Revenues & Volume, By Military and Defense, 2022 - 2032F |
6.2.6 Croatia AR and VR Smart Glasses Market Revenues & Volume, By Others, 2022 - 2032F |
7 Croatia AR and VR Smart Glasses Market Import-Export Trade Statistics |
7.1 Croatia AR and VR Smart Glasses Market Export to Major Countries |
7.2 Croatia AR and VR Smart Glasses Market Imports from Major Countries |
8 Croatia AR and VR Smart Glasses Market Key Performance Indicators |
8.1 Average session duration of AR and VR applications in Croatia |
8.2 Number of AR and VR developers and content creators in the market |
8.3 Percentage of businesses in Croatia using AR and VR technology for training and simulation purposes |
9 Croatia AR and VR Smart Glasses Market - Opportunity Assessment |
9.1 Croatia AR and VR Smart Glasses Market Opportunity Assessment, By Type, 2022 & 2032F |
9.2 Croatia AR and VR Smart Glasses Market Opportunity Assessment, By End Use, 2022 & 2032F |
10 Croatia AR and VR Smart Glasses Market - Competitive Landscape |
10.1 Croatia AR and VR Smart Glasses Market Revenue Share, By Companies, 2025 |
10.2 Croatia AR and VR Smart Glasses Market Competitive Benchmarking, By Operating and Technical Parameters |
11 Company Profiles |
12 Recommendations |
13 Disclaimer |
Global Go To Market Strategy - 2030
Export potential enables firms to identify high-growth global markets with greater confidence by combining advanced trade intelligence with a structured quantitative methodology. The framework analyzes emerging demand trends and country-level import patterns while integrating macroeconomic and trade datasets such as GDP and population forecasts, bilateral import–export flows, tariff structures, elasticity differentials between developed and developing economies, geographic distance, and import demand projections. Using weighted trade values from 2020–2024 as the base period to project country-to-country export potential for 2030, these inputs are operationalized through calculated drivers such as gravity model parameters, tariff impact factors, and projected GDP per-capita growth. Through an analysis of hidden potentials, demand hotspots, and market conditions that are most favorable to success, this method enables firms to focus on target countries, maximize returns, and global expansion with data, backed by accuracy.
By factoring in the projected importer demand gap that is currently unmet and could be potential opportunity, it identifies the potential for the Exporter (Country) among 190 countries, against the general trade analysis, which identifies the biggest importer or exporter.
To discover high-growth global markets and optimize your business strategy:
Click Here
Pricing
- Single User License$ 1,995
- Department License$ 2,400
- Site License$ 3,120
- Global License$ 3,795

Leadership Perspectives from Industry Events
Search
Thought Leadership and Analyst Meet


Our Clients
6WResearch In News
- India Export Attractiveness Tracker 2026
- India Air Conditioner Market Set for Strong Rebound in 2026 After Weather-Led Correction and GST-Driven Recovery: 6Wresearch
- ADAS in India: How Automatic Emergency Braking, Blind Spot Detection & Driver Monitoring are Transforming Road Safety
- Doha a strategic location for EV manufacturing hub: IPA Qatar
- Demand for luxury TVs surging in the GCC, says Samsung
- Empowering Growth: The Thriving Journey of Bangladesh’s Cable Industry
Latest Reports
- Qatar Access and Home Network Market (2026-2032)
- Nicaragua RPG Gaming Market (2026-2032)
- New Zealand RPG Gaming Market (2026-2032)
- Netherlands RPG Gaming Market (2026-2032)
- Nauru RPG Gaming Market (2026-2032)
- Namibia RPG Gaming Market (2026-2032)
- Mozambique RPG Gaming Market (2026-2032)
- Montenegro RPG Gaming Market (2026-2032)
- Mongolia RPG Gaming Market (2026-2032)
- Monaco RPG Gaming Market (2026-2032)
Industry Events and Analyst Meet

EV India Expo 2026

HIMTEX 2026

India Refining Summit 2026

India EV Show 2026

EV tech India Expo 2026
Whitepaper
- Middle East & Africa Commercial Security Market Click here to view more.
- Middle East & Africa Fire Safety Systems & Equipment Market Click here to view more.
- GCC Drone Market Click here to view more.
- Middle East Lighting Fixture Market Click here to view more.
- GCC Physical & Perimeter Security Market Click here to view more.