Croatia Beverage Cans Market (2026-2032) | Revenue, Segmentation, Forecast, Size, Share, Growth, Analysis, Value, Industry, Trends, Outlook & Companies
Market Forecast By Product Type (Aluminium, Steel), By Application (Carbonated Water, Flavored Water, Still Water, Functional Water) And Competitive Landscape
| Product Code: ETC4854389 | Publication Date: Nov 2023 | Updated Date: Apr 2026 | Product Type: Market Research Report | |
| Publisher: 6Wresearch | Author: Shubham Padhi | No. of Pages: 60 | No. of Figures: 30 | No. of Tables: 5 |
Croatia Beverage Cans Market Size (2020-2030)
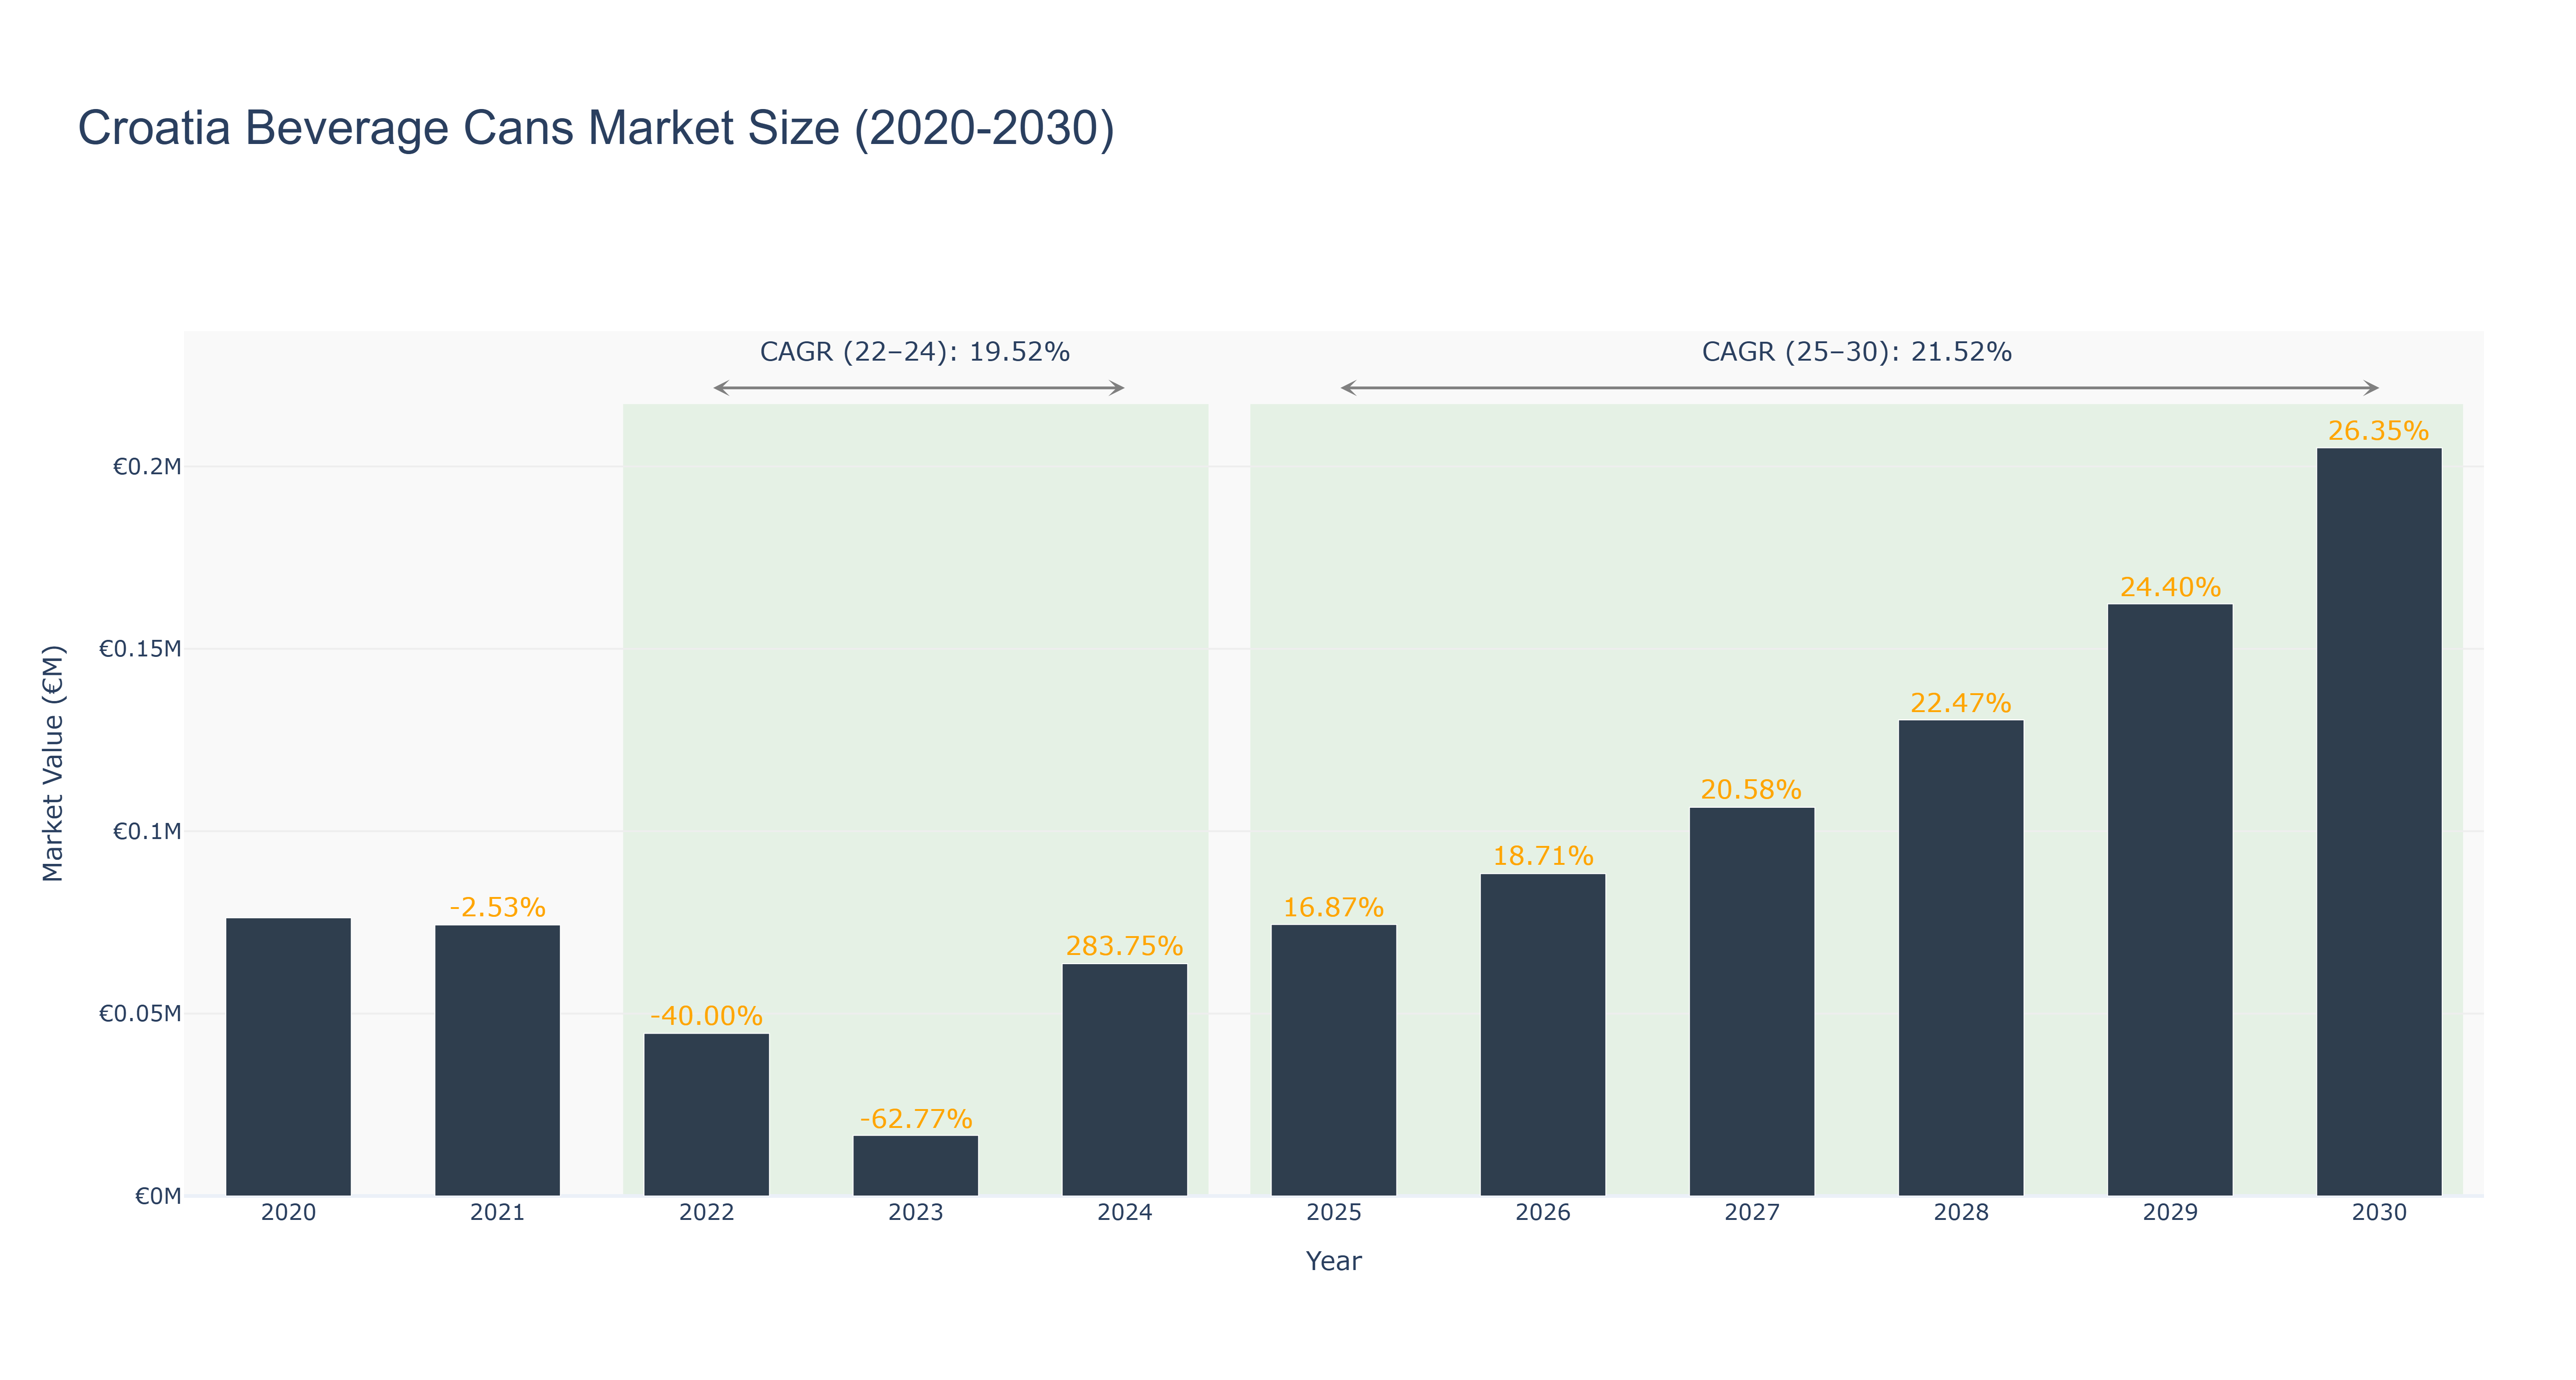
Croatia Beverage Cans Market has shown a fluctuating trend over the years. The peak market size was €0.21 million in 2030, reflecting a steady growth trajectory. However, the market experienced a significant decline from 2020 to 2023, dropping from €0.08 million to €0.02 million, attributed to economic downturns and changing consumer preferences. The market rebounded strongly in 2024, reaching €0.06 million with a notable growth rate of 283.75%, driven by increased demand for sustainable packaging solutions. Looking ahead, the market is forecasted to continue its growth momentum, with a CAGR of 21.52% from 2025 to 2030. Industry drivers such as environmental awareness and technological advancements are expected to fuel this growth. Additionally, upcoming investments in recycling infrastructure and innovative packaging designs are set to further boost the market in the near future.
Croatia Beverage Cans Market: Production & Trade Performance (2019-2025)
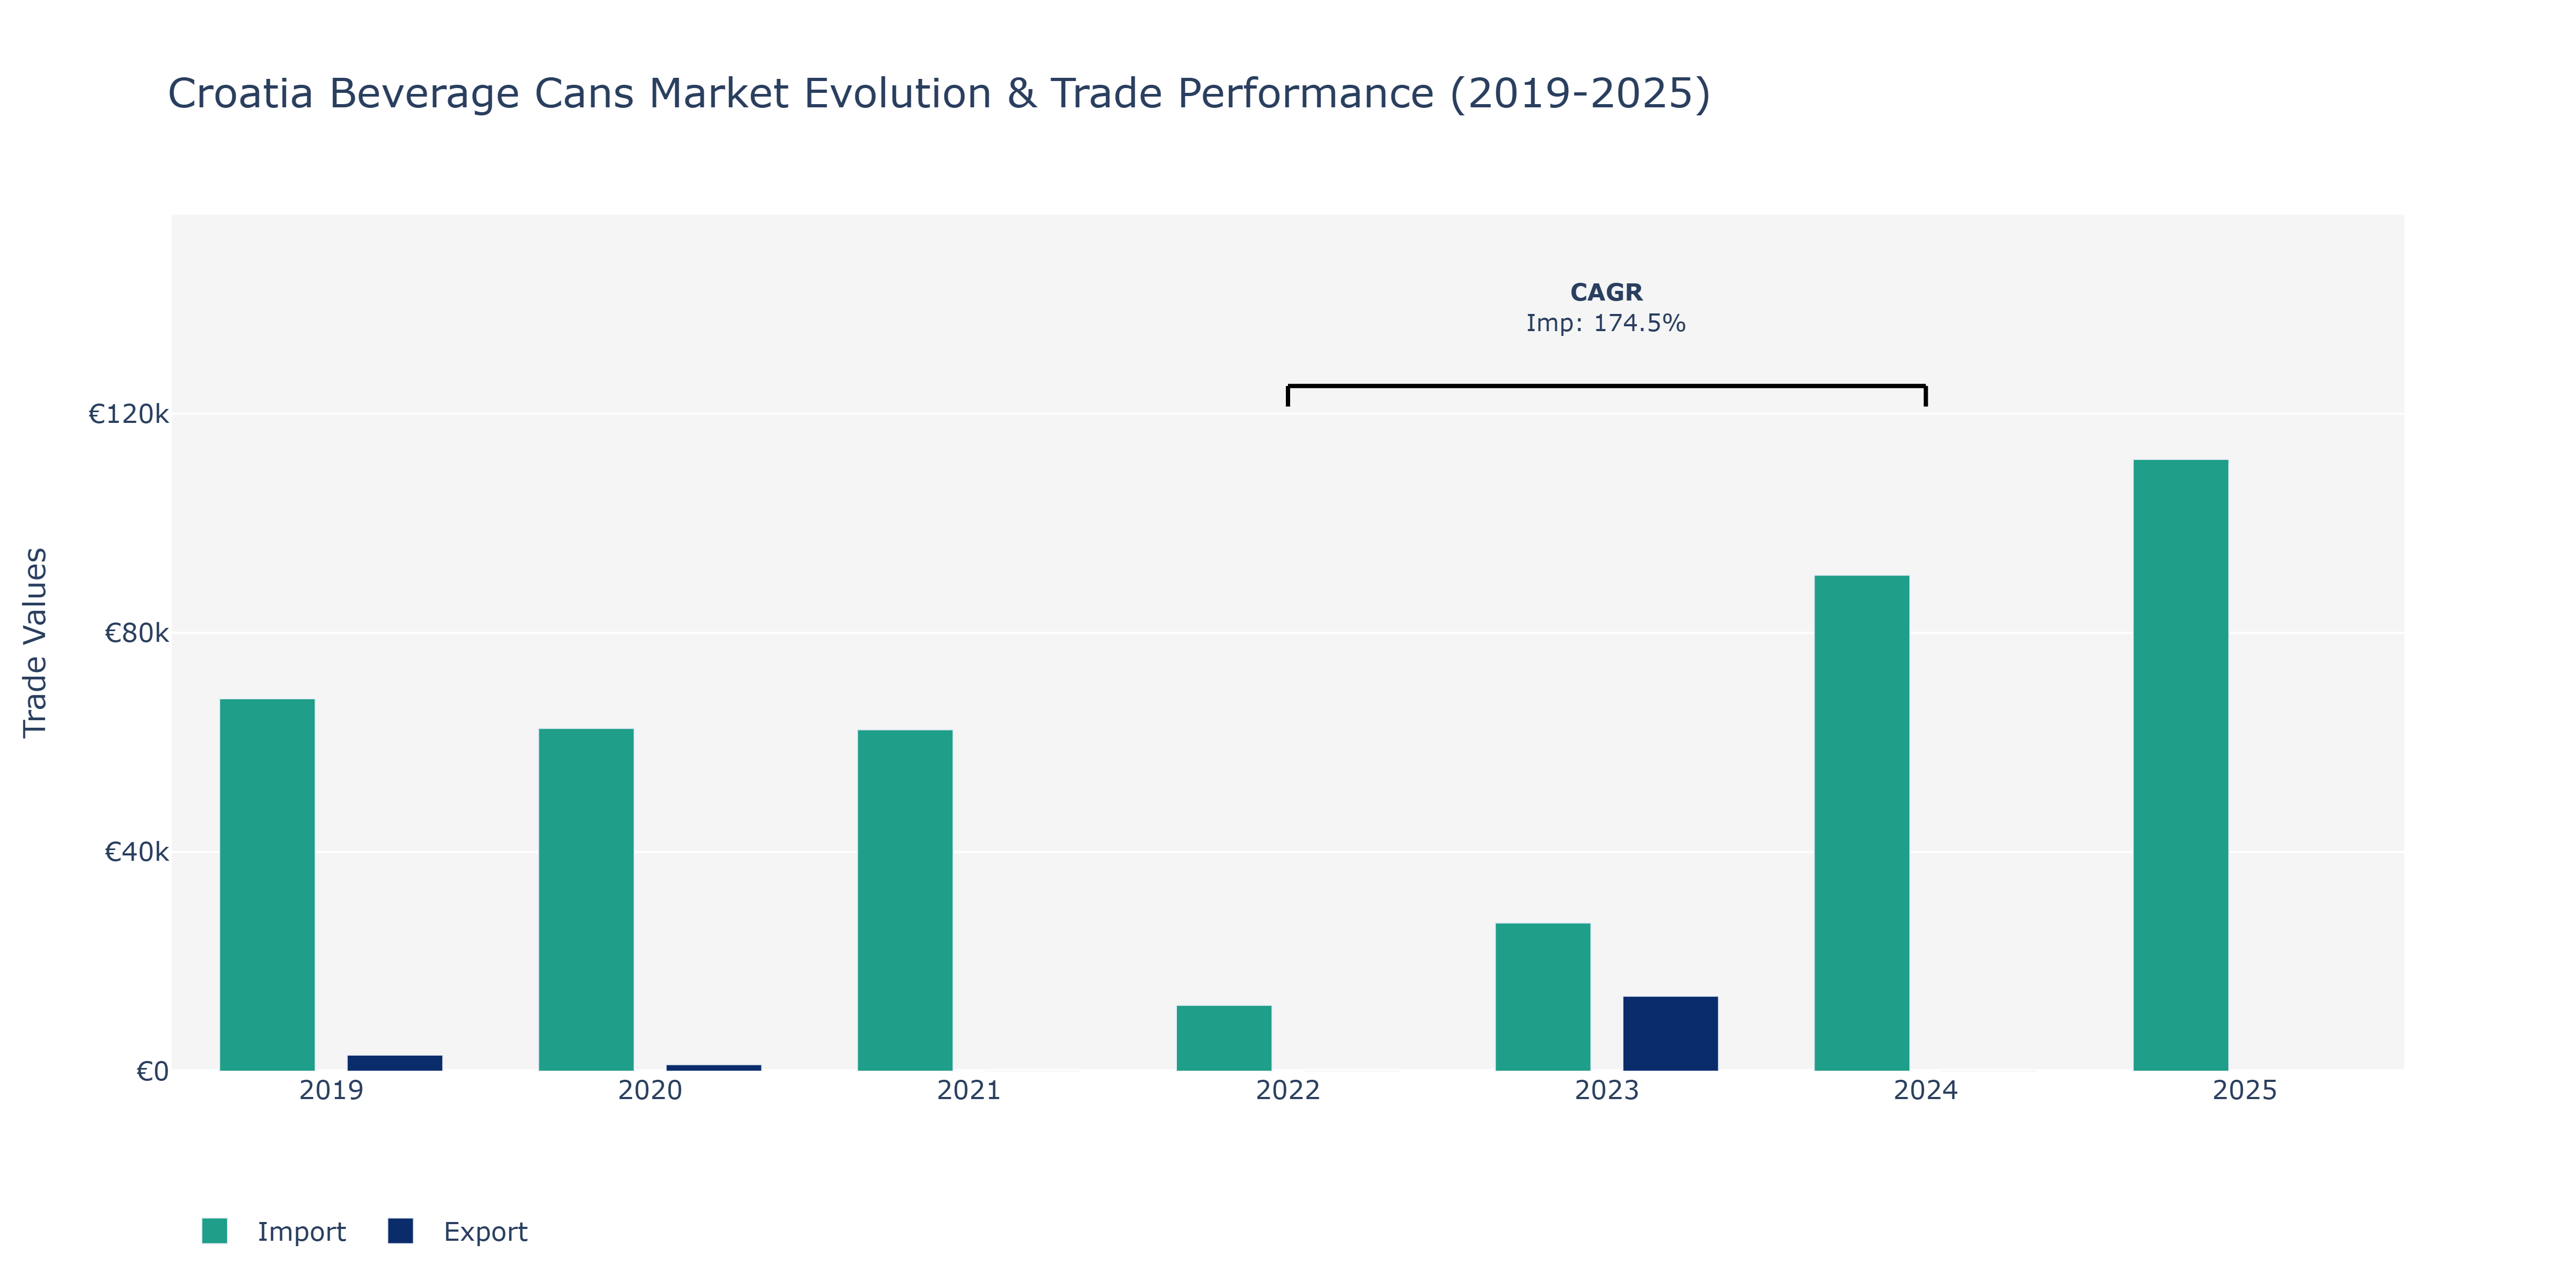
In the Croatia Beverage Cans Market, exports experienced a notable decline from €2.94 thousand in 2019 to €1.2 thousand in 2020, before rebounding to €13.68 thousand in 2023. This fluctuation may be attributed to shifts in consumer demand, economic conditions, and global market dynamics. In contrast, imports showed a varied pattern, standing at €67.98 thousand in 2019, dropping to €62.57 thousand in 2020, and then fluctuating between €27.05 thousand in 2023 and peaking at €111.65 thousand in 2025. The substantial increase in imports, especially the remarkable 174.51% CAGR observed from 2022 to 2024, could be linked to increased domestic consumption, expansion of the beverage industry, and potentially strategic sourcing decisions by market players. These trends underscore the market's sensitivity to both local and international factors, emphasizing the need for stakeholders to adapt to evolving market conditions and consumer preferences to drive sustainable growth in the Croatia Beverage Cans Market.
Key Highlights of the Report:
- Croatia Beverage Cans Market Outlook
- Market Size of Croatia Beverage Cans Market, 2025
- Forecast of Croatia Beverage Cans Market, 2032
- Historical Data and Forecast of Croatia Beverage Cans Revenues & Volume for the Period 2022 - 2032F
- Croatia Beverage Cans Market Trend Evolution
- Croatia Beverage Cans Market Drivers and Challenges
- Croatia Beverage Cans Price Trends
- Croatia Beverage Cans Porter`s Five Forces
- Croatia Beverage Cans Industry Life Cycle
- Historical Data and Forecast of Croatia Beverage Cans Market Revenues & Volume By Product Type for the Period 2022 - 2032F
- Historical Data and Forecast of Croatia Beverage Cans Market Revenues & Volume By Aluminium for the Period 2022 - 2032F
- Historical Data and Forecast of Croatia Beverage Cans Market Revenues & Volume By Steel for the Period 2022 - 2032F
- Historical Data and Forecast of Croatia Beverage Cans Market Revenues & Volume By Application for the Period 2022 - 2032F
- Historical Data and Forecast of Croatia Beverage Cans Market Revenues & Volume By Carbonated Water for the Period 2022 - 2032F
- Historical Data and Forecast of Croatia Beverage Cans Market Revenues & Volume By Flavored Water for the Period 2022 - 2032F
- Historical Data and Forecast of Croatia Beverage Cans Market Revenues & Volume By Still Water for the Period 2022 - 2032F
- Historical Data and Forecast of Croatia Beverage Cans Market Revenues & Volume By Functional Water for the Period 2022 - 2032F
- Croatia Beverage Cans Import Export Trade Statistics
- Market Opportunity Assessment By Product Type
- Market Opportunity Assessment By Application
- Croatia Beverage Cans Top Companies Market Share
- Croatia Beverage Cans Competitive Benchmarking By Technical and Operational Parameters
- Croatia Beverage Cans Company Profiles
- Croatia Beverage Cans Key Strategic Recommendations
Frequently Asked Questions About the Market Study (FAQs):
6Wresearch actively monitors the Croatia Beverage Cans Market and publishes its comprehensive annual report, highlighting emerging trends, growth drivers, revenue analysis, and forecast outlook. Our insights help businesses to make data-backed strategic decisions with ongoing market dynamics. Our analysts track relevent industries related to the Croatia Beverage Cans Market, allowing our clients with actionable intelligence and reliable forecasts tailored to emerging regional needs.
Yes, we provide customisation as per your requirements. To learn more, feel free to contact us on sales@6wresearch.com
1 Executive Summary |
2 Introduction |
2.1 Key Highlights of the Report |
2.2 Report Description |
2.3 Market Scope & Segmentation |
2.4 Research Methodology |
2.5 Assumptions |
3 Croatia Beverage Cans Market Overview |
3.1 Croatia Country Macro Economic Indicators |
3.2 Croatia Beverage Cans Market Revenues & Volume, 2022 & 2032F |
3.3 Croatia Beverage Cans Market - Industry Life Cycle |
3.4 Croatia Beverage Cans Market - Porter's Five Forces |
3.5 Croatia Beverage Cans Market Revenues & Volume Share, By Product Type, 2022 & 2032F |
3.6 Croatia Beverage Cans Market Revenues & Volume Share, By Application, 2022 & 2032F |
4 Croatia Beverage Cans Market Dynamics |
4.1 Impact Analysis |
4.2 Market Drivers |
4.2.1 Growing demand for convenient and sustainable packaging solutions |
4.2.2 Increasing popularity of ready-to-drink beverages |
4.2.3 Emphasis on recycling and environmental sustainability |
4.3 Market Restraints |
4.3.1 Fluctuating raw material prices |
4.3.2 Competition from alternative packaging materials |
4.3.3 Regulatory challenges related to waste management and recycling |
5 Croatia Beverage Cans Market Trends |
6 Croatia Beverage Cans Market Segmentations |
6.1 Croatia Beverage Cans Market, By Product Type |
6.1.1 Overview and Analysis |
6.1.2 Croatia Beverage Cans Market Revenues & Volume, By Aluminium, 2022 - 2032F |
6.1.3 Croatia Beverage Cans Market Revenues & Volume, By Steel, 2022 - 2032F |
6.2 Croatia Beverage Cans Market, By Application |
6.2.1 Overview and Analysis |
6.2.2 Croatia Beverage Cans Market Revenues & Volume, By Carbonated Water, 2022 - 2032F |
6.2.3 Croatia Beverage Cans Market Revenues & Volume, By Flavored Water, 2022 - 2032F |
6.2.4 Croatia Beverage Cans Market Revenues & Volume, By Still Water, 2022 - 2032F |
6.2.5 Croatia Beverage Cans Market Revenues & Volume, By Functional Water, 2022 - 2032F |
7 Croatia Beverage Cans Market Import-Export Trade Statistics |
7.1 Croatia Beverage Cans Market Export to Major Countries |
7.2 Croatia Beverage Cans Market Imports from Major Countries |
8 Croatia Beverage Cans Market Key Performance Indicators |
8.1 Percentage of recycled content in beverage cans |
8.2 Adoption rate of new packaging technologies |
8.3 Consumer awareness and perception of sustainability initiatives |
9 Croatia Beverage Cans Market - Opportunity Assessment |
9.1 Croatia Beverage Cans Market Opportunity Assessment, By Product Type, 2022 & 2032F |
9.2 Croatia Beverage Cans Market Opportunity Assessment, By Application, 2022 & 2032F |
10 Croatia Beverage Cans Market - Competitive Landscape |
10.1 Croatia Beverage Cans Market Revenue Share, By Companies, 2025 |
10.2 Croatia Beverage Cans Market Competitive Benchmarking, By Operating and Technical Parameters |
11 Company Profiles |
12 Recommendations | 13 Disclaimer |
Global Go To Market Strategy - 2030
Export potential enables firms to identify high-growth global markets with greater confidence by combining advanced trade intelligence with a structured quantitative methodology. The framework analyzes emerging demand trends and country-level import patterns while integrating macroeconomic and trade datasets such as GDP and population forecasts, bilateral import–export flows, tariff structures, elasticity differentials between developed and developing economies, geographic distance, and import demand projections. Using weighted trade values from 2020–2024 as the base period to project country-to-country export potential for 2030, these inputs are operationalized through calculated drivers such as gravity model parameters, tariff impact factors, and projected GDP per-capita growth. Through an analysis of hidden potentials, demand hotspots, and market conditions that are most favorable to success, this method enables firms to focus on target countries, maximize returns, and global expansion with data, backed by accuracy.
By factoring in the projected importer demand gap that is currently unmet and could be potential opportunity, it identifies the potential for the Exporter (Country) among 190 countries, against the general trade analysis, which identifies the biggest importer or exporter.
To discover high-growth global markets and optimize your business strategy:
Click Here
Pricing
- Single User License$ 1,995
- Department License$ 2,400
- Site License$ 3,120
- Global License$ 3,795

Leadership Perspectives from Industry Events
Search
Thought Leadership and Analyst Meet


Our Clients
6WResearch In News
- India Air Conditioner Market Set for Strong Rebound in 2026 After Weather-Led Correction and GST-Driven Recovery: 6Wresearch
- ADAS in India: How Automatic Emergency Braking, Blind Spot Detection & Driver Monitoring are Transforming Road Safety
- Doha a strategic location for EV manufacturing hub: IPA Qatar
- Demand for luxury TVs surging in the GCC, says Samsung
- Empowering Growth: The Thriving Journey of Bangladesh’s Cable Industry
- Demand for luxury TVs surging in the GCC, says Samsung
Latest Reports
- Poland Fire Protection Systems Market (2026-2032)
- Cape Verde Portable Hand-Thrown Extinguisher Market (2026-2032)
- Canada Portable Hand-Thrown Extinguisher Market (2026-2032)
- Cameroon Portable Hand-Thrown Extinguisher Market (2026-2032)
- Burundi Portable Hand-Thrown Extinguisher Market (2026-2032)
- Burkina Faso Portable Hand-Thrown Extinguisher Market (2026-2032)
- Bulgaria Portable Hand-Thrown Extinguisher Market (2026-2032)
- Brunei Portable Hand-Thrown Extinguisher Market (2026-2032)
- Botswana Portable Hand-Thrown Extinguisher Market (2026-2032)
- Bosnia and Herzegovina Portable Hand-Thrown Extinguisher Market (2026-2032)
Industry Events and Analyst Meet

HIMTEX 2026

India Refining Summit 2026

India EV Show 2026

EV tech India Expo 2026

Auto Tech Asia 2026
Whitepaper
- Middle East & Africa Commercial Security Market Click here to view more.
- Middle East & Africa Fire Safety Systems & Equipment Market Click here to view more.
- GCC Drone Market Click here to view more.
- Middle East Lighting Fixture Market Click here to view more.
- GCC Physical & Perimeter Security Market Click here to view more.