Croatia Commercial Coffee Urn Market (2026-2032) | Size & Revenue, Analysis, Forecast, Value, Growth, Companies, Share, Industry, Competitive Landscape, Trends, Segmentation, Outlook
Market Forecast By Type (Traditional, Digital), By Capacity (Up to 5 Liters, 5 - 10 Liters, More than 10 Liters), By Material (Stainless Steel, Aluminum, Others (Iron, etc.)), By Distribution Channel (Online, Offline) And Competitive Landscape
| Product Code: ETC6848209 | Publication Date: Sep 2024 | Updated Date: Apr 2026 | Product Type: Market Research Report | |
| Publisher: 6Wresearch | Author: Sumit Sagar | No. of Pages: 75 | No. of Figures: 35 | No. of Tables: 20 |
Croatia Commercial Coffee Urn Market Size (2020-2030)
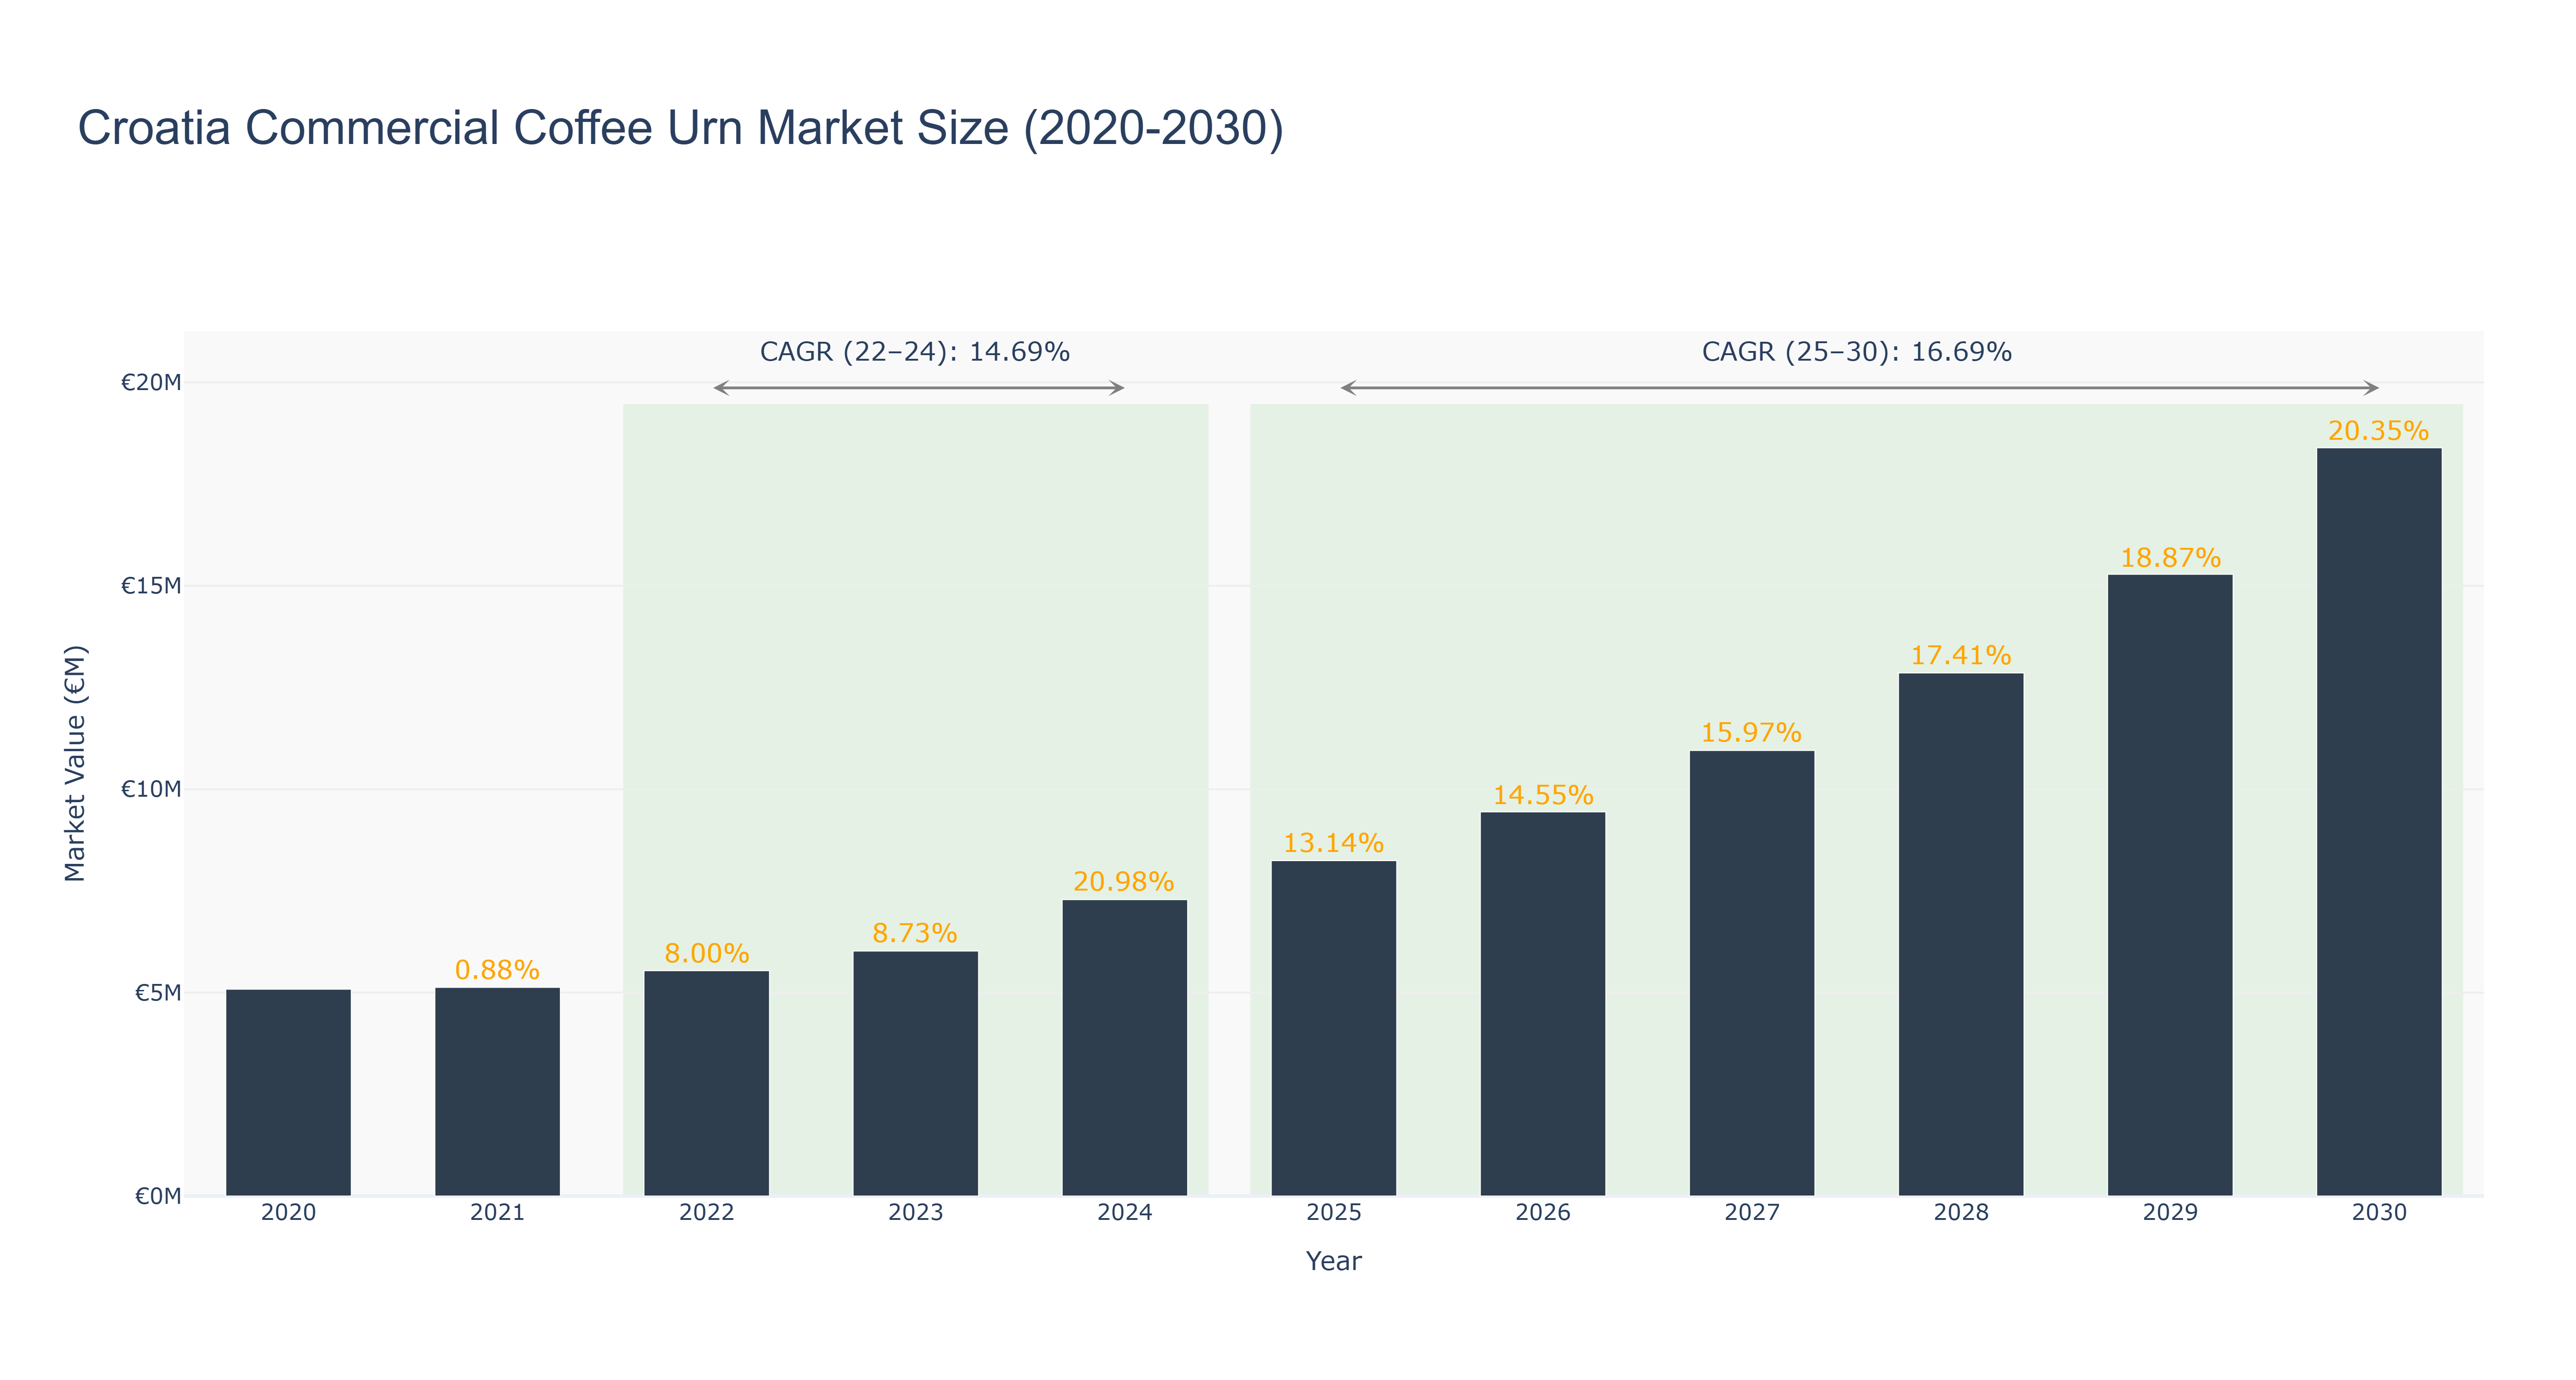
Croatia's Commercial Coffee Urn Market has shown a steady growth trajectory over the years. The market size peaked at €18.39 million in 2030, with a notable CAGR of 20.35% from 2025 to 2030. The actual market size increased from €5.54 million in 2022 to €7.29 million in 2024, driven by a CAGR of 14.69%. The recent spike in market size can be attributed to increasing demand for coffee-related products and the growing coffee culture in Croatia. Looking ahead, the forecasted growth is expected to be fueled by innovative product offerings and expanding distribution channels. In the near future, Croatia is set to witness the launch of a national coffee festival aimed at promoting local coffee businesses and attracting international coffee enthusiasts, further boosting the Commercial Coffee Urn Market.
Croatia Commercial Coffee Urn Market: Production & Trade Performance (2019-2025)
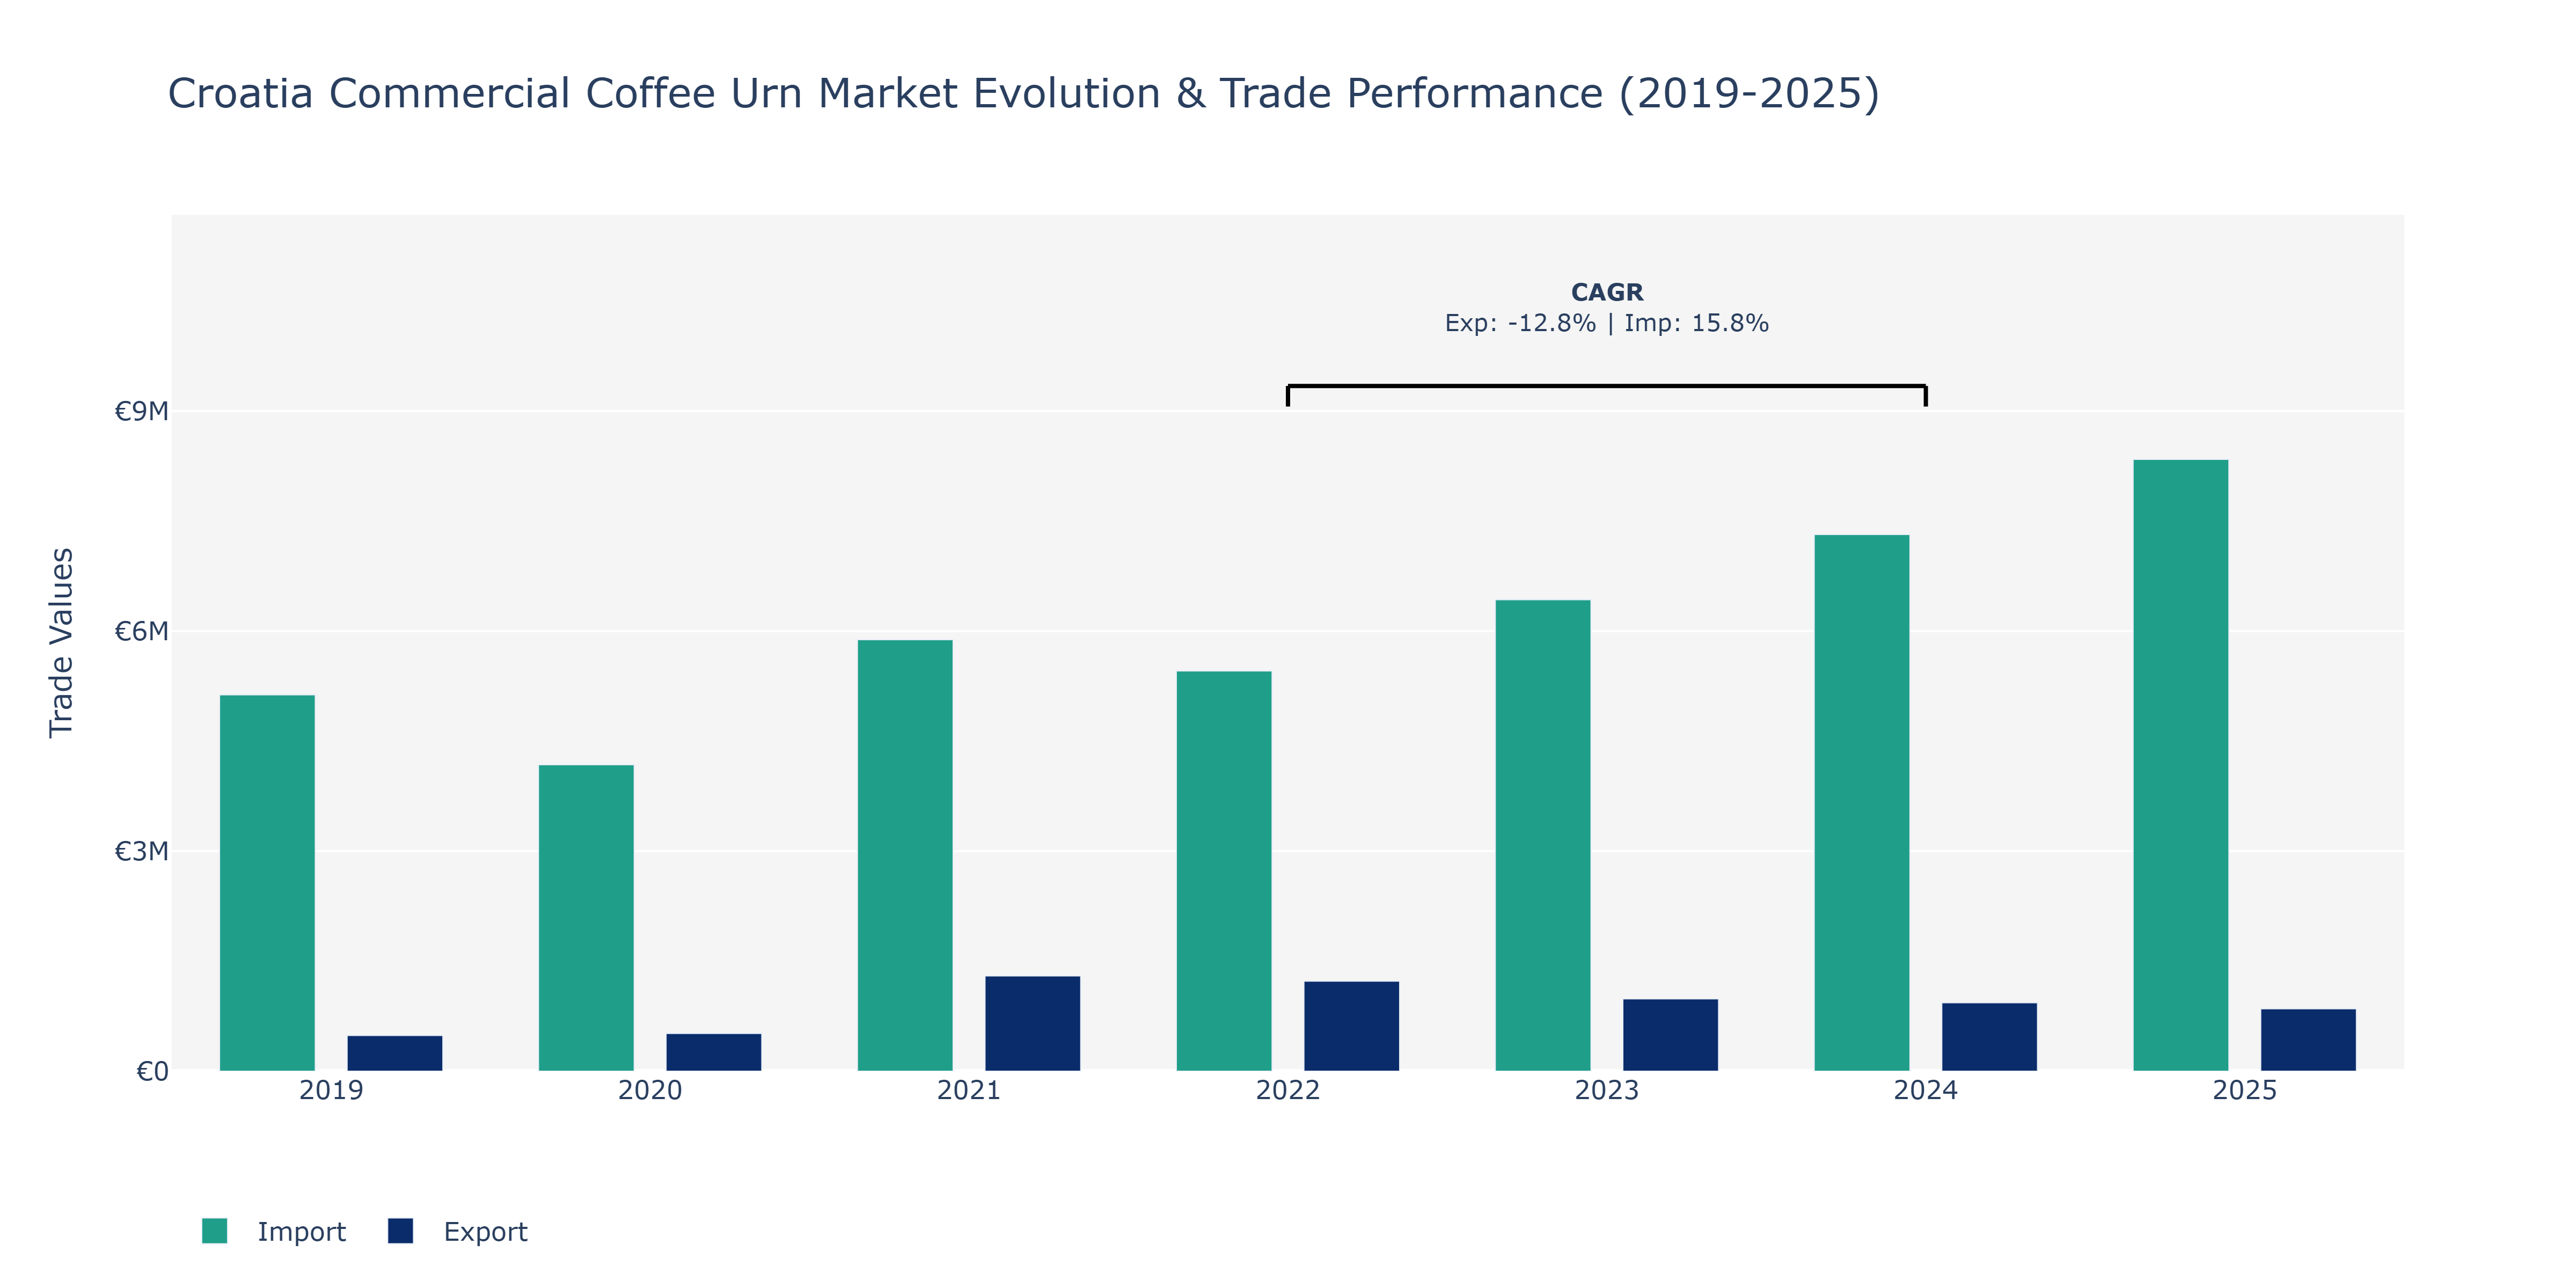
In the Croatia Commercial Coffee Urn Market, exports and imports experienced varying trajectories from 2019 to 2025. Exports showed a steady growth from €486.91 thousand in 2019 to a peak of €1.3 million in 2021, followed by a slight decline to €932.7 thousand in 2024. The year 2025 saw a further decrease to €850.93 thousand. On the other hand, imports fluctuated notably, starting at €5.13 million in 2019, reaching a low of €4.18 million in 2020, and then steadily increasing to €8.34 million in 2025. The increase in imports can be attributed to rising domestic demand for coffee equipment, potentially driven by a growing café culture and an expanding hospitality sector in Croatia. Conversely, the fluctuations in exports could be influenced by shifts in international coffee urn market demands and global economic conditions impacting export capabilities.
Key Highlights of the Report:
- Croatia Commercial Coffee Urn Market Outlook
- Market Size of Croatia Commercial Coffee Urn Market, 2025
- Forecast of Croatia Commercial Coffee Urn Market, 2032
- Historical Data and Forecast of Croatia Commercial Coffee Urn Revenues & Volume for the Period 2022 - 2032
- Croatia Commercial Coffee Urn Market Trend Evolution
- Croatia Commercial Coffee Urn Market Drivers and Challenges
- Croatia Commercial Coffee Urn Price Trends
- Croatia Commercial Coffee Urn Porter's Five Forces
- Croatia Commercial Coffee Urn Industry Life Cycle
- Historical Data and Forecast of Croatia Commercial Coffee Urn Market Revenues & Volume By Type for the Period 2022 - 2032
- Historical Data and Forecast of Croatia Commercial Coffee Urn Market Revenues & Volume By Traditional for the Period 2022 - 2032
- Historical Data and Forecast of Croatia Commercial Coffee Urn Market Revenues & Volume By Digital for the Period 2022 - 2032
- Historical Data and Forecast of Croatia Commercial Coffee Urn Market Revenues & Volume By Capacity for the Period 2022 - 2032
- Historical Data and Forecast of Croatia Commercial Coffee Urn Market Revenues & Volume By Up to 5 Liters for the Period 2022 - 2032
- Historical Data and Forecast of Croatia Commercial Coffee Urn Market Revenues & Volume By 5 - 10 Liters for the Period 2022 - 2032
- Historical Data and Forecast of Croatia Commercial Coffee Urn Market Revenues & Volume By More than 10 Liters for the Period 2022 - 2032
- Historical Data and Forecast of Croatia Commercial Coffee Urn Market Revenues & Volume By Material for the Period 2022 - 2032
- Historical Data and Forecast of Croatia Commercial Coffee Urn Market Revenues & Volume By Stainless Steel for the Period 2022 - 2032
- Historical Data and Forecast of Croatia Commercial Coffee Urn Market Revenues & Volume By Aluminum for the Period 2022 - 2032
- Historical Data and Forecast of Croatia Commercial Coffee Urn Market Revenues & Volume By Others (Iron, etc.) for the Period 2022 - 2032
- Historical Data and Forecast of Croatia Commercial Coffee Urn Market Revenues & Volume By Distribution Channel for the Period 2022 - 2032
- Historical Data and Forecast of Croatia Commercial Coffee Urn Market Revenues & Volume By Online for the Period 2022 - 2032
- Historical Data and Forecast of Croatia Commercial Coffee Urn Market Revenues & Volume By Offline for the Period 2022 - 2032
- Croatia Commercial Coffee Urn Import Export Trade Statistics
- Market Opportunity Assessment By Type
- Market Opportunity Assessment By Capacity
- Market Opportunity Assessment By Material
- Market Opportunity Assessment By Distribution Channel
- Croatia Commercial Coffee Urn Top Companies Market Share
- Croatia Commercial Coffee Urn Competitive Benchmarking By Technical and Operational Parameters
- Croatia Commercial Coffee Urn Company Profiles
- Croatia Commercial Coffee Urn Key Strategic Recommendations
Frequently Asked Questions About the Market Study (FAQs):
6Wresearch actively monitors the Croatia Commercial Coffee Urn Market and publishes its comprehensive annual report, highlighting emerging trends, growth drivers, revenue analysis, and forecast outlook. Our insights help businesses to make data-backed strategic decisions with ongoing market dynamics. Our analysts track relevent industries related to the Croatia Commercial Coffee Urn Market, allowing our clients with actionable intelligence and reliable forecasts tailored to emerging regional needs.
Yes, we provide customisation as per your requirements. To learn more, feel free to contact us on sales@6wresearch.com
1 Executive Summary |
2 Introduction |
2.1 Key Highlights of the Report |
2.2 Report Description |
2.3 Market Scope & Segmentation |
2.4 Research Methodology |
2.5 Assumptions |
3 Croatia Commercial Coffee Urn Market Overview |
3.1 Croatia Country Macro Economic Indicators |
3.2 Croatia Commercial Coffee Urn Market Revenues & Volume, 2022 & 2032F |
3.3 Croatia Commercial Coffee Urn Market - Industry Life Cycle |
3.4 Croatia Commercial Coffee Urn Market - Porter's Five Forces |
3.5 Croatia Commercial Coffee Urn Market Revenues & Volume Share, By Type, 2022 & 2032F |
3.6 Croatia Commercial Coffee Urn Market Revenues & Volume Share, By Capacity, 2022 & 2032F |
3.7 Croatia Commercial Coffee Urn Market Revenues & Volume Share, By Material, 2022 & 2032F |
3.8 Croatia Commercial Coffee Urn Market Revenues & Volume Share, By Distribution Channel, 2022 & 2032F |
4 Croatia Commercial Coffee Urn Market Dynamics |
4.1 Impact Analysis |
4.2 Market Drivers |
4.2.1 Increasing demand for coffee consumption in Croatia |
4.2.2 Growth in the hospitality industry, including cafes, restaurants, and hotels |
4.2.3 Rise in the number of events and conferences leading to higher demand for commercial coffee urns |
4.3 Market Restraints |
4.3.1 Price sensitivity among businesses due to economic conditions |
4.3.2 Competition from alternative coffee brewing methods |
4.3.3 Limited awareness and adoption of commercial coffee urns in certain regions |
5 Croatia Commercial Coffee Urn Market Trends |
6 Croatia Commercial Coffee Urn Market, By Types |
6.1 Croatia Commercial Coffee Urn Market, By Type |
6.1.1 Overview and Analysis |
6.1.2 Croatia Commercial Coffee Urn Market Revenues & Volume, By Type, 2022 - 2032F |
6.1.3 Croatia Commercial Coffee Urn Market Revenues & Volume, By Traditional, 2022 - 2032F |
6.1.4 Croatia Commercial Coffee Urn Market Revenues & Volume, By Digital, 2022 - 2032F |
6.2 Croatia Commercial Coffee Urn Market, By Capacity |
6.2.1 Overview and Analysis |
6.2.2 Croatia Commercial Coffee Urn Market Revenues & Volume, By Up to 5 Liters, 2022 - 2032F |
6.2.3 Croatia Commercial Coffee Urn Market Revenues & Volume, By 5 - 10 Liters, 2022 - 2032F |
6.2.4 Croatia Commercial Coffee Urn Market Revenues & Volume, By More than 10 Liters, 2022 - 2032F |
6.3 Croatia Commercial Coffee Urn Market, By Material |
6.3.1 Overview and Analysis |
6.3.2 Croatia Commercial Coffee Urn Market Revenues & Volume, By Stainless Steel, 2022 - 2032F |
6.3.3 Croatia Commercial Coffee Urn Market Revenues & Volume, By Aluminum, 2022 - 2032F |
6.3.4 Croatia Commercial Coffee Urn Market Revenues & Volume, By Others (Iron, etc.), 2022 - 2032F |
6.4 Croatia Commercial Coffee Urn Market, By Distribution Channel |
6.4.1 Overview and Analysis |
6.4.2 Croatia Commercial Coffee Urn Market Revenues & Volume, By Online, 2022 - 2032F |
6.4.3 Croatia Commercial Coffee Urn Market Revenues & Volume, By Offline, 2022 - 2032F |
7 Croatia Commercial Coffee Urn Market Import-Export Trade Statistics |
7.1 Croatia Commercial Coffee Urn Market Export to Major Countries |
7.2 Croatia Commercial Coffee Urn Market Imports from Major Countries |
8 Croatia Commercial Coffee Urn Market Key Performance Indicators |
8.1 Average daily consumption of coffee per capita in Croatia |
8.2 Number of new cafes, restaurants, and hotels opening in the market |
8.3 Frequency of events and conferences held in Croatia's major cities |
9 Croatia Commercial Coffee Urn Market - Opportunity Assessment |
9.1 Croatia Commercial Coffee Urn Market Opportunity Assessment, By Type, 2022 & 2032F |
9.2 Croatia Commercial Coffee Urn Market Opportunity Assessment, By Capacity, 2022 & 2032F |
9.3 Croatia Commercial Coffee Urn Market Opportunity Assessment, By Material, 2022 & 2032F |
9.4 Croatia Commercial Coffee Urn Market Opportunity Assessment, By Distribution Channel, 2022 & 2032F |
10 Croatia Commercial Coffee Urn Market - Competitive Landscape |
10.1 Croatia Commercial Coffee Urn Market Revenue Share, By Companies, 2025 |
10.2 Croatia Commercial Coffee Urn Market Competitive Benchmarking, By Operating and Technical Parameters |
11 Company Profiles |
12 Recommendations |
13 Disclaimer |
Global Go To Market Strategy - 2030
Export potential enables firms to identify high-growth global markets with greater confidence by combining advanced trade intelligence with a structured quantitative methodology. The framework analyzes emerging demand trends and country-level import patterns while integrating macroeconomic and trade datasets such as GDP and population forecasts, bilateral import–export flows, tariff structures, elasticity differentials between developed and developing economies, geographic distance, and import demand projections. Using weighted trade values from 2020–2024 as the base period to project country-to-country export potential for 2030, these inputs are operationalized through calculated drivers such as gravity model parameters, tariff impact factors, and projected GDP per-capita growth. Through an analysis of hidden potentials, demand hotspots, and market conditions that are most favorable to success, this method enables firms to focus on target countries, maximize returns, and global expansion with data, backed by accuracy.
By factoring in the projected importer demand gap that is currently unmet and could be potential opportunity, it identifies the potential for the Exporter (Country) among 190 countries, against the general trade analysis, which identifies the biggest importer or exporter.
To discover high-growth global markets and optimize your business strategy:
Click Here
Pricing
- Single User License$ 1,995
- Department License$ 2,400
- Site License$ 3,120
- Global License$ 3,795

Leadership Perspectives from Industry Events
Search
Thought Leadership and Analyst Meet


Our Clients
6WResearch In News
- India Export Attractiveness Tracker 2026
- India Air Conditioner Market Set for Strong Rebound in 2026 After Weather-Led Correction and GST-Driven Recovery: 6Wresearch
- ADAS in India: How Automatic Emergency Braking, Blind Spot Detection & Driver Monitoring are Transforming Road Safety
- Doha a strategic location for EV manufacturing hub: IPA Qatar
- Demand for luxury TVs surging in the GCC, says Samsung
- Empowering Growth: The Thriving Journey of Bangladesh’s Cable Industry
Latest Reports
- Qatar Access and Home Network Market (2026-2032)
- Nicaragua RPG Gaming Market (2026-2032)
- New Zealand RPG Gaming Market (2026-2032)
- Netherlands RPG Gaming Market (2026-2032)
- Nauru RPG Gaming Market (2026-2032)
- Namibia RPG Gaming Market (2026-2032)
- Mozambique RPG Gaming Market (2026-2032)
- Montenegro RPG Gaming Market (2026-2032)
- Mongolia RPG Gaming Market (2026-2032)
- Monaco RPG Gaming Market (2026-2032)
Industry Events and Analyst Meet

EV India Expo 2026

HIMTEX 2026

India Refining Summit 2026

India EV Show 2026

EV tech India Expo 2026
Whitepaper
- Middle East & Africa Commercial Security Market Click here to view more.
- Middle East & Africa Fire Safety Systems & Equipment Market Click here to view more.
- GCC Drone Market Click here to view more.
- Middle East Lighting Fixture Market Click here to view more.
- GCC Physical & Perimeter Security Market Click here to view more.