Croatia Copper Market (2026-2032) | Forecast, Value, Size, Share, Revenue, Segmentation, Outlook, Industry, Analysis, Trends, Companies & Growth
Market Forecast By Applications (Building & Construction, Electrical & Electronics, Industrial Machinery & Equipment, Transportation, Consumer & General Products), By Product Type (Rods and Wires, Plates and Strips, Tubes, Others) And Competitive Landscape
| Product Code: ETC4653958 | Publication Date: Nov 2023 | Updated Date: Apr 2026 | Product Type: Market Research Report | |
| Publisher: 6Wresearch | Author: Shubham Padhi | No. of Pages: 60 | No. of Figures: 30 | No. of Tables: 5 |
Croatia Copper Market Size (2020-2030)
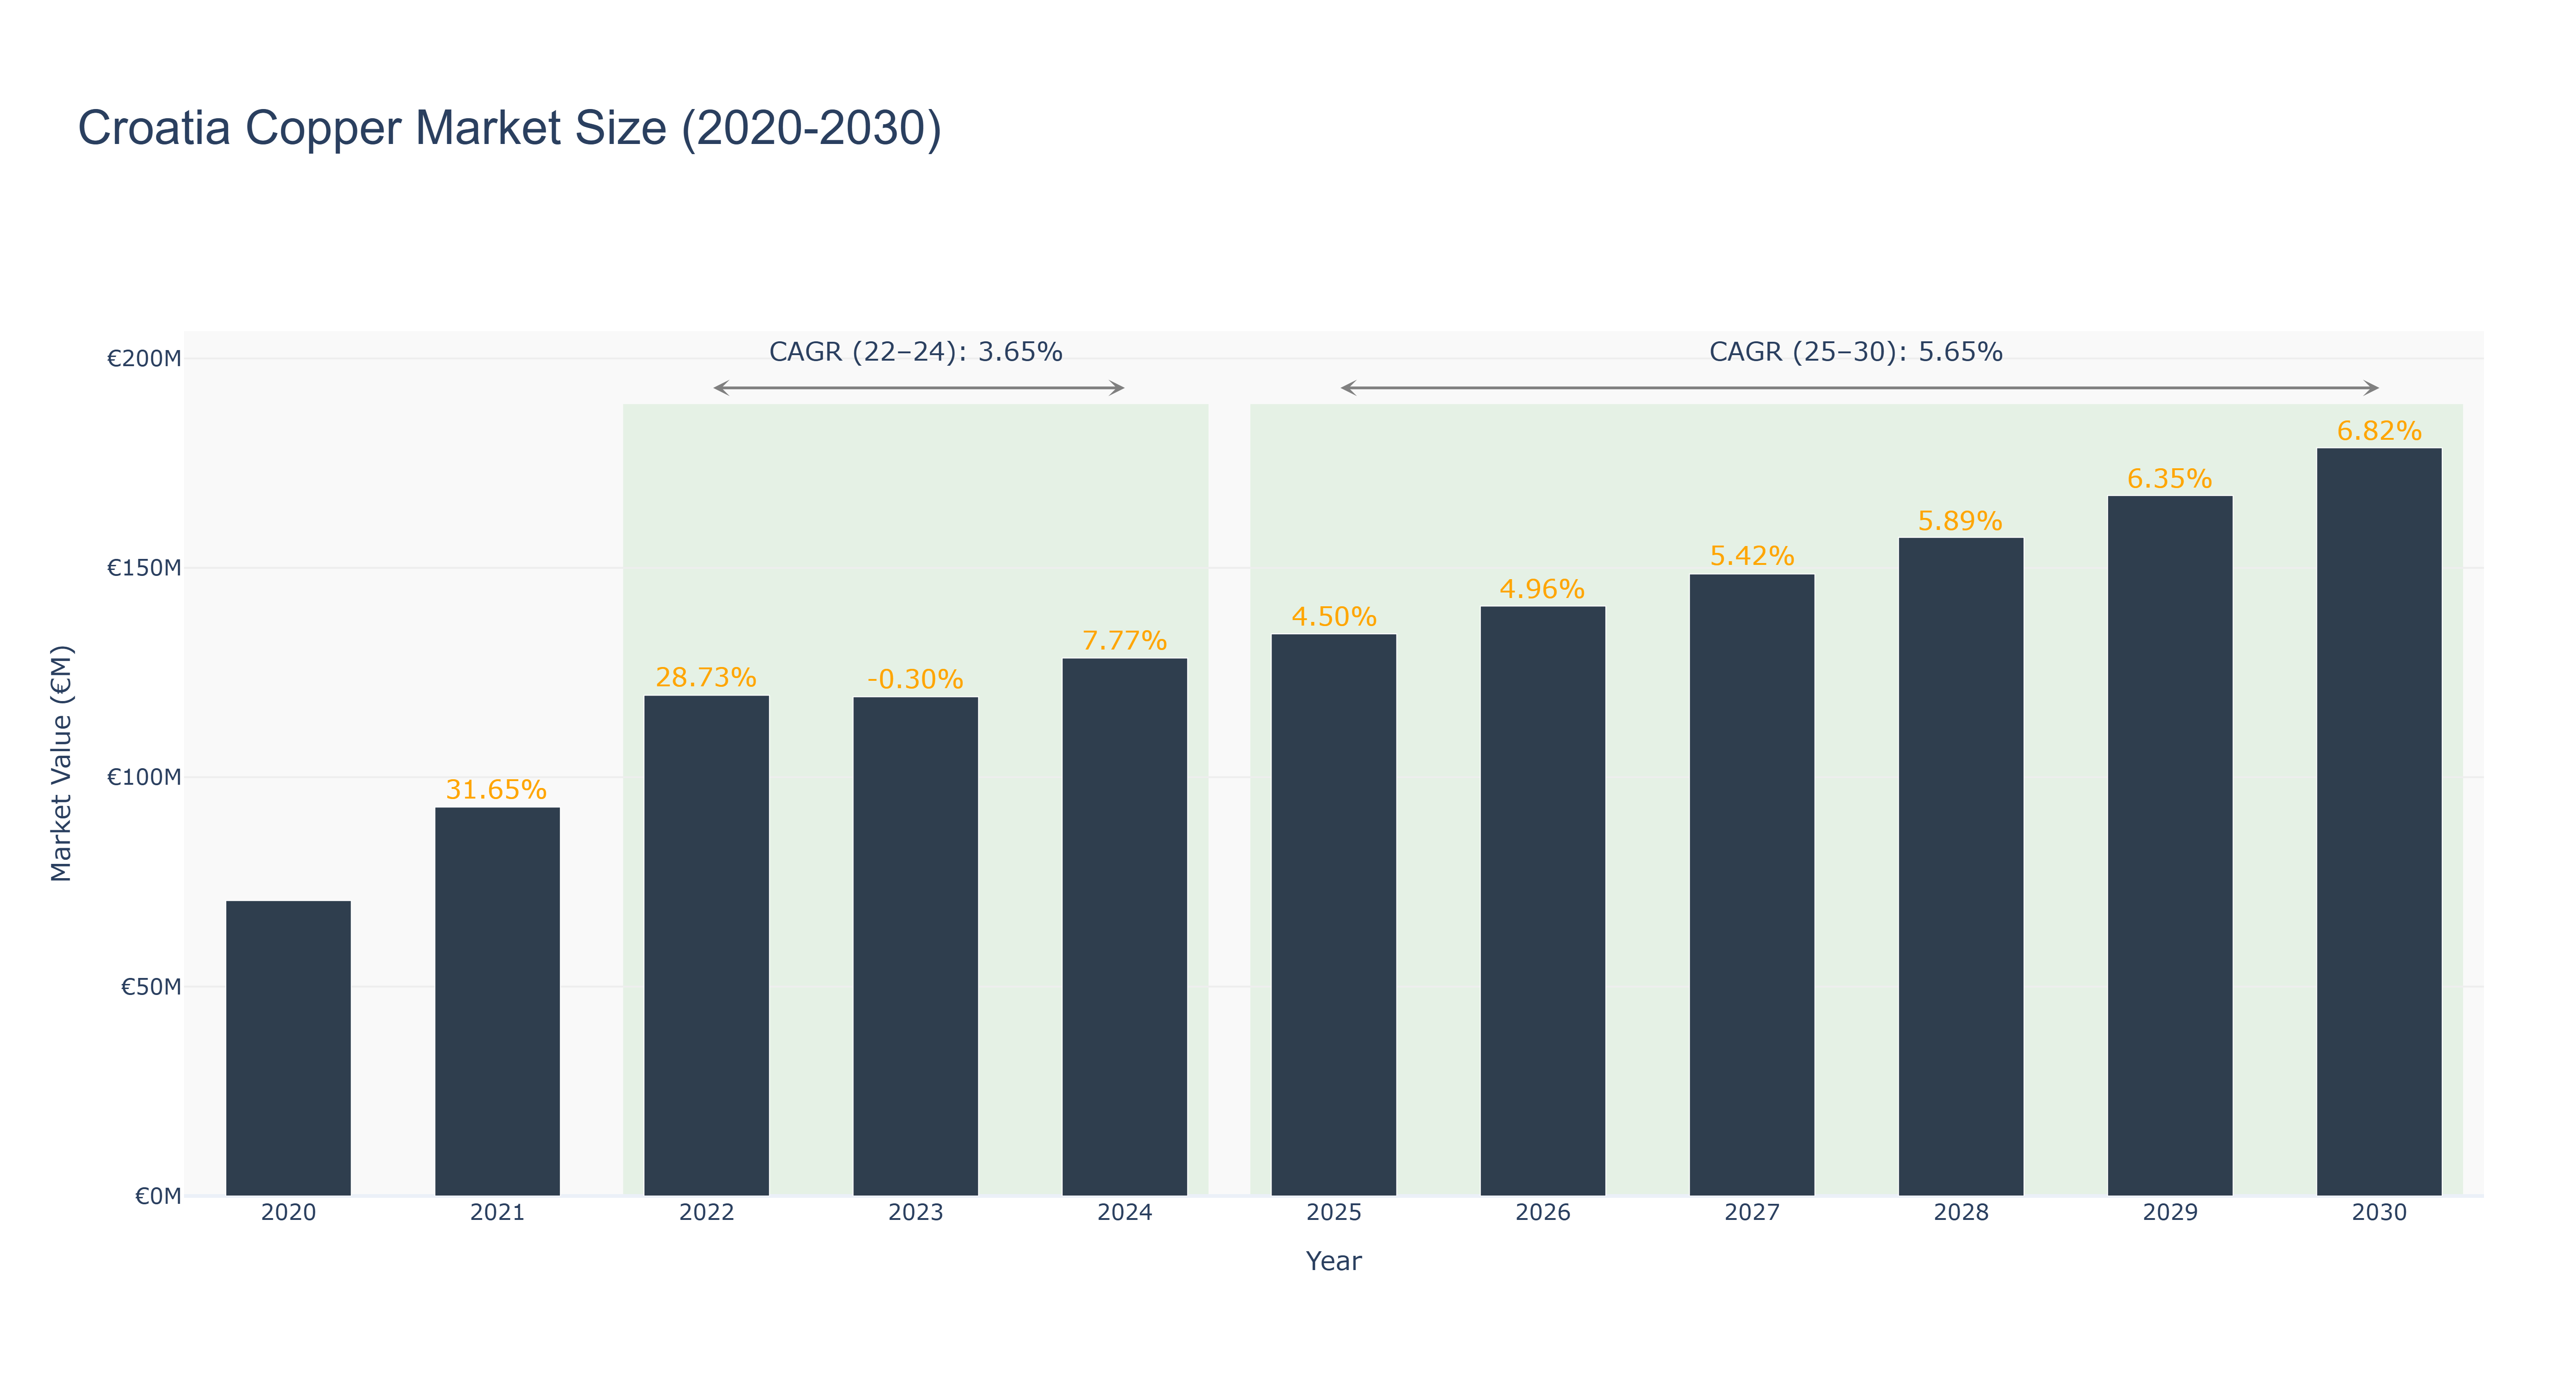
Croatia Copper Market has shown a steady growth trajectory over the past decade. The peak market size was recorded at €178.66 million in 2030. From 2020 to 2024, the market size increased from €70.54 million to €128.45 million, showcasing a positive trend. Forecasted market size from 2025 to 2030 is expected to reach €178.66 million, with a CAGR of 5.65%. The CAGR from 2022 to 2024 was 3.65%. The market's growth can be attributed to increasing demand for copper in various industries such as construction, electronics, and renewable energy. Looking ahead, Croatia is set to launch a new copper mining project in partnership with a multinational corporation to further boost the country's copper production capacity and meet growing market demands.
Croatia Copper Market: Production & Trade Performance (2019-2025)
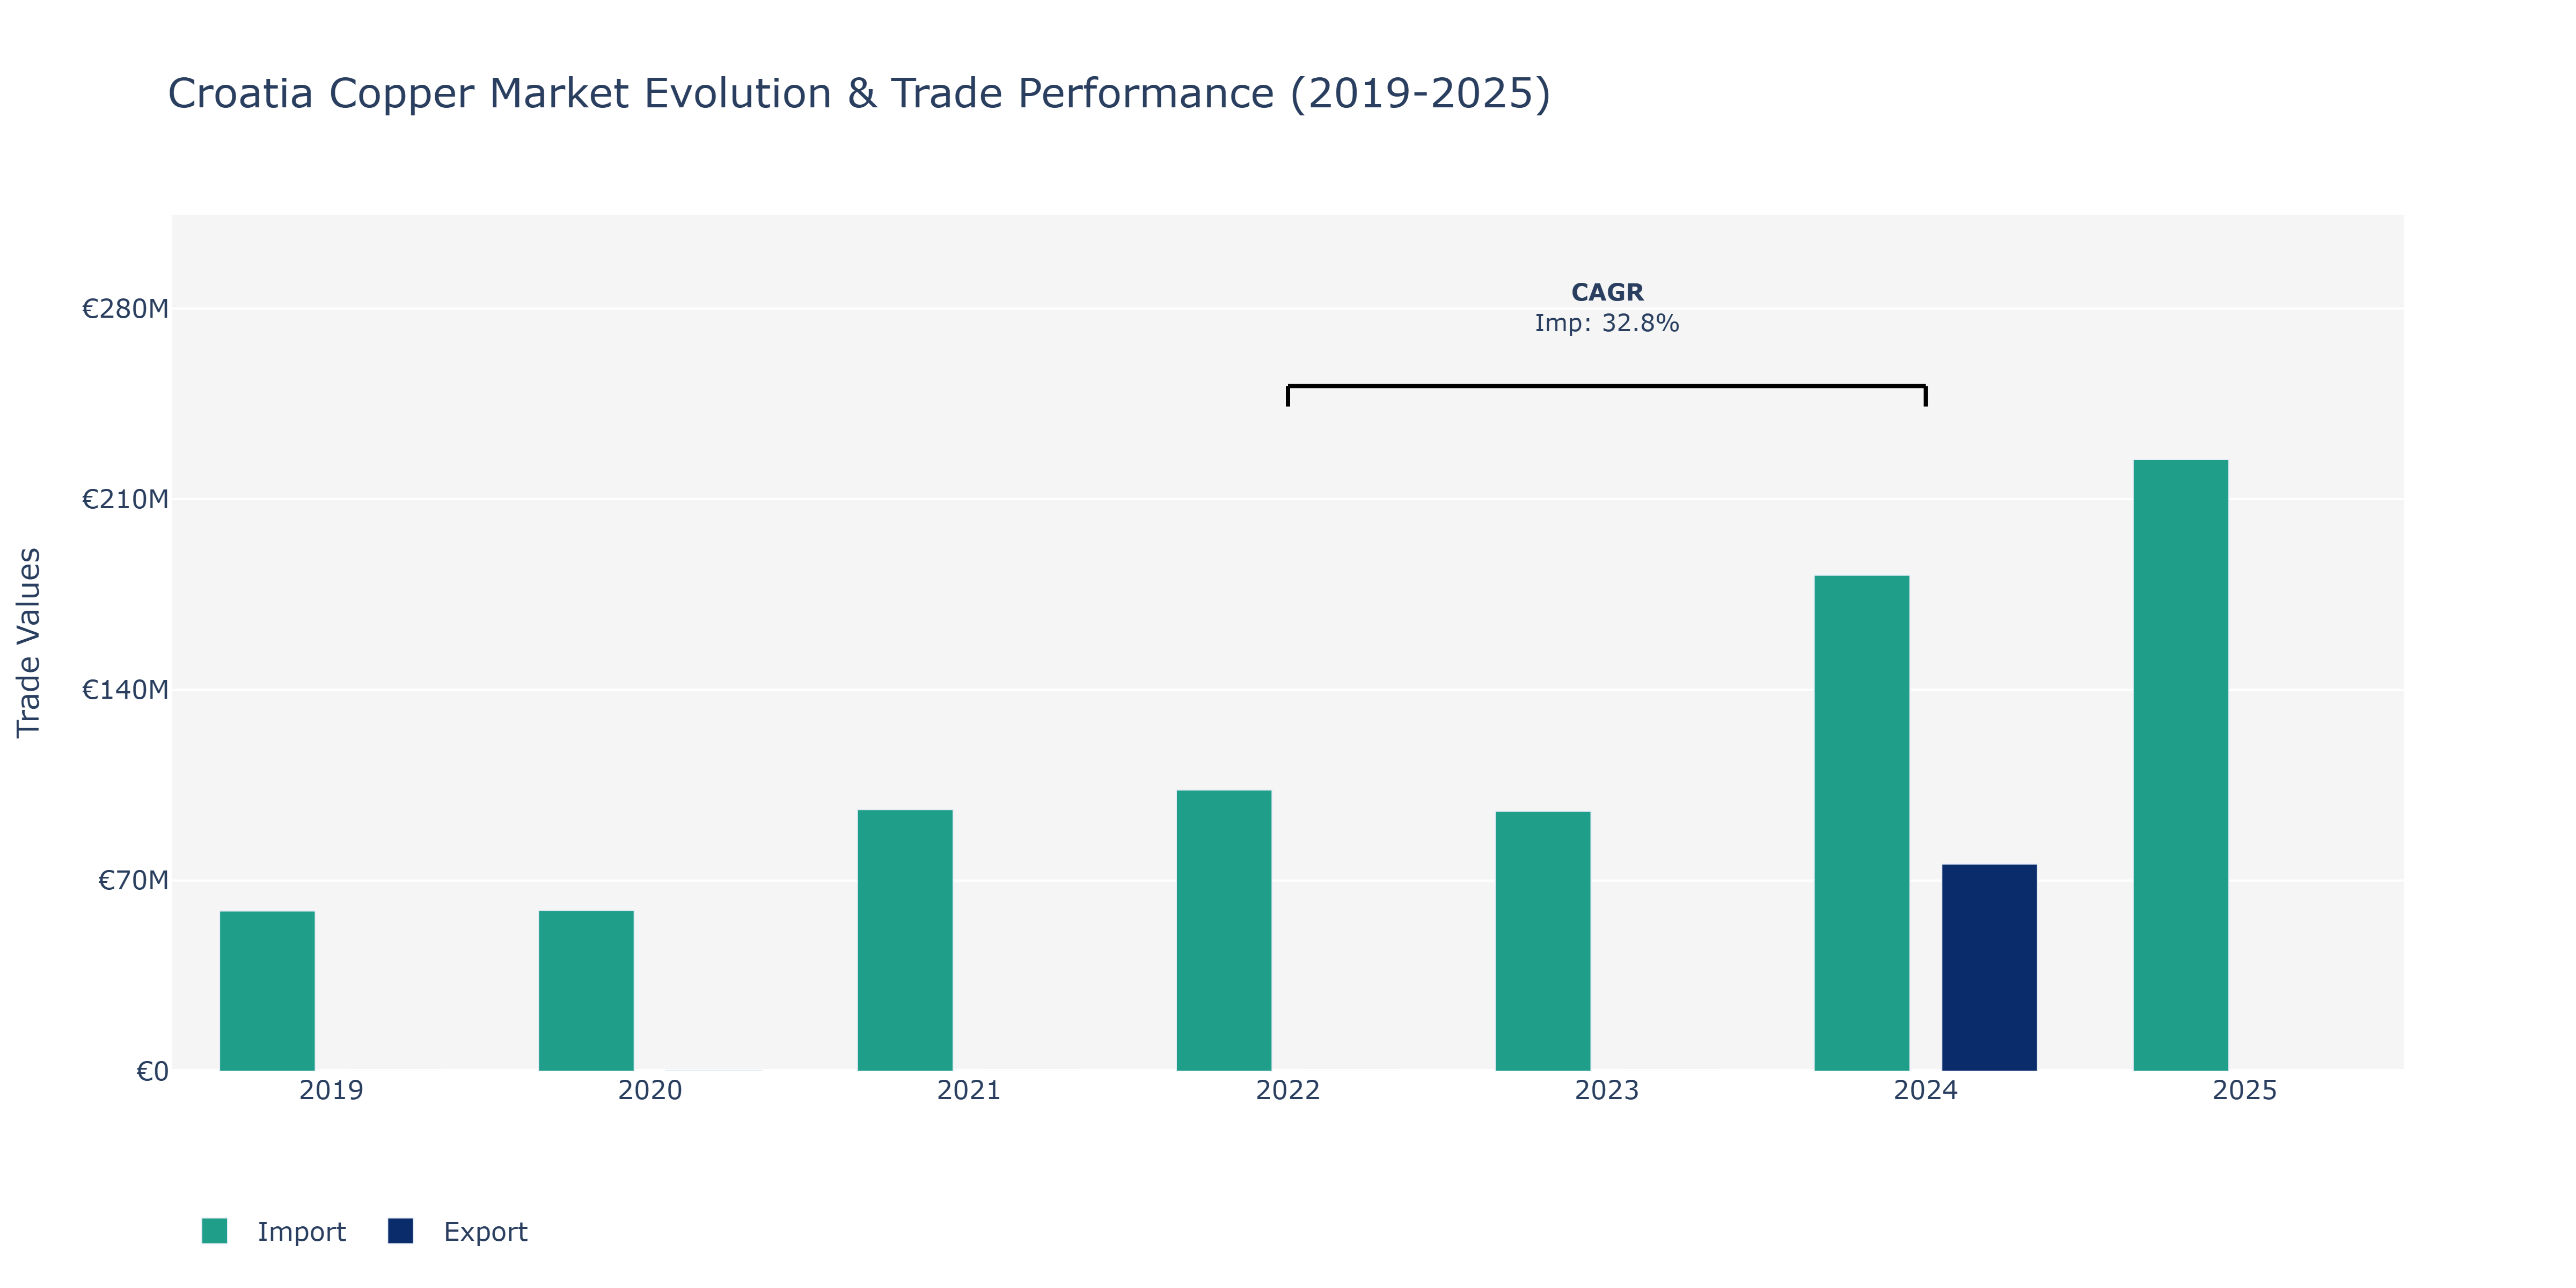
In the Croatia Copper Market, exports showed a noticeable fluctuation over the observed years. Starting at €8.39 thousand in 2019, there was a substantial increase to €274.53 thousand in 2020 before dropping significantly to €19.85 thousand in 2021. The decline continued in 2023 with exports at €11.47 thousand but then saw a substantial rise to €76.06 million in 2024. Such fluctuations can be attributed to global copper demand shifts, geopolitical factors affecting trade patterns, or market-specific supply chain disruptions. On the other hand, imports consistently increased during the period. From €58.8 million in 2019, imports surged to €103.26 million in 2022, with a notable CAGR of 32.79%. The upward trajectory continued reaching €182.06 million in 2024 and peaked at €224.58 million in 2025. These import trends may reflect Croatia's growing industrial activities, infrastructure development, or strategic sourcing decisions in response to market dynamics.
Key Highlights of the Report:
- Croatia Copper Market Outlook
- Market Size of Croatia Copper Market, 2025
- Forecast of Croatia Copper Market, 2032
- Historical Data and Forecast of Croatia Copper Revenues & Volume for the Period 2022 - 2032F
- Croatia Copper Market Trend Evolution
- Croatia Copper Market Drivers and Challenges
- Croatia Copper Price Trends
- Croatia Copper Porter`s Five Forces
- Croatia Copper Industry Life Cycle
- Historical Data and Forecast of Croatia Copper Market Revenues & Volume By Applications for the Period 2022 - 2032F
- Historical Data and Forecast of Croatia Copper Market Revenues & Volume By Building & Construction for the Period 2022 - 2032F
- Historical Data and Forecast of Croatia Copper Market Revenues & Volume By Electrical & Electronics for the Period 2022 - 2032F
- Historical Data and Forecast of Croatia Copper Market Revenues & Volume By Industrial Machinery & Equipment for the Period 2022 - 2032F
- Historical Data and Forecast of Croatia Copper Market Revenues & Volume By Transportation for the Period 2022 - 2032F
- Historical Data and Forecast of Croatia Copper Market Revenues & Volume By Consumer & General Products for the Period 2022 - 2032F
- Historical Data and Forecast of Croatia Copper Market Revenues & Volume By Product Type for the Period 2022 - 2032F
- Historical Data and Forecast of Croatia Copper Market Revenues & Volume By Rods and Wires for the Period 2022 - 2032F
- Historical Data and Forecast of Croatia Copper Market Revenues & Volume By Plates and Strips for the Period 2022 - 2032F
- Historical Data and Forecast of Croatia Copper Market Revenues & Volume By Tubes for the Period 2022 - 2032F
- Historical Data and Forecast of Croatia Copper Market Revenues & Volume By Others for the Period 2022 - 2032F
- Croatia Copper Import Export Trade Statistics
- Market Opportunity Assessment By Applications
- Market Opportunity Assessment By Product Type
- Croatia Copper Top Companies Market Share
- Croatia Copper Competitive Benchmarking By Technical and Operational Parameters
- Croatia Copper Company Profiles
- Croatia Copper Key Strategic Recommendations
Frequently Asked Questions About the Market Study (FAQs):
6Wresearch actively monitors the Croatia Copper Market and publishes its comprehensive annual report, highlighting emerging trends, growth drivers, revenue analysis, and forecast outlook. Our insights help businesses to make data-backed strategic decisions with ongoing market dynamics. Our analysts track relevent industries related to the Croatia Copper Market, allowing our clients with actionable intelligence and reliable forecasts tailored to emerging regional needs.
Yes, we provide customisation as per your requirements. To learn more, feel free to contact us on sales@6wresearch.com
1 Executive Summary |
2 Introduction |
2.1 Key Highlights of the Report |
2.2 Report Description |
2.3 Market Scope & Segmentation |
2.4 Research Methodology |
2.5 Assumptions |
3 Croatia Copper Market Overview |
3.1 Croatia Country Macro Economic Indicators |
3.2 Croatia Copper Market Revenues & Volume, 2022 & 2032F |
3.3 Croatia Copper Market - Industry Life Cycle |
3.4 Croatia Copper Market - Porter's Five Forces |
3.5 Croatia Copper Market Revenues & Volume Share, By Applications, 2022 & 2032F |
3.6 Croatia Copper Market Revenues & Volume Share, By Product Type, 2022 & 2032F |
4 Croatia Copper Market Dynamics |
4.1 Impact Analysis |
4.2 Market Drivers |
4.2.1 Increasing demand for copper in the construction sector in Croatia |
4.2.2 Growth in renewable energy projects driving demand for copper wiring and components |
4.2.3 Government initiatives promoting infrastructure development and modernization |
4.3 Market Restraints |
4.3.1 Volatility in copper prices affecting market stability |
4.3.2 Competition from alternative materials like aluminum impacting market share |
4.3.3 Environmental regulations impacting mining and extraction of copper |
5 Croatia Copper Market Trends |
6 Croatia Copper Market Segmentations |
6.1 Croatia Copper Market, By Applications |
6.1.1 Overview and Analysis |
6.1.2 Croatia Copper Market Revenues & Volume, By Building & Construction, 2022 - 2032F |
6.1.3 Croatia Copper Market Revenues & Volume, By Electrical & Electronics, 2022 - 2032F |
6.1.4 Croatia Copper Market Revenues & Volume, By Industrial Machinery & Equipment, 2022 - 2032F |
6.1.5 Croatia Copper Market Revenues & Volume, By Transportation, 2022 - 2032F |
6.1.6 Croatia Copper Market Revenues & Volume, By Consumer & General Products, 2022 - 2032F |
6.2 Croatia Copper Market, By Product Type |
6.2.1 Overview and Analysis |
6.2.2 Croatia Copper Market Revenues & Volume, By Rods and Wires, 2022 - 2032F |
6.2.3 Croatia Copper Market Revenues & Volume, By Plates and Strips, 2022 - 2032F |
6.2.4 Croatia Copper Market Revenues & Volume, By Tubes, 2022 - 2032F |
6.2.5 Croatia Copper Market Revenues & Volume, By Others, 2022 - 2032F |
7 Croatia Copper Market Import-Export Trade Statistics |
7.1 Croatia Copper Market Export to Major Countries |
7.2 Croatia Copper Market Imports from Major Countries |
8 Croatia Copper Market Key Performance Indicators |
8.1 Percentage increase in copper consumption in the construction sector |
8.2 Number of renewable energy projects utilizing copper components |
8.3 Government expenditure on infrastructure development and modernization |
9 Croatia Copper Market - Opportunity Assessment |
9.1 Croatia Copper Market Opportunity Assessment, By Applications, 2022 & 2032F |
9.2 Croatia Copper Market Opportunity Assessment, By Product Type, 2022 & 2032F |
10 Croatia Copper Market - Competitive Landscape |
10.1 Croatia Copper Market Revenue Share, By Companies, 2025 |
10.2 Croatia Copper Market Competitive Benchmarking, By Operating and Technical Parameters |
11 Company Profiles |
12 Recommendations | 13 Disclaimer |
Global Go To Market Strategy - 2030
Export potential enables firms to identify high-growth global markets with greater confidence by combining advanced trade intelligence with a structured quantitative methodology. The framework analyzes emerging demand trends and country-level import patterns while integrating macroeconomic and trade datasets such as GDP and population forecasts, bilateral import–export flows, tariff structures, elasticity differentials between developed and developing economies, geographic distance, and import demand projections. Using weighted trade values from 2020–2024 as the base period to project country-to-country export potential for 2030, these inputs are operationalized through calculated drivers such as gravity model parameters, tariff impact factors, and projected GDP per-capita growth. Through an analysis of hidden potentials, demand hotspots, and market conditions that are most favorable to success, this method enables firms to focus on target countries, maximize returns, and global expansion with data, backed by accuracy.
By factoring in the projected importer demand gap that is currently unmet and could be potential opportunity, it identifies the potential for the Exporter (Country) among 190 countries, against the general trade analysis, which identifies the biggest importer or exporter.
To discover high-growth global markets and optimize your business strategy:
Click Here
Pricing
- Single User License$ 1,995
- Department License$ 2,400
- Site License$ 3,120
- Global License$ 3,795

Leadership Perspectives from Industry Events
Search
Thought Leadership and Analyst Meet


Our Clients
6WResearch In News
- Doha a strategic location for EV manufacturing hub: IPA Qatar
- Demand for luxury TVs surging in the GCC, says Samsung
- Empowering Growth: The Thriving Journey of Bangladesh’s Cable Industry
- Demand for luxury TVs surging in the GCC, says Samsung
- Video call with a traditional healer? Once unthinkable, it’s now common in South Africa
- Intelligent Buildings To Smooth GCC’s Path To Net Zero
Latest Reports
- Cape Verde Portable Hand-Thrown Extinguisher Market (2026-2032)
- Canada Portable Hand-Thrown Extinguisher Market (2026-2032)
- Cameroon Portable Hand-Thrown Extinguisher Market (2026-2032)
- Burundi Portable Hand-Thrown Extinguisher Market (2026-2032)
- Burkina Faso Portable Hand-Thrown Extinguisher Market (2026-2032)
- Bulgaria Portable Hand-Thrown Extinguisher Market (2026-2032)
- Brunei Portable Hand-Thrown Extinguisher Market (2026-2032)
- Botswana Portable Hand-Thrown Extinguisher Market (2026-2032)
- Bosnia and Herzegovina Portable Hand-Thrown Extinguisher Market (2026-2032)
- Bolivia Portable Hand-Thrown Extinguisher Market (2026-2032)
Industry Events and Analyst Meet

HIMTEX 2026

India Refining Summit 2026

India EV Show 2026

EV tech India Expo 2026

Auto Tech Asia 2026
Whitepaper
- Middle East & Africa Commercial Security Market Click here to view more.
- Middle East & Africa Fire Safety Systems & Equipment Market Click here to view more.
- GCC Drone Market Click here to view more.
- Middle East Lighting Fixture Market Click here to view more.
- GCC Physical & Perimeter Security Market Click here to view more.