Croatia Edible Oils Market (2026-2032) | Analysis, Industry, Growth, Segmentation, Outlook, Share, Size, Value, Revenue, Trends, Companies & Forecast
Market Forecast By Type (Palm Oil, Soybean Oil, Sunflower Oil, Rapeseed Oil, Olive Oil), By Packaging Type (Pouches, Jars, Cans, Bottles), By End Use (Domestic, Food Service , Industrial) And Competitive Landscape
| Product Code: ETC5791089 | Publication Date: Nov 2023 | Updated Date: Apr 2026 | Product Type: Market Research Report | |
| Publisher: 6Wresearch | Author: Ravi Bhandari | No. of Pages: 60 | No. of Figures: 30 | No. of Tables: 5 |
Croatia Edible Oils Market Size (2020-2030)
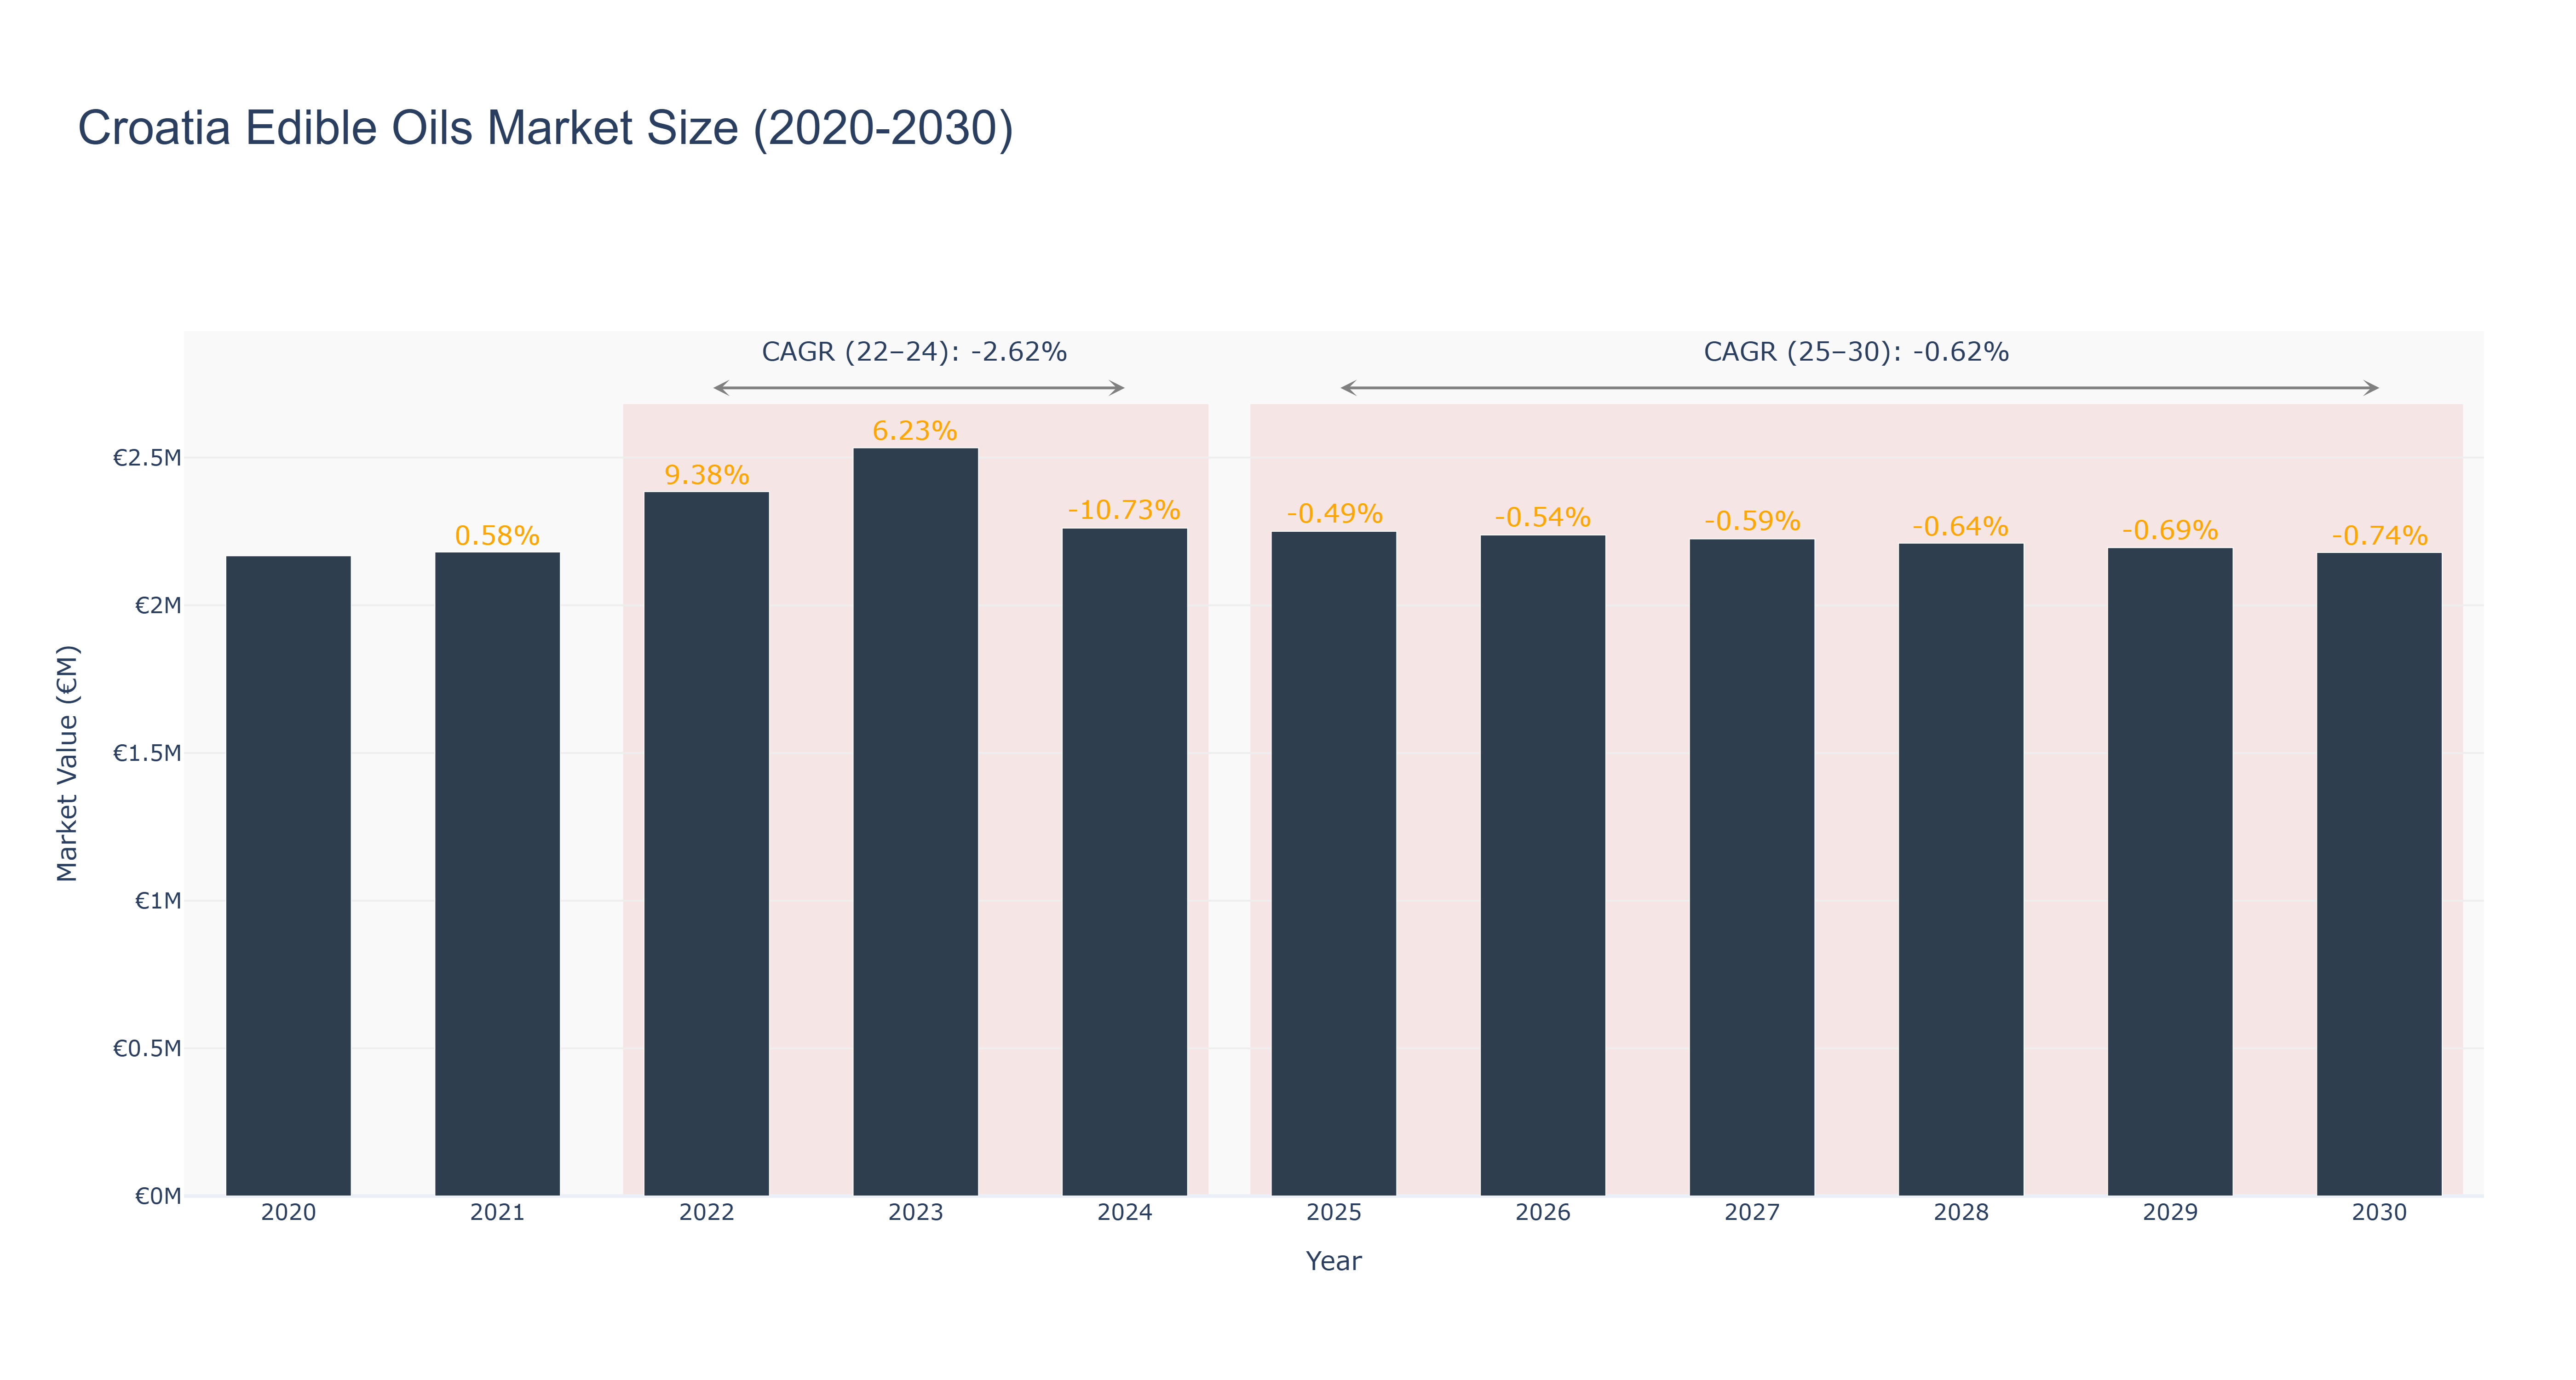
Croatia Edible Oils Market has seen fluctuating trends in recent years. The peak market size was €2.53 million in 2023, followed by a decline to €2.26 million in 2024. The market is forecasted to continue shrinking with a CAGR of -0.62% from 2025 to 2030. The negative growth can be attributed to various factors such as changing consumer preferences towards healthier alternatives and economic uncertainties impacting purchasing power. To counter this trend, industry players are focusing on product innovation and marketing strategies to attract consumers. In the near future, Croatia is set to introduce sustainable practices in edible oil production to align with global sustainability goals. This initiative is expected to drive market growth and enhance competitiveness in the industry.
Croatia Edible Oils Market: Production & Trade Performance (2019-2025)
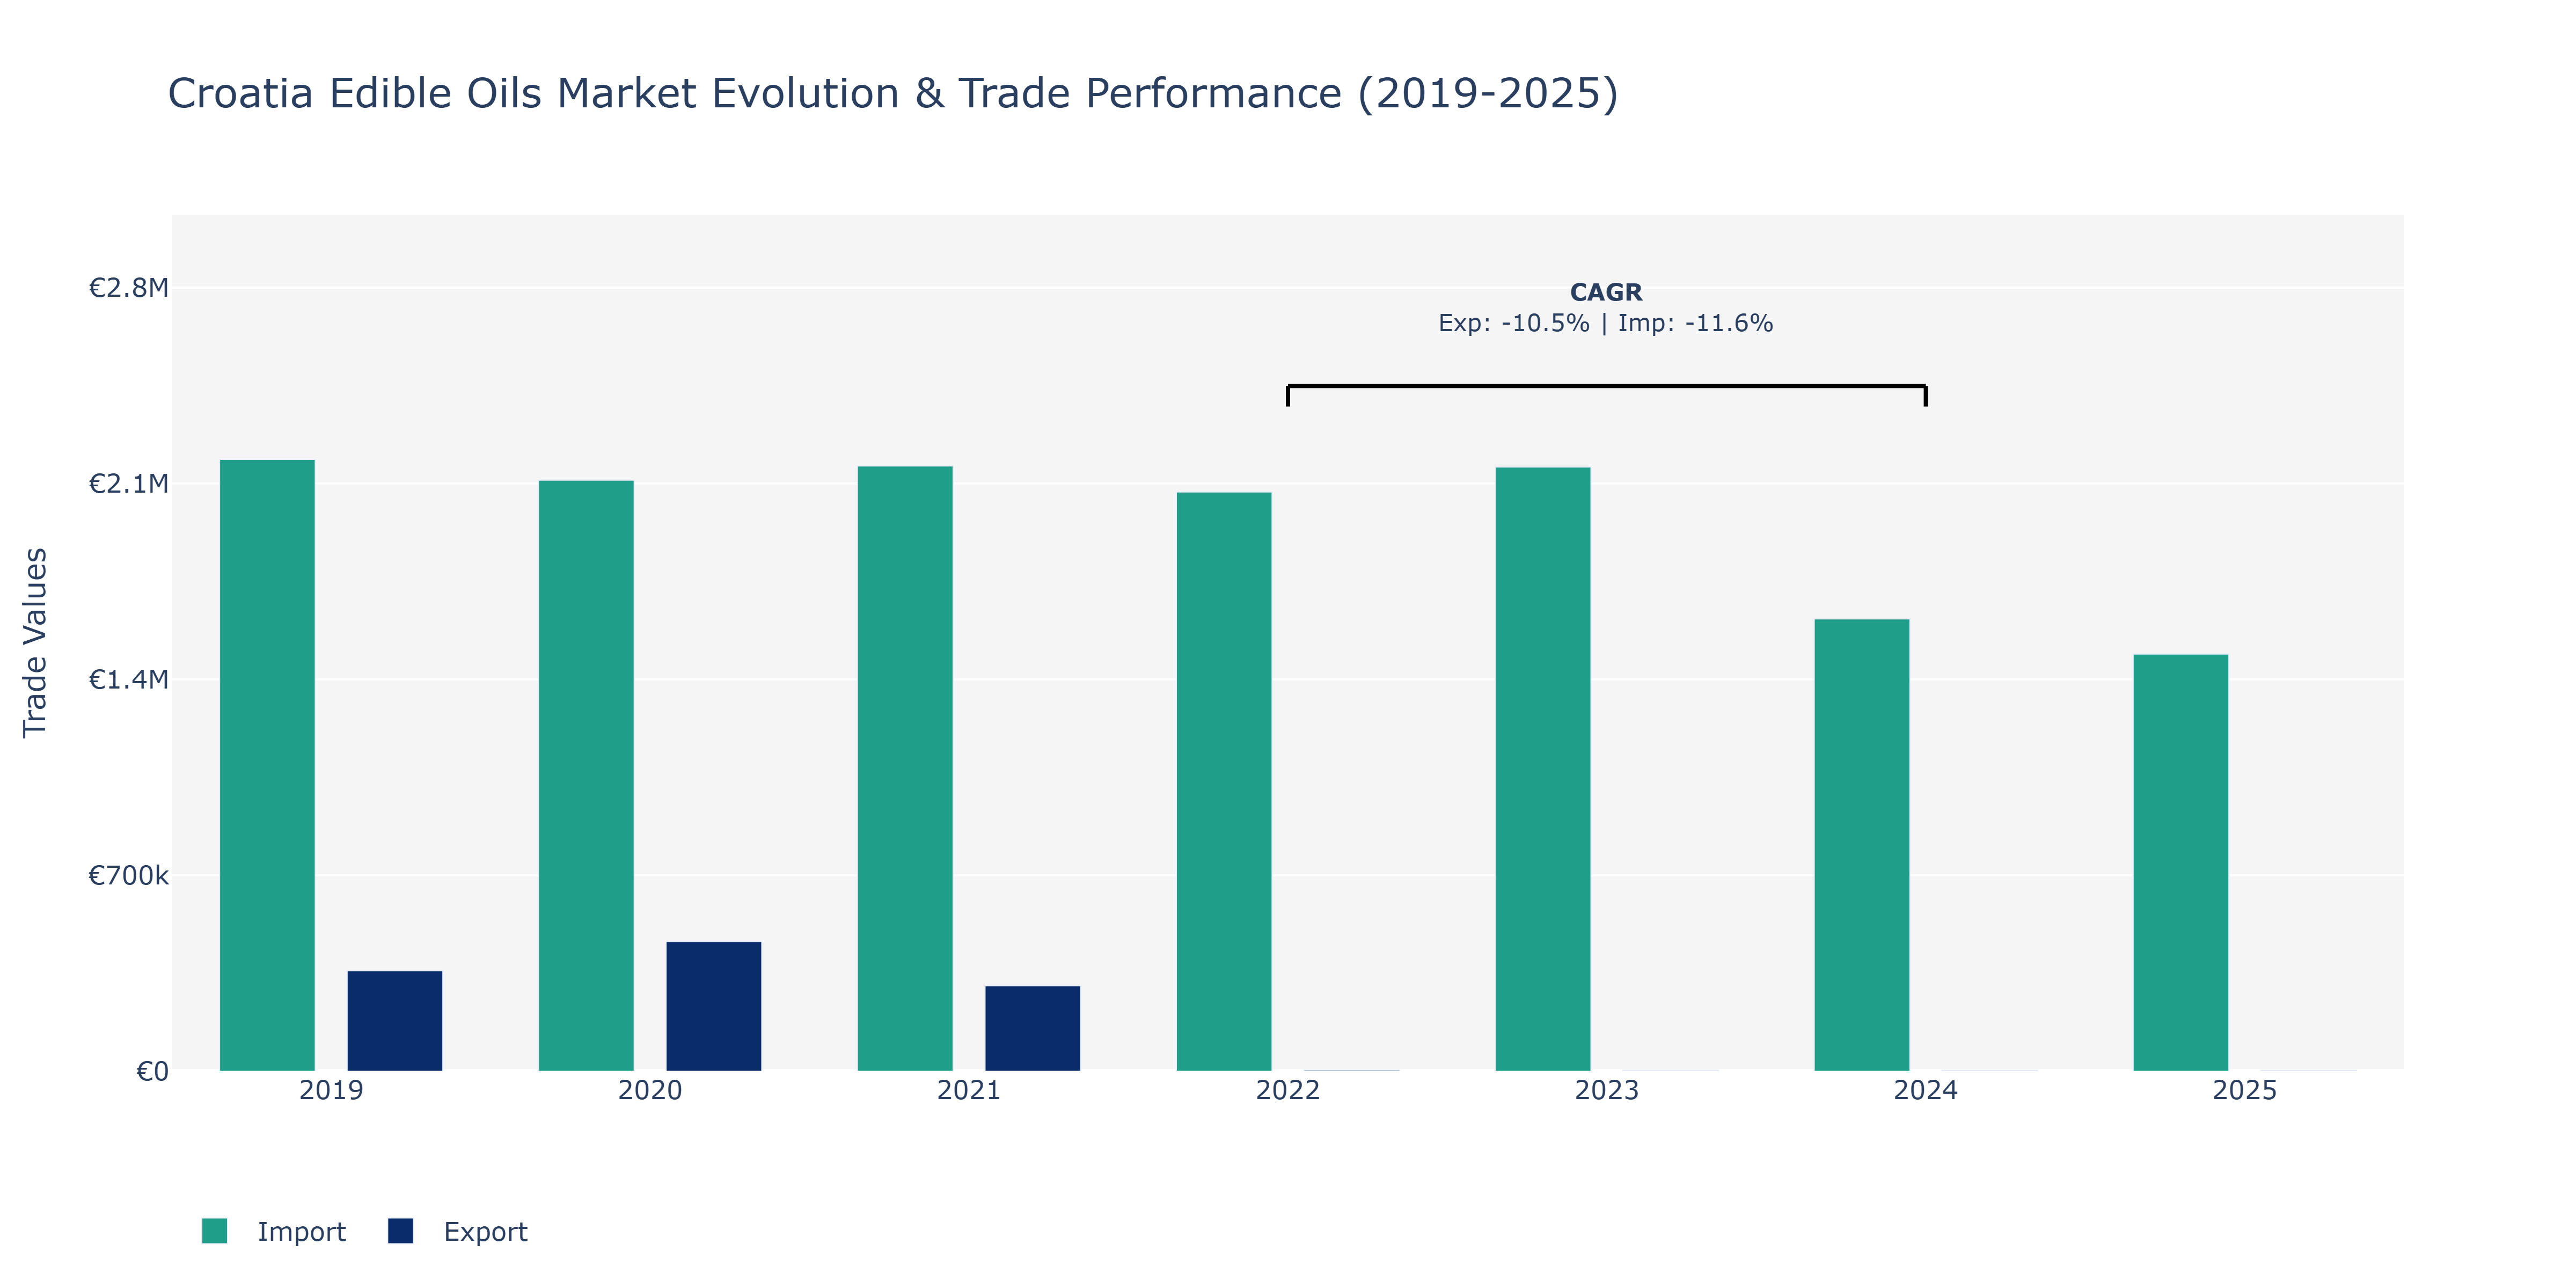
In the Croatia Edible Oils Market, exports experienced fluctuations over the provided years. Starting at €359.01 thousand in 2019, exports saw a notable increase to €463.82 thousand in 2020, before dropping to €305.54 thousand in 2021. The following years witnessed a sharp decline, reaching a mere €3.42 thousand in 2024 and €3.19 thousand in 2025. Conversely, imports displayed a more consistent trend, standing at €2.19 million in 2019, slightly decreasing to €2.11 million in 2020, and then fluctuating around the €2.15 million mark until 2023 before dropping to €1.49 million in 2025. These variations in trade volumes could be attributed to factors such as global market demand, production capacity, international trade policies, and domestic consumption patterns. The negative exports and imports compound annual growth rates of -10.52% and -11.63%, respectively, reflect the challenges faced by the Croatian market during the period and emphasize the need for strategic planning to enhance competitiveness and sustainability in the edible oils sector.
Key Highlights of the Report:
- Croatia Edible Oils Market Outlook
- Market Size of Croatia Edible Oils Market, 2025
- Forecast of Croatia Edible Oils Market, 2032
- Historical Data and Forecast of Croatia Edible Oils Revenues & Volume for the Period 2022 - 2032F
- Croatia Edible Oils Market Trend Evolution
- Croatia Edible Oils Market Drivers and Challenges
- Croatia Edible Oils Price Trends
- Croatia Edible Oils Porter`s Five Forces
- Croatia Edible Oils Industry Life Cycle
- Historical Data and Forecast of Croatia Edible Oils Market Revenues & Volume By Type for the Period 2022 - 2032F
- Historical Data and Forecast of Croatia Edible Oils Market Revenues & Volume By Palm Oil for the Period 2022 - 2032F
- Historical Data and Forecast of Croatia Edible Oils Market Revenues & Volume By Soybean Oil for the Period 2022 - 2032F
- Historical Data and Forecast of Croatia Edible Oils Market Revenues & Volume By Sunflower Oil for the Period 2022 - 2032F
- Historical Data and Forecast of Croatia Edible Oils Market Revenues & Volume By Rapeseed Oil for the Period 2022 - 2032F
- Historical Data and Forecast of Croatia Edible Oils Market Revenues & Volume By Olive Oil for the Period 2022 - 2032F
- Historical Data and Forecast of Croatia Edible Oils Market Revenues & Volume By Packaging Type for the Period 2022 - 2032F
- Historical Data and Forecast of Croatia Edible Oils Market Revenues & Volume By Pouches for the Period 2022 - 2032F
- Historical Data and Forecast of Croatia Edible Oils Market Revenues & Volume By Jars for the Period 2022 - 2032F
- Historical Data and Forecast of Croatia Edible Oils Market Revenues & Volume By Cans for the Period 2022 - 2032F
- Historical Data and Forecast of Croatia Edible Oils Market Revenues & Volume By Bottles for the Period 2022 - 2032F
- Historical Data and Forecast of Croatia Edible Oils Market Revenues & Volume By End Use for the Period 2022 - 2032F
- Historical Data and Forecast of Croatia Edible Oils Market Revenues & Volume By Domestic for the Period 2022 - 2032F
- Historical Data and Forecast of Croatia Edible Oils Market Revenues & Volume By Food Service for the Period 2022 - 2032F
- Historical Data and Forecast of Croatia Edible Oils Market Revenues & Volume By Industrial for the Period 2022 - 2032F
- Croatia Edible Oils Import Export Trade Statistics
- Market Opportunity Assessment By Type
- Market Opportunity Assessment By Packaging Type
- Market Opportunity Assessment By End Use
- Croatia Edible Oils Top Companies Market Share
- Croatia Edible Oils Competitive Benchmarking By Technical and Operational Parameters
- Croatia Edible Oils Company Profiles
- Croatia Edible Oils Key Strategic Recommendations
Frequently Asked Questions About the Market Study (FAQs):
6Wresearch actively monitors the Croatia Edible Oils Market and publishes its comprehensive annual report, highlighting emerging trends, growth drivers, revenue analysis, and forecast outlook. Our insights help businesses to make data-backed strategic decisions with ongoing market dynamics. Our analysts track relevent industries related to the Croatia Edible Oils Market, allowing our clients with actionable intelligence and reliable forecasts tailored to emerging regional needs.
Yes, we provide customisation as per your requirements. To learn more, feel free to contact us on sales@6wresearch.com
1 Executive Summary |
2 Introduction |
2.1 Key Highlights of the Report |
2.2 Report Description |
2.3 Market Scope & Segmentation |
2.4 Research Methodology |
2.5 Assumptions |
3 Croatia Edible Oils Market Overview |
3.1 Croatia Country Macro Economic Indicators |
3.2 Croatia Edible Oils Market Revenues & Volume, 2022 & 2032F |
3.3 Croatia Edible Oils Market - Industry Life Cycle |
3.4 Croatia Edible Oils Market - Porter's Five Forces |
3.5 Croatia Edible Oils Market Revenues & Volume Share, By Type, 2022 & 2032F |
3.6 Croatia Edible Oils Market Revenues & Volume Share, By Packaging Type, 2022 & 2032F |
3.7 Croatia Edible Oils Market Revenues & Volume Share, By End Use, 2022 & 2032F |
4 Croatia Edible Oils Market Dynamics |
4.1 Impact Analysis |
4.2 Market Drivers |
4.2.1 Increasing health awareness among consumers leading to a preference for healthier cooking oils. |
4.2.2 Growth in the food processing industry creating demand for edible oils as an ingredient. |
4.2.3 Rising disposable income and changing consumer lifestyles driving the consumption of convenience foods. |
4.3 Market Restraints |
4.3.1 Fluctuating prices of raw materials impacting the production costs of edible oils. |
4.3.2 Stringent government regulations regarding food safety and quality standards. |
4.3.3 Competition from substitute products like butter and margarine affecting market growth. |
5 Croatia Edible Oils Market Trends |
6 Croatia Edible Oils Market Segmentations |
6.1 Croatia Edible Oils Market, By Type |
6.1.1 Overview and Analysis |
6.1.2 Croatia Edible Oils Market Revenues & Volume, By Palm Oil, 2022 - 2032F |
6.1.3 Croatia Edible Oils Market Revenues & Volume, By Soybean Oil, 2022 - 2032F |
6.1.4 Croatia Edible Oils Market Revenues & Volume, By Sunflower Oil, 2022 - 2032F |
6.1.5 Croatia Edible Oils Market Revenues & Volume, By Rapeseed Oil, 2022 - 2032F |
6.1.6 Croatia Edible Oils Market Revenues & Volume, By Olive Oil, 2022 - 2032F |
6.2 Croatia Edible Oils Market, By Packaging Type |
6.2.1 Overview and Analysis |
6.2.2 Croatia Edible Oils Market Revenues & Volume, By Pouches, 2022 - 2032F |
6.2.3 Croatia Edible Oils Market Revenues & Volume, By Jars, 2022 - 2032F |
6.2.4 Croatia Edible Oils Market Revenues & Volume, By Cans, 2022 - 2032F |
6.2.5 Croatia Edible Oils Market Revenues & Volume, By Bottles, 2022 - 2032F |
6.3 Croatia Edible Oils Market, By End Use |
6.3.1 Overview and Analysis |
6.3.2 Croatia Edible Oils Market Revenues & Volume, By Domestic, 2022 - 2032F |
6.3.3 Croatia Edible Oils Market Revenues & Volume, By Food Service , 2022 - 2032F |
6.3.4 Croatia Edible Oils Market Revenues & Volume, By Industrial, 2022 - 2032F |
7 Croatia Edible Oils Market Import-Export Trade Statistics |
7.1 Croatia Edible Oils Market Export to Major Countries |
7.2 Croatia Edible Oils Market Imports from Major Countries |
8 Croatia Edible Oils Market Key Performance Indicators |
8.1 Average selling price of edible oils in Croatia. |
8.2 Consumer preference for specific types of edible oils (e.g., olive oil, sunflower oil). |
8.3 Growth in the number of retail outlets offering a variety of edible oils. |
9 Croatia Edible Oils Market - Opportunity Assessment |
9.1 Croatia Edible Oils Market Opportunity Assessment, By Type, 2022 & 2032F |
9.2 Croatia Edible Oils Market Opportunity Assessment, By Packaging Type, 2022 & 2032F |
9.3 Croatia Edible Oils Market Opportunity Assessment, By End Use, 2022 & 2032F |
10 Croatia Edible Oils Market - Competitive Landscape |
10.1 Croatia Edible Oils Market Revenue Share, By Companies, 2025 |
10.2 Croatia Edible Oils Market Competitive Benchmarking, By Operating and Technical Parameters |
11 Company Profiles |
12 Recommendations | 13 Disclaimer |
Global Go To Market Strategy - 2030
Export potential enables firms to identify high-growth global markets with greater confidence by combining advanced trade intelligence with a structured quantitative methodology. The framework analyzes emerging demand trends and country-level import patterns while integrating macroeconomic and trade datasets such as GDP and population forecasts, bilateral import–export flows, tariff structures, elasticity differentials between developed and developing economies, geographic distance, and import demand projections. Using weighted trade values from 2020–2024 as the base period to project country-to-country export potential for 2030, these inputs are operationalized through calculated drivers such as gravity model parameters, tariff impact factors, and projected GDP per-capita growth. Through an analysis of hidden potentials, demand hotspots, and market conditions that are most favorable to success, this method enables firms to focus on target countries, maximize returns, and global expansion with data, backed by accuracy.
By factoring in the projected importer demand gap that is currently unmet and could be potential opportunity, it identifies the potential for the Exporter (Country) among 190 countries, against the general trade analysis, which identifies the biggest importer or exporter.
To discover high-growth global markets and optimize your business strategy:
Click Here
Pricing
- Single User License$ 1,995
- Department License$ 2,400
- Site License$ 3,120
- Global License$ 3,795

Leadership Perspectives from Industry Events
Search
Thought Leadership and Analyst Meet


Our Clients
6WResearch In News
- India Export Attractiveness Tracker 2026
- India Air Conditioner Market Set for Strong Rebound in 2026 After Weather-Led Correction and GST-Driven Recovery: 6Wresearch
- ADAS in India: How Automatic Emergency Braking, Blind Spot Detection & Driver Monitoring are Transforming Road Safety
- Doha a strategic location for EV manufacturing hub: IPA Qatar
- Demand for luxury TVs surging in the GCC, says Samsung
- Empowering Growth: The Thriving Journey of Bangladesh’s Cable Industry
Latest Reports
- Nicaragua RPG Gaming Market (2026-2032)
- New Zealand RPG Gaming Market (2026-2032)
- Netherlands RPG Gaming Market (2026-2032)
- Nauru RPG Gaming Market (2026-2032)
- Namibia RPG Gaming Market (2026-2032)
- Mozambique RPG Gaming Market (2026-2032)
- Montenegro RPG Gaming Market (2026-2032)
- Mongolia RPG Gaming Market (2026-2032)
- Monaco RPG Gaming Market (2026-2032)
- Micronesia RPG Gaming Market (2026-2032)
Industry Events and Analyst Meet

EV India Expo 2026

HIMTEX 2026

India Refining Summit 2026

India EV Show 2026

EV tech India Expo 2026
Whitepaper
- Middle East & Africa Commercial Security Market Click here to view more.
- Middle East & Africa Fire Safety Systems & Equipment Market Click here to view more.
- GCC Drone Market Click here to view more.
- Middle East Lighting Fixture Market Click here to view more.
- GCC Physical & Perimeter Security Market Click here to view more.