Croatia Hydrazine Market (2026-2032) | Outlook, Value, Forecast, Segmentation, Growth, Trends, Size, Companies, Share, Revenue, Industry & Analysis
Market Forecast By Type (Hydrazine Hydrate, Hydrazine Nitrate, Hydrazine Sulfate, Other Types), By Application (Corrosion Inhibitor, Explosives, Medicinal Ingredient, Rocket Fuel, Precursor to Pesticides, Blowing Agent, Other Applications), By End-users (Pharmaceuticals, Agrochemicals, Industrial, Other End-user Industries) And Competitive Landscape
| Product Code: ETC4741472 | Publication Date: Nov 2023 | Updated Date: Apr 2026 | Product Type: Market Research Report | |
| Publisher: 6Wresearch | Author: Shubham Padhi | No. of Pages: 60 | No. of Figures: 30 | No. of Tables: 5 |
Croatia Hydrazine Market Size (2020-2030)
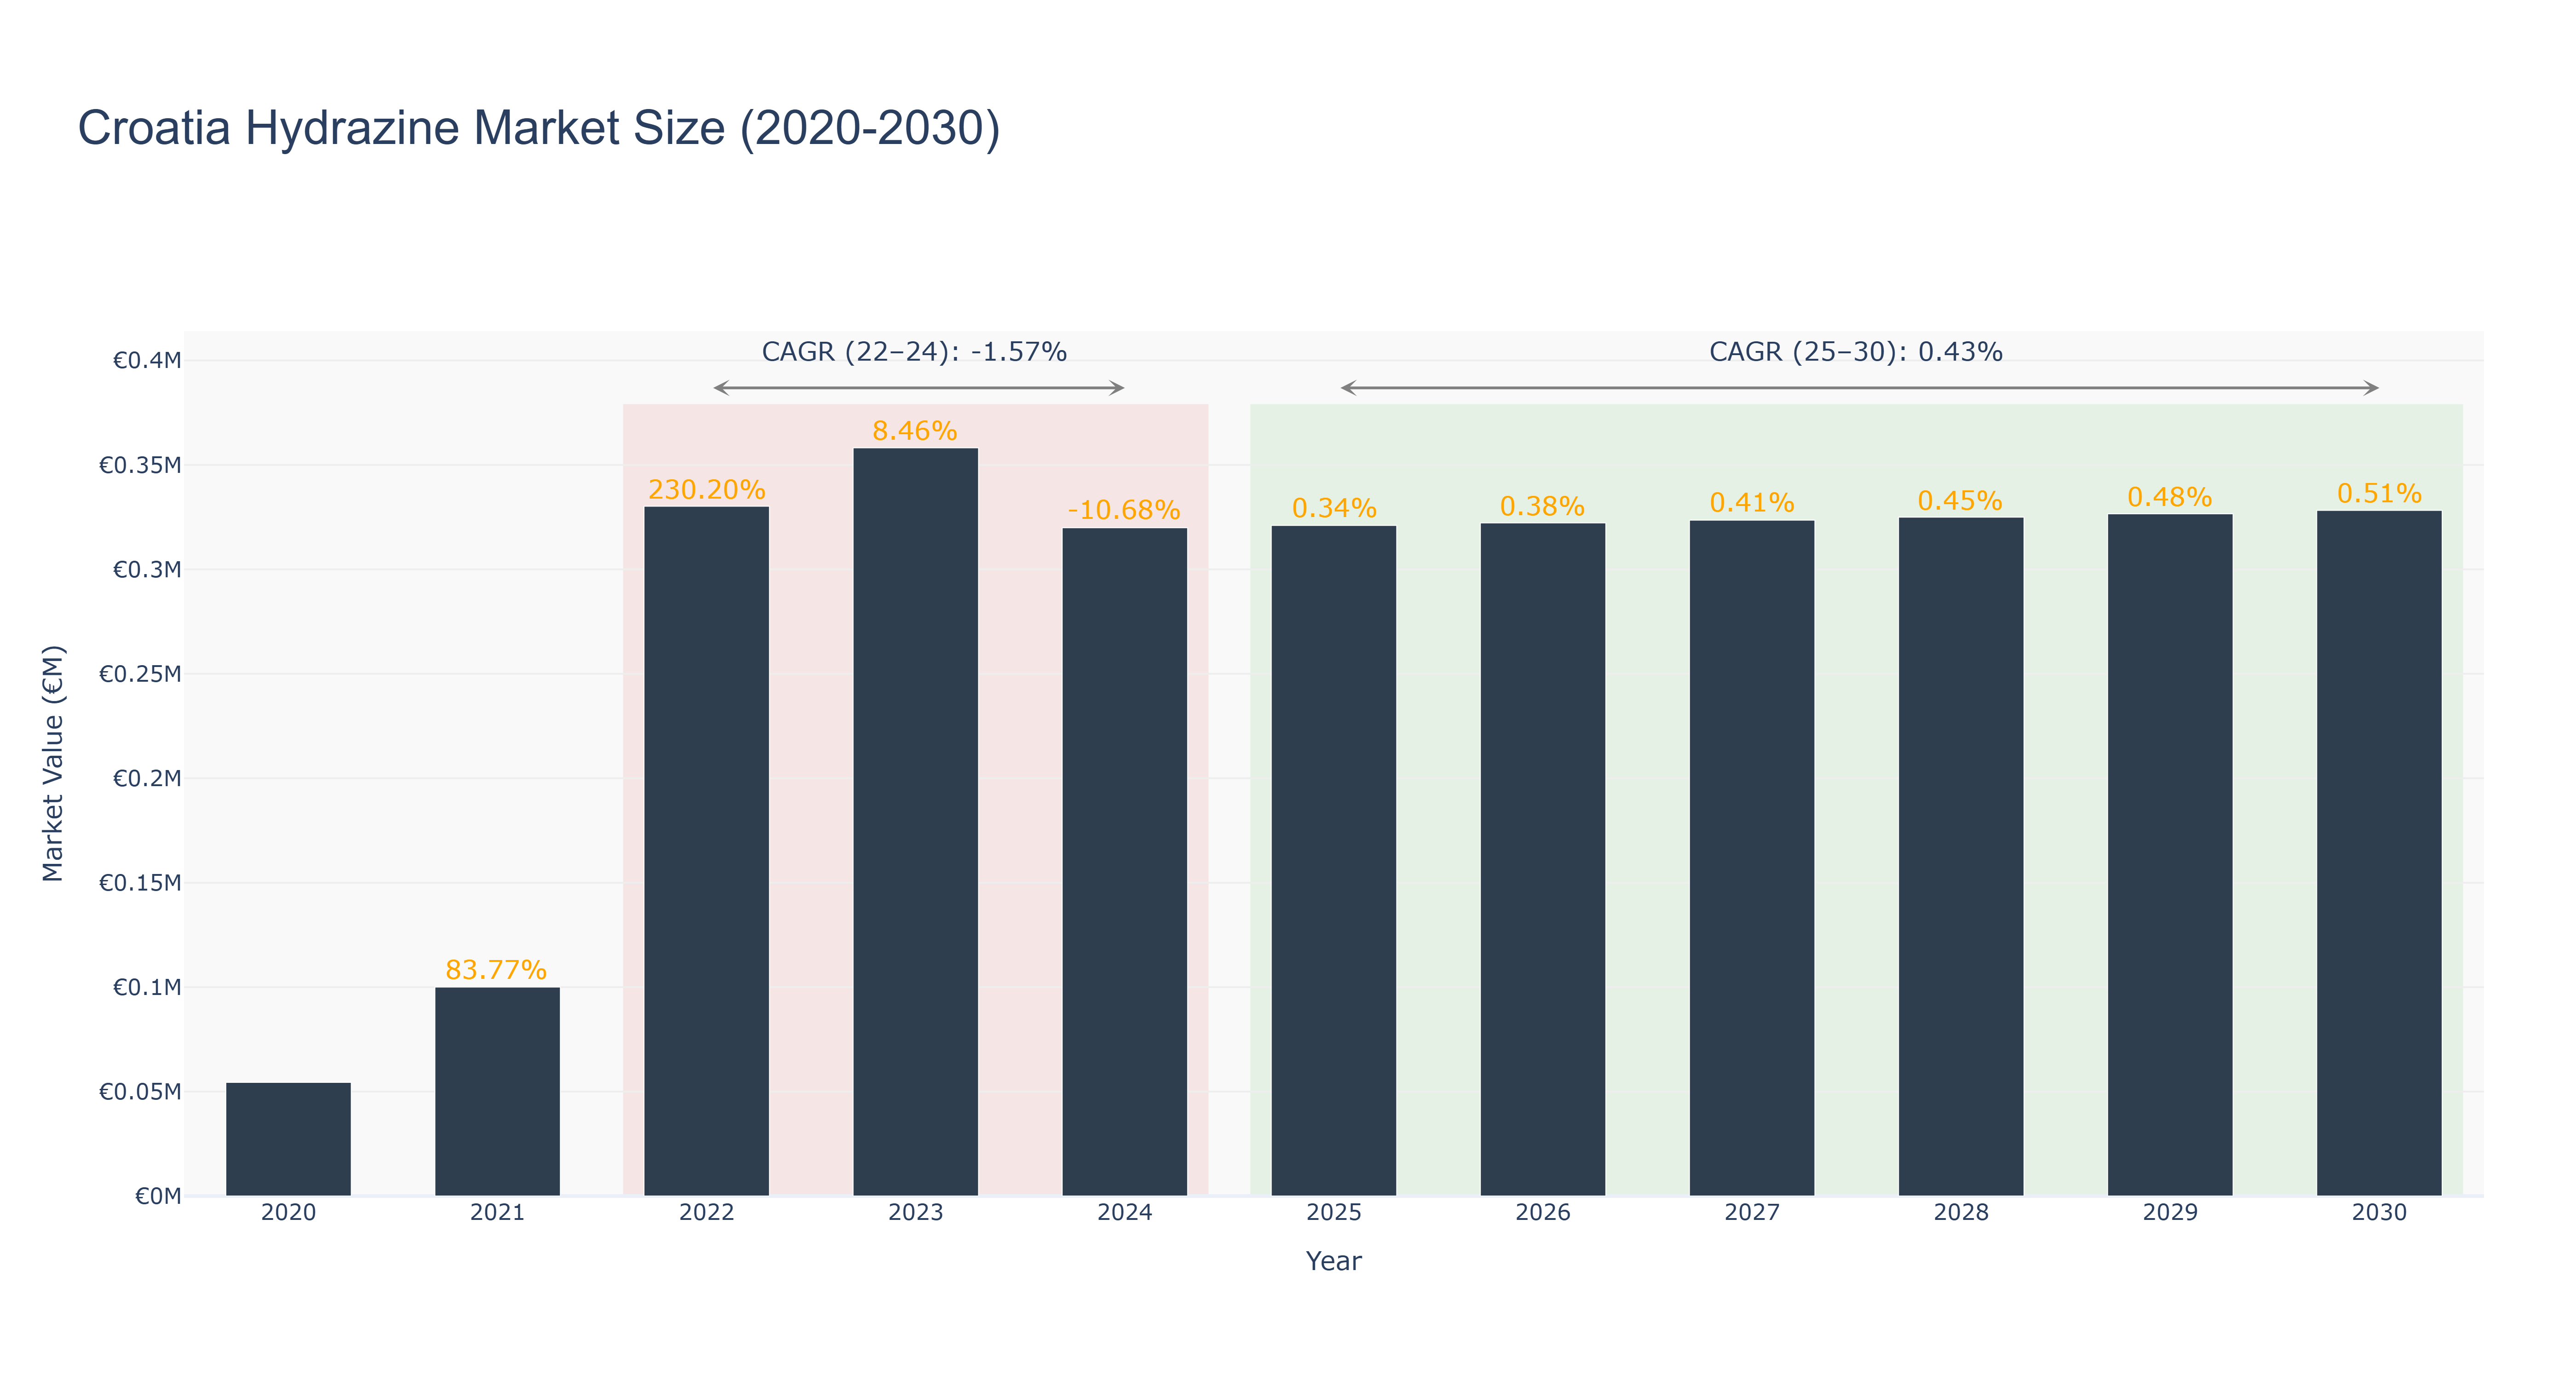
Croatia Hydrazine Market has shown a fluctuating trend over the years. The peak market size of €0.36 million was recorded in 2023, followed by a slight decline in 2024 to €0.32 million. The market is forecasted to remain stable from 2025 to 2030, with a consistent market size of €0.32-0.33 million. The CAGR for the period 2022-24 was -1.57%, reflecting a temporary downturn, while the CAGR for 2025-30 is projected to be 0.43%, indicating a modest growth trajectory. The market experienced a decline in 2024 possibly due to certain economic factors, but the stable growth from 2025 onwards could be attributed to increasing demand for hydrazine in various industries. Looking ahead, Croatia is planning to invest in renewable energy projects to reduce dependency on traditional sources, which could positively impact the hydrazine market.
Croatia Hydrazine Market: Production & Trade Performance (2019-2025)
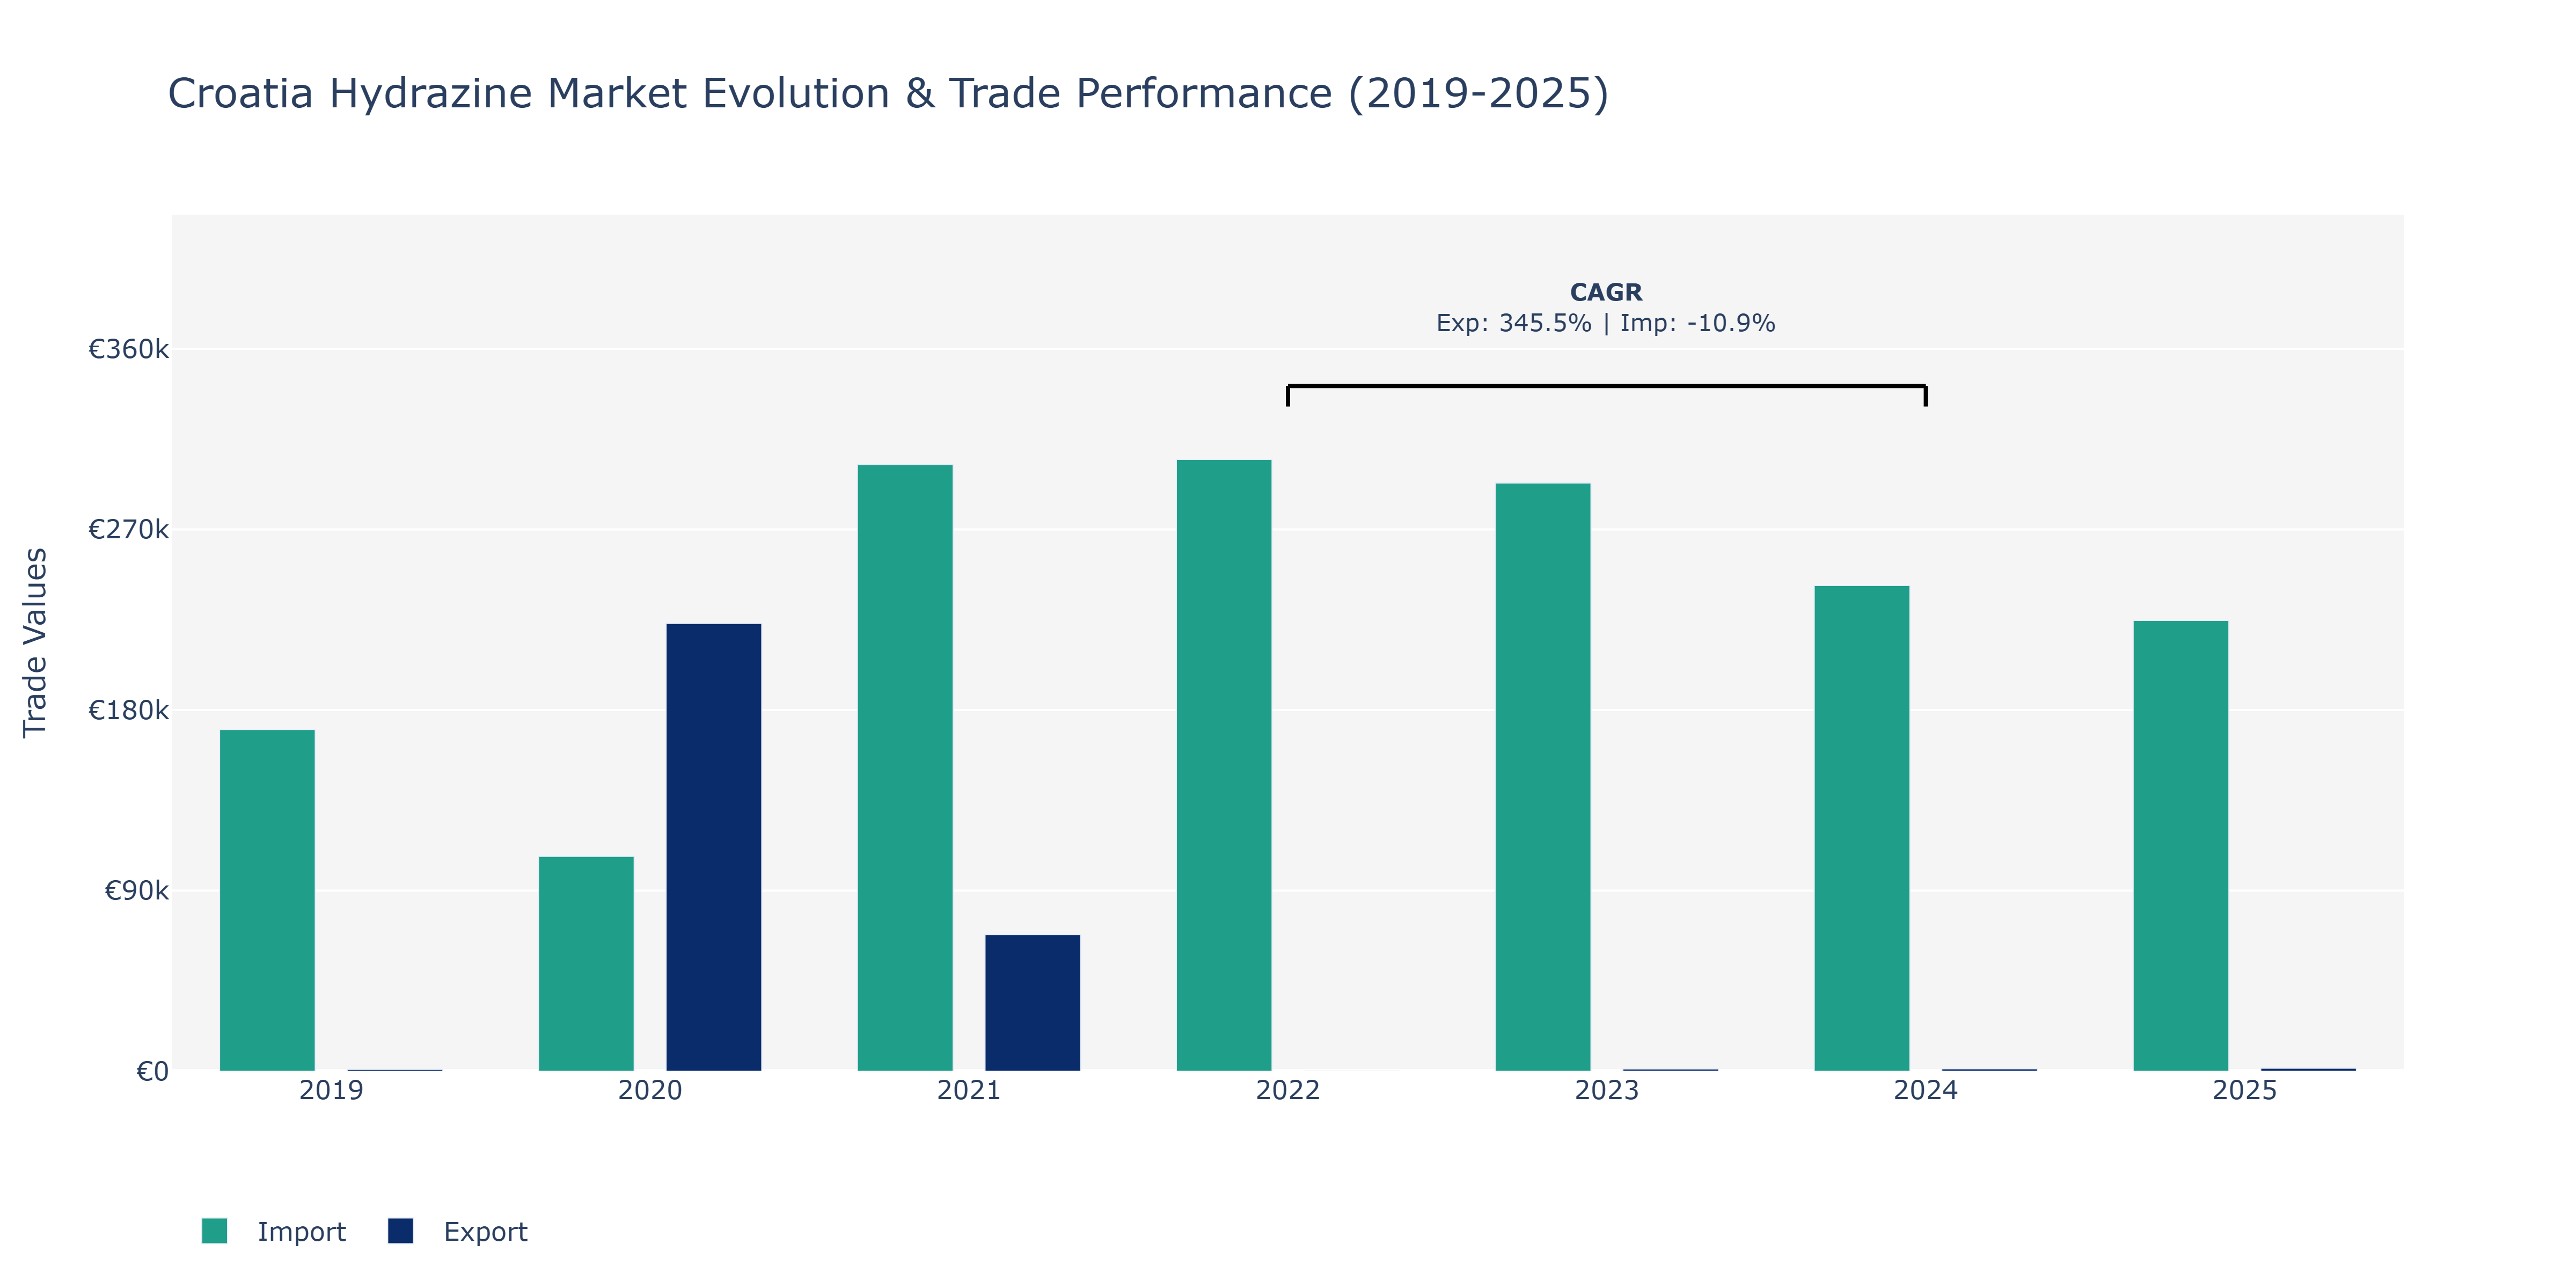
In the Croatia Hydrazine Market, exports demonstrated a notable fluctuation over the years, with a peak in 2020 at €223.15 thousand, followed by a substantial decline in subsequent years. Imports, on the other hand, steadily increased from €170.29 thousand in 2019 to €304.89 thousand in 2022, before experiencing a slight decrease. The peak import value was recorded in 2021 at €302.34 thousand. The fluctuations in exports can be attributed to varying global demand for hydrazine-based products, potentially influenced by changes in consumer preferences or shifts in the chemical industry's dynamics. The consistent rise in imports until 2022 suggests a growing reliance on foreign hydrazine sources, possibly due to domestic production constraints or specific quality requirements. These trends indicate the market's sensitivity to external factors impacting trade dynamics and underline the importance of strategic sourcing decisions for industry players in the Croatia Hydrazine Market.
Key Highlights of the Report:
- Croatia Hydrazine Market Outlook
- Market Size of Croatia Hydrazine Market, 2025
- Forecast of Croatia Hydrazine Market, 2032
- Historical Data and Forecast of Croatia Hydrazine Revenues & Volume for the Period 2022 - 2032F
- Croatia Hydrazine Market Trend Evolution
- Croatia Hydrazine Market Drivers and Challenges
- Croatia Hydrazine Price Trends
- Croatia Hydrazine Porter`s Five Forces
- Croatia Hydrazine Industry Life Cycle
- Historical Data and Forecast of Croatia Hydrazine Market Revenues & Volume By Type for the Period 2022 - 2032F
- Historical Data and Forecast of Croatia Hydrazine Market Revenues & Volume By Hydrazine Hydrate for the Period 2022 - 2032F
- Historical Data and Forecast of Croatia Hydrazine Market Revenues & Volume By Hydrazine Nitrate for the Period 2022 - 2032F
- Historical Data and Forecast of Croatia Hydrazine Market Revenues & Volume By Hydrazine Sulfate for the Period 2022 - 2032F
- Historical Data and Forecast of Croatia Hydrazine Market Revenues & Volume By Other Types for the Period 2022 - 2032F
- Historical Data and Forecast of Croatia Hydrazine Market Revenues & Volume By Application for the Period 2022 - 2032F
- Historical Data and Forecast of Croatia Hydrazine Market Revenues & Volume By Corrosion Inhibitor for the Period 2022 - 2032F
- Historical Data and Forecast of Croatia Hydrazine Market Revenues & Volume By Explosives for the Period 2022 - 2032F
- Historical Data and Forecast of Croatia Hydrazine Market Revenues & Volume By Medicinal Ingredient for the Period 2022 - 2032F
- Historical Data and Forecast of Croatia Hydrazine Market Revenues & Volume By Rocket Fuel for the Period 2022 - 2032F
- Historical Data and Forecast of Croatia Hydrazine Market Revenues & Volume By Precursor to Pesticides for the Period 2022 - 2032F
- Historical Data and Forecast of Croatia Hydrazine Market Revenues & Volume By Blowing Agent for the Period 2022 - 2032F
- Historical Data and Forecast of Croatia Hydrazine Market Revenues & Volume By Other Applications for the Period 2022 - 2032F
- Historical Data and Forecast of Croatia Hydrazine Market Revenues & Volume By End-users for the Period 2022 - 2032F
- Historical Data and Forecast of Croatia Hydrazine Market Revenues & Volume By Pharmaceuticals for the Period 2022 - 2032F
- Historical Data and Forecast of Croatia Hydrazine Market Revenues & Volume By Agrochemicals for the Period 2022 - 2032F
- Historical Data and Forecast of Croatia Hydrazine Market Revenues & Volume By Industrial for the Period 2022 - 2032F
- Historical Data and Forecast of Croatia Hydrazine Market Revenues & Volume By Other End-user Industries for the Period 2022 - 2032F
- Croatia Hydrazine Import Export Trade Statistics
- Market Opportunity Assessment By Type
- Market Opportunity Assessment By Application
- Market Opportunity Assessment By End-users
- Croatia Hydrazine Top Companies Market Share
- Croatia Hydrazine Competitive Benchmarking By Technical and Operational Parameters
- Croatia Hydrazine Company Profiles
- Croatia Hydrazine Key Strategic Recommendations
Frequently Asked Questions About the Market Study (FAQs):
6Wresearch actively monitors the Croatia Hydrazine Market and publishes its comprehensive annual report, highlighting emerging trends, growth drivers, revenue analysis, and forecast outlook. Our insights help businesses to make data-backed strategic decisions with ongoing market dynamics. Our analysts track relevent industries related to the Croatia Hydrazine Market, allowing our clients with actionable intelligence and reliable forecasts tailored to emerging regional needs.
Yes, we provide customisation as per your requirements. To learn more, feel free to contact us on sales@6wresearch.com
1 Executive Summary |
2 Introduction |
2.1 Key Highlights of the Report |
2.2 Report Description |
2.3 Market Scope & Segmentation |
2.4 Research Methodology |
2.5 Assumptions |
3 Croatia Hydrazine Market Overview |
3.1 Croatia Country Macro Economic Indicators |
3.2 Croatia Hydrazine Market Revenues & Volume, 2022 & 2032F |
3.3 Croatia Hydrazine Market - Industry Life Cycle |
3.4 Croatia Hydrazine Market - Porter's Five Forces |
3.5 Croatia Hydrazine Market Revenues & Volume Share, By Type, 2022 & 2032F |
3.6 Croatia Hydrazine Market Revenues & Volume Share, By Application, 2022 & 2032F |
3.7 Croatia Hydrazine Market Revenues & Volume Share, By End-users, 2022 & 2032F |
4 Croatia Hydrazine Market Dynamics |
4.1 Impact Analysis |
4.2 Market Drivers |
4.2.1 Increasing demand for hydrazine for various industrial applications in Croatia |
4.2.2 Growing emphasis on the use of hydrazine in the agriculture sector for crop protection |
4.2.3 Rising investments in research and development activities for hydrazine-based products |
4.3 Market Restraints |
4.3.1 Stringent regulations and environmental concerns regarding the use of hydrazine |
4.3.2 Volatility in raw material prices impacting production costs |
4.3.3 Competition from alternative chemicals and substitutes affecting market growth |
5 Croatia Hydrazine Market Trends |
6 Croatia Hydrazine Market Segmentations |
6.1 Croatia Hydrazine Market, By Type |
6.1.1 Overview and Analysis |
6.1.2 Croatia Hydrazine Market Revenues & Volume, By Hydrazine Hydrate, 2022 - 2032F |
6.1.3 Croatia Hydrazine Market Revenues & Volume, By Hydrazine Nitrate, 2022 - 2032F |
6.1.4 Croatia Hydrazine Market Revenues & Volume, By Hydrazine Sulfate, 2022 - 2032F |
6.1.5 Croatia Hydrazine Market Revenues & Volume, By Other Types, 2022 - 2032F |
6.2 Croatia Hydrazine Market, By Application |
6.2.1 Overview and Analysis |
6.2.2 Croatia Hydrazine Market Revenues & Volume, By Corrosion Inhibitor, 2022 - 2032F |
6.2.3 Croatia Hydrazine Market Revenues & Volume, By Explosives, 2022 - 2032F |
6.2.4 Croatia Hydrazine Market Revenues & Volume, By Medicinal Ingredient, 2022 - 2032F |
6.2.5 Croatia Hydrazine Market Revenues & Volume, By Rocket Fuel, 2022 - 2032F |
6.2.6 Croatia Hydrazine Market Revenues & Volume, By Precursor to Pesticides, 2022 - 2032F |
6.2.7 Croatia Hydrazine Market Revenues & Volume, By Blowing Agent, 2022 - 2032F |
6.3 Croatia Hydrazine Market, By End-users |
6.3.1 Overview and Analysis |
6.3.2 Croatia Hydrazine Market Revenues & Volume, By Pharmaceuticals, 2022 - 2032F |
6.3.3 Croatia Hydrazine Market Revenues & Volume, By Agrochemicals, 2022 - 2032F |
6.3.4 Croatia Hydrazine Market Revenues & Volume, By Industrial, 2022 - 2032F |
6.3.5 Croatia Hydrazine Market Revenues & Volume, By Other End-user Industries, 2022 - 2032F |
7 Croatia Hydrazine Market Import-Export Trade Statistics |
7.1 Croatia Hydrazine Market Export to Major Countries |
7.2 Croatia Hydrazine Market Imports from Major Countries |
8 Croatia Hydrazine Market Key Performance Indicators |
8.1 Number of new hydrazine product launches in the Croatian market |
8.2 Percentage increase in hydrazine usage in industrial applications annually |
8.3 Research and development expenditure dedicated to hydrazine innovations in Croatia |
9 Croatia Hydrazine Market - Opportunity Assessment |
9.1 Croatia Hydrazine Market Opportunity Assessment, By Type, 2022 & 2032F |
9.2 Croatia Hydrazine Market Opportunity Assessment, By Application, 2022 & 2032F |
9.3 Croatia Hydrazine Market Opportunity Assessment, By End-users, 2022 & 2032F |
10 Croatia Hydrazine Market - Competitive Landscape |
10.1 Croatia Hydrazine Market Revenue Share, By Companies, 2025 |
10.2 Croatia Hydrazine Market Competitive Benchmarking, By Operating and Technical Parameters |
11 Company Profiles |
12 Recommendations | 13 Disclaimer |
Global Go To Market Strategy - 2030
Export potential enables firms to identify high-growth global markets with greater confidence by combining advanced trade intelligence with a structured quantitative methodology. The framework analyzes emerging demand trends and country-level import patterns while integrating macroeconomic and trade datasets such as GDP and population forecasts, bilateral import–export flows, tariff structures, elasticity differentials between developed and developing economies, geographic distance, and import demand projections. Using weighted trade values from 2020–2024 as the base period to project country-to-country export potential for 2030, these inputs are operationalized through calculated drivers such as gravity model parameters, tariff impact factors, and projected GDP per-capita growth. Through an analysis of hidden potentials, demand hotspots, and market conditions that are most favorable to success, this method enables firms to focus on target countries, maximize returns, and global expansion with data, backed by accuracy.
By factoring in the projected importer demand gap that is currently unmet and could be potential opportunity, it identifies the potential for the Exporter (Country) among 190 countries, against the general trade analysis, which identifies the biggest importer or exporter.
To discover high-growth global markets and optimize your business strategy:
Click Here
Pricing
- Single User License$ 1,995
- Department License$ 2,400
- Site License$ 3,120
- Global License$ 3,795

Leadership Perspectives from Industry Events
Search
Thought Leadership and Analyst Meet


Our Clients
6WResearch In News
- India Air Conditioner Market Set for Strong Rebound in 2026 After Weather-Led Correction and GST-Driven Recovery: 6Wresearch
- ADAS in India: How Automatic Emergency Braking, Blind Spot Detection & Driver Monitoring are Transforming Road Safety
- Doha a strategic location for EV manufacturing hub: IPA Qatar
- Demand for luxury TVs surging in the GCC, says Samsung
- Empowering Growth: The Thriving Journey of Bangladesh’s Cable Industry
- Demand for luxury TVs surging in the GCC, says Samsung
Latest Reports
- Poland Fire Protection Systems Market (2026-2032)
- Cape Verde Portable Hand-Thrown Extinguisher Market (2026-2032)
- Canada Portable Hand-Thrown Extinguisher Market (2026-2032)
- Cameroon Portable Hand-Thrown Extinguisher Market (2026-2032)
- Burundi Portable Hand-Thrown Extinguisher Market (2026-2032)
- Burkina Faso Portable Hand-Thrown Extinguisher Market (2026-2032)
- Bulgaria Portable Hand-Thrown Extinguisher Market (2026-2032)
- Brunei Portable Hand-Thrown Extinguisher Market (2026-2032)
- Botswana Portable Hand-Thrown Extinguisher Market (2026-2032)
- Bosnia and Herzegovina Portable Hand-Thrown Extinguisher Market (2026-2032)
Industry Events and Analyst Meet

HIMTEX 2026

India Refining Summit 2026

India EV Show 2026

EV tech India Expo 2026

Auto Tech Asia 2026
Whitepaper
- Middle East & Africa Commercial Security Market Click here to view more.
- Middle East & Africa Fire Safety Systems & Equipment Market Click here to view more.
- GCC Drone Market Click here to view more.
- Middle East Lighting Fixture Market Click here to view more.
- GCC Physical & Perimeter Security Market Click here to view more.