Croatia Industrial Chain Market (2026-2032) | Companies, Pricing Analysis, Outlook, Trends, Competition, Strategy, Value, Forecast, Analysis, Share, Strategic Insights, Size, Competitive, Supply, Consumer Insights, Demand, Segments, Opportunities, Industry, Revenue, Segmentation, Restraints, Drivers, Growth, Investment Trends, Challenges
Market Forecast By Chain Type (Roller Chains, Leaf Chains, Silent Chains, Engineered Chains), By Material Used (Stainless Steel, Carbon Steel, Alloy Steel, Nickel-Plated Steel), By Application (Conveyor Systems, Power Transmission, Lifting Applications, Mining & Drilling), By End User (Manufacturing, Automotive, Construction, Oil & Gas), By Sales Model (Direct Sales, Distributors, Online Suppliers, Industrial Suppliers) And Competitive Landscape
| Product Code: ETC12478613 | Publication Date: Apr 2025 | Updated Date: Apr 2026 | Product Type: Market Research Report | |
| Publisher: 6Wresearch | No. of Pages: 65 | No. of Figures: 34 | No. of Tables: 19 | |
Croatia Industrial Chain Market Size (2020-2030)
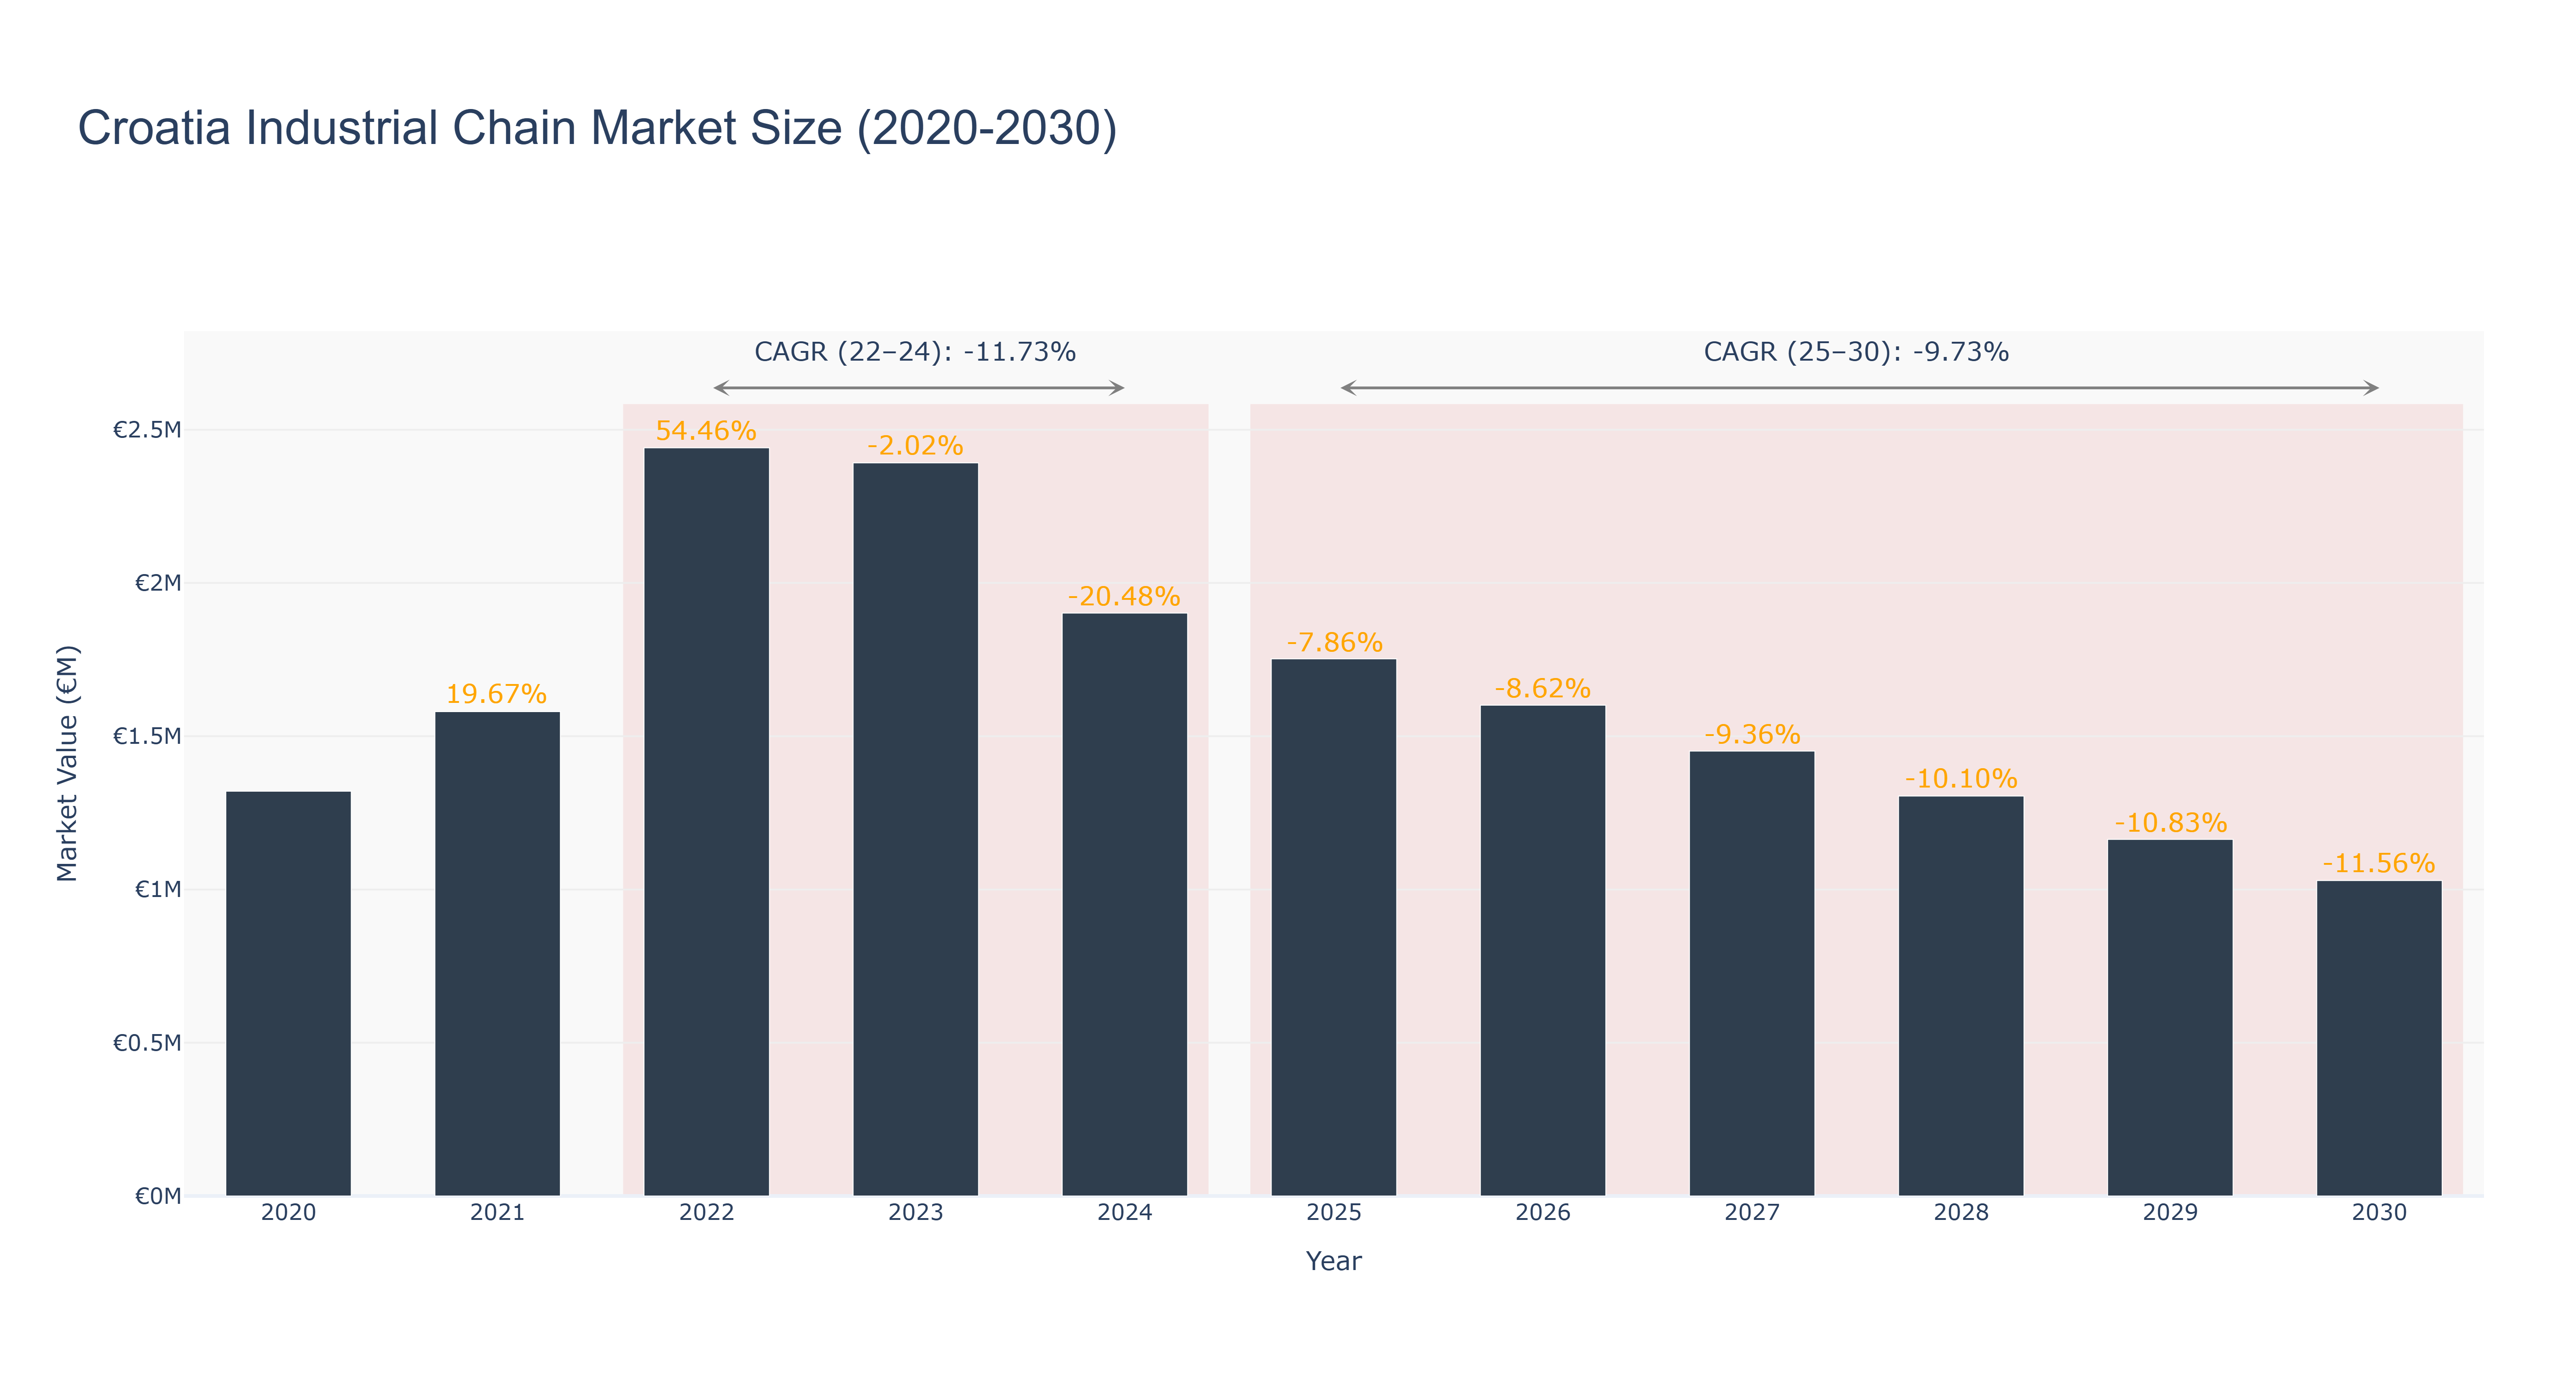
Croatia Industrial Chain Market has experienced fluctuations in market size over the years. The peak market size of €2.44 million was reached in 2022, followed by a decline to €1.90 million in 2024. The forecasted market size is expected to continue decreasing from €1.75 million in 2025 to €1.03 million in 2030, with CAGR values of -11.73% (2022-24) and -9.73% (2025-30). The market faced challenges due to economic uncertainties and changing consumer preferences, leading to the downward trend. However, recent developments in sustainable supply chain practices are expected to drive future growth in the Croatia Industrial Chain Market. Initiatives focusing on enhancing efficiency and reducing environmental impact will likely shape the market landscape in the coming years, providing opportunities for innovation and expansion.
Croatia Industrial Chain Market: Production & Trade Performance (2019-2025)
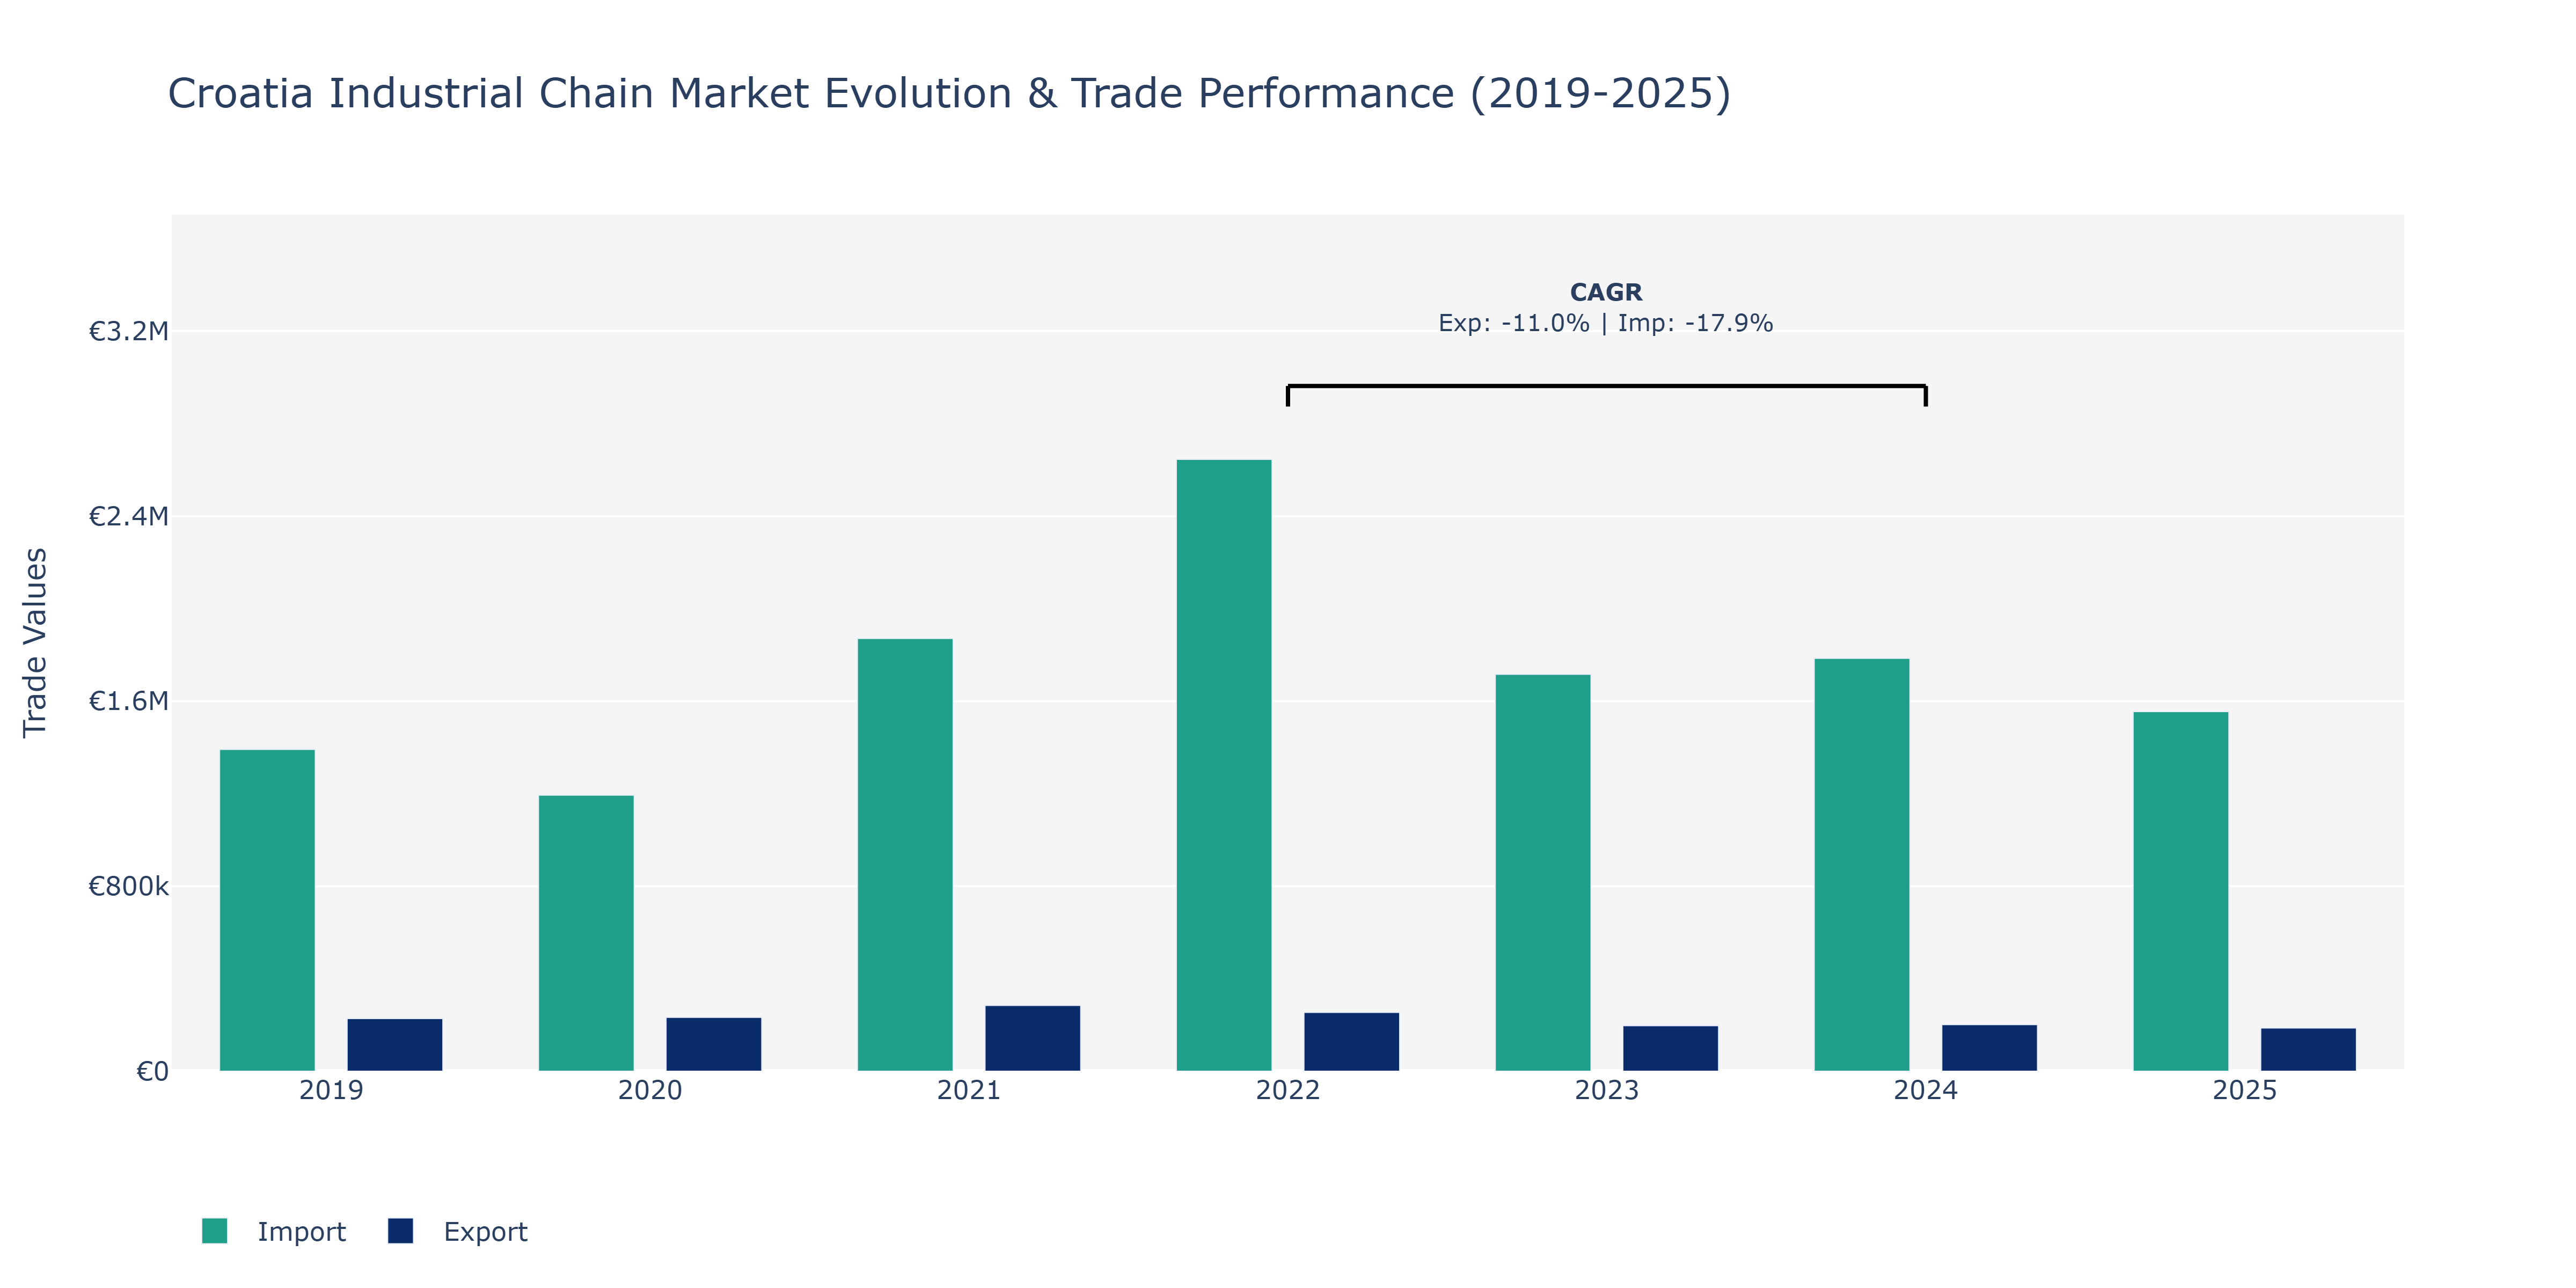
In the Croatia Industrial Chain Market, exports and imports followed distinct trajectories from 2019 to 2025. Exports exhibited fluctuations, starting at €227.6 thousand in 2019, reaching a peak of €284.22 thousand in 2021, and then decreasing to €186.63 thousand in 2025. The peak in 2021 could be attributed to increased global demand for Croatian industrial chain products. Conversely, imports showed a more consistent trend, decreasing from €1.39 million in 2019 to €1.56 million in 2025. The decline in imports might be influenced by local initiatives to boost domestic production or changes in international trade dynamics impacting Croatian industrial chain imports. Despite a negative CAGR for both exports and imports in the period 2022-2024, the market maintained resilience amidst economic challenges. Going forward, strategies focusing on enhancing export competitiveness and diversifying import sources could be pivotal for sustaining growth in the Croatia Industrial Chain Market.
Key Highlights of the Report:
- Croatia Industrial Chain Market Outlook
- Market Size of Croatia Industrial Chain Market, 2025
- Forecast of Croatia Industrial Chain Market, 2032
- Historical Data and Forecast of Croatia Industrial Chain Revenues & Volume for the Period 2022 - 2032F
- Croatia Industrial Chain Market Trend Evolution
- Croatia Industrial Chain Market Drivers and Challenges
- Croatia Industrial Chain Price Trends
- Croatia Industrial Chain Porter's Five Forces
- Croatia Industrial Chain Industry Life Cycle
- Historical Data and Forecast of Croatia Industrial Chain Market Revenues & Volume By Chain Type for the Period 2022 - 2032F
- Historical Data and Forecast of Croatia Industrial Chain Market Revenues & Volume By Roller Chains for the Period 2022 - 2032F
- Historical Data and Forecast of Croatia Industrial Chain Market Revenues & Volume By Leaf Chains for the Period 2022 - 2032F
- Historical Data and Forecast of Croatia Industrial Chain Market Revenues & Volume By Silent Chains for the Period 2022 - 2032F
- Historical Data and Forecast of Croatia Industrial Chain Market Revenues & Volume By Engineered Chains for the Period 2022 - 2032F
- Historical Data and Forecast of Croatia Industrial Chain Market Revenues & Volume By Material Used for the Period 2022 - 2032F
- Historical Data and Forecast of Croatia Industrial Chain Market Revenues & Volume By Stainless Steel for the Period 2022 - 2032F
- Historical Data and Forecast of Croatia Industrial Chain Market Revenues & Volume By Carbon Steel for the Period 2022 - 2032F
- Historical Data and Forecast of Croatia Industrial Chain Market Revenues & Volume By Alloy Steel for the Period 2022 - 2032F
- Historical Data and Forecast of Croatia Industrial Chain Market Revenues & Volume By Nickel-Plated Steel for the Period 2022 - 2032F
- Historical Data and Forecast of Croatia Industrial Chain Market Revenues & Volume By Application for the Period 2022 - 2032F
- Historical Data and Forecast of Croatia Industrial Chain Market Revenues & Volume By Conveyor Systems for the Period 2022 - 2032F
- Historical Data and Forecast of Croatia Industrial Chain Market Revenues & Volume By Power Transmission for the Period 2022 - 2032F
- Historical Data and Forecast of Croatia Industrial Chain Market Revenues & Volume By Lifting Applications for the Period 2022 - 2032F
- Historical Data and Forecast of Croatia Industrial Chain Market Revenues & Volume By Mining & Drilling for the Period 2022 - 2032F
- Historical Data and Forecast of Croatia Industrial Chain Market Revenues & Volume By End User for the Period 2022 - 2032F
- Historical Data and Forecast of Croatia Industrial Chain Market Revenues & Volume By Manufacturing for the Period 2022 - 2032F
- Historical Data and Forecast of Croatia Industrial Chain Market Revenues & Volume By Automotive for the Period 2022 - 2032F
- Historical Data and Forecast of Croatia Industrial Chain Market Revenues & Volume By Construction for the Period 2022 - 2032F
- Historical Data and Forecast of Croatia Industrial Chain Market Revenues & Volume By Oil & Gas for the Period 2022 - 2032F
- Historical Data and Forecast of Croatia Industrial Chain Market Revenues & Volume By Sales Model for the Period 2022 - 2032F
- Historical Data and Forecast of Croatia Industrial Chain Market Revenues & Volume By Direct Sales for the Period 2022 - 2032F
- Historical Data and Forecast of Croatia Industrial Chain Market Revenues & Volume By Distributors for the Period 2022 - 2032F
- Historical Data and Forecast of Croatia Industrial Chain Market Revenues & Volume By Online Suppliers for the Period 2022 - 2032F
- Historical Data and Forecast of Croatia Industrial Chain Market Revenues & Volume By Industrial Suppliers for the Period 2022 - 2032F
- Croatia Industrial Chain Import Export Trade Statistics
- Market Opportunity Assessment By Chain Type
- Market Opportunity Assessment By Material Used
- Market Opportunity Assessment By Application
- Market Opportunity Assessment By End User
- Market Opportunity Assessment By Sales Model
- Croatia Industrial Chain Top Companies Market Share
- Croatia Industrial Chain Competitive Benchmarking By Technical and Operational Parameters
- Croatia Industrial Chain Company Profiles
- Croatia Industrial Chain Key Strategic Recommendations
Frequently Asked Questions About the Market Study (FAQs):
6Wresearch actively monitors the Croatia Industrial Chain Market and publishes its comprehensive annual report, highlighting emerging trends, growth drivers, revenue analysis, and forecast outlook. Our insights help businesses to make data-backed strategic decisions with ongoing market dynamics. Our analysts track relevent industries related to the Croatia Industrial Chain Market, allowing our clients with actionable intelligence and reliable forecasts tailored to emerging regional needs.
Yes, we provide customisation as per your requirements. To learn more, feel free to contact us on sales@6wresearch.com
1 Executive Summary |
2 Introduction |
2.1 Key Highlights of the Report |
2.2 Report Description |
2.3 Market Scope & Segmentation |
2.4 Research Methodology |
2.5 Assumptions |
3 Croatia Industrial Chain Market Overview |
3.1 Croatia Country Macro Economic Indicators |
3.2 Croatia Industrial Chain Market Revenues & Volume, 2022 & 2032F |
3.3 Croatia Industrial Chain Market - Industry Life Cycle |
3.4 Croatia Industrial Chain Market - Porter's Five Forces |
3.5 Croatia Industrial Chain Market Revenues & Volume Share, By Chain Type, 2022 & 2032F |
3.6 Croatia Industrial Chain Market Revenues & Volume Share, By Material Used, 2022 & 2032F |
3.7 Croatia Industrial Chain Market Revenues & Volume Share, By Application, 2022 & 2032F |
3.8 Croatia Industrial Chain Market Revenues & Volume Share, By End User, 2022 & 2032F |
3.9 Croatia Industrial Chain Market Revenues & Volume Share, By Sales Model, 2022 & 2032F |
4 Croatia Industrial Chain Market Dynamics |
4.1 Impact Analysis |
4.2 Market Drivers |
4.2.1 Increasing industrialization in Croatia |
4.2.2 Growth in the manufacturing sector |
4.2.3 Government initiatives to promote industrial development |
4.3 Market Restraints |
4.3.1 Economic instability in Croatia |
4.3.2 Lack of skilled labor in the industrial sector |
4.3.3 Competition from international industrial chain manufacturers |
5 Croatia Industrial Chain Market Trends |
6 Croatia Industrial Chain Market, By Types |
6.1 Croatia Industrial Chain Market, By Chain Type |
6.1.1 Overview and Analysis |
6.1.2 Croatia Industrial Chain Market Revenues & Volume, By Chain Type, 2022 - 2032F |
6.1.3 Croatia Industrial Chain Market Revenues & Volume, By Roller Chains, 2022 - 2032F |
6.1.4 Croatia Industrial Chain Market Revenues & Volume, By Leaf Chains, 2022 - 2032F |
6.1.5 Croatia Industrial Chain Market Revenues & Volume, By Silent Chains, 2022 - 2032F |
6.1.6 Croatia Industrial Chain Market Revenues & Volume, By Engineered Chains, 2022 - 2032F |
6.2 Croatia Industrial Chain Market, By Material Used |
6.2.1 Overview and Analysis |
6.2.2 Croatia Industrial Chain Market Revenues & Volume, By Stainless Steel, 2022 - 2032F |
6.2.3 Croatia Industrial Chain Market Revenues & Volume, By Carbon Steel, 2022 - 2032F |
6.2.4 Croatia Industrial Chain Market Revenues & Volume, By Alloy Steel, 2022 - 2032F |
6.2.5 Croatia Industrial Chain Market Revenues & Volume, By Nickel-Plated Steel, 2022 - 2032F |
6.3 Croatia Industrial Chain Market, By Application |
6.3.1 Overview and Analysis |
6.3.2 Croatia Industrial Chain Market Revenues & Volume, By Conveyor Systems, 2022 - 2032F |
6.3.3 Croatia Industrial Chain Market Revenues & Volume, By Power Transmission, 2022 - 2032F |
6.3.4 Croatia Industrial Chain Market Revenues & Volume, By Lifting Applications, 2022 - 2032F |
6.3.5 Croatia Industrial Chain Market Revenues & Volume, By Mining & Drilling, 2022 - 2032F |
6.4 Croatia Industrial Chain Market, By End User |
6.4.1 Overview and Analysis |
6.4.2 Croatia Industrial Chain Market Revenues & Volume, By Manufacturing, 2022 - 2032F |
6.4.3 Croatia Industrial Chain Market Revenues & Volume, By Automotive, 2022 - 2032F |
6.4.4 Croatia Industrial Chain Market Revenues & Volume, By Construction, 2022 - 2032F |
6.4.5 Croatia Industrial Chain Market Revenues & Volume, By Oil & Gas, 2022 - 2032F |
6.5 Croatia Industrial Chain Market, By Sales Model |
6.5.1 Overview and Analysis |
6.5.2 Croatia Industrial Chain Market Revenues & Volume, By Direct Sales, 2022 - 2032F |
6.5.3 Croatia Industrial Chain Market Revenues & Volume, By Distributors, 2022 - 2032F |
6.5.4 Croatia Industrial Chain Market Revenues & Volume, By Online Suppliers, 2022 - 2032F |
6.5.5 Croatia Industrial Chain Market Revenues & Volume, By Industrial Suppliers, 2022 - 2032F |
7 Croatia Industrial Chain Market Import-Export Trade Statistics |
7.1 Croatia Industrial Chain Market Export to Major Countries |
7.2 Croatia Industrial Chain Market Imports from Major Countries |
8 Croatia Industrial Chain Market Key Performance Indicators |
8.1 Average production efficiency of industrial chains |
8.2 Rate of adoption of advanced manufacturing technologies in the industrial chain sector |
8.3 Number of new industrial chain products introduced in the market |
9 Croatia Industrial Chain Market - Opportunity Assessment |
9.1 Croatia Industrial Chain Market Opportunity Assessment, By Chain Type, 2022 & 2032F |
9.2 Croatia Industrial Chain Market Opportunity Assessment, By Material Used, 2022 & 2032F |
9.3 Croatia Industrial Chain Market Opportunity Assessment, By Application, 2022 & 2032F |
9.4 Croatia Industrial Chain Market Opportunity Assessment, By End User, 2022 & 2032F |
9.5 Croatia Industrial Chain Market Opportunity Assessment, By Sales Model, 2022 & 2032F |
10 Croatia Industrial Chain Market - Competitive Landscape |
10.1 Croatia Industrial Chain Market Revenue Share, By Companies, 2025 |
10.2 Croatia Industrial Chain Market Competitive Benchmarking, By Operating and Technical Parameters |
11 Company Profiles |
12 Recommendations |
13 Disclaimer |
Global Go To Market Strategy - 2030
Export potential enables firms to identify high-growth global markets with greater confidence by combining advanced trade intelligence with a structured quantitative methodology. The framework analyzes emerging demand trends and country-level import patterns while integrating macroeconomic and trade datasets such as GDP and population forecasts, bilateral import–export flows, tariff structures, elasticity differentials between developed and developing economies, geographic distance, and import demand projections. Using weighted trade values from 2020–2024 as the base period to project country-to-country export potential for 2030, these inputs are operationalized through calculated drivers such as gravity model parameters, tariff impact factors, and projected GDP per-capita growth. Through an analysis of hidden potentials, demand hotspots, and market conditions that are most favorable to success, this method enables firms to focus on target countries, maximize returns, and global expansion with data, backed by accuracy.
By factoring in the projected importer demand gap that is currently unmet and could be potential opportunity, it identifies the potential for the Exporter (Country) among 190 countries, against the general trade analysis, which identifies the biggest importer or exporter.
To discover high-growth global markets and optimize your business strategy:
Click Here
Pricing
- Single User License$ 1,995
- Department License$ 2,400
- Site License$ 3,120
- Global License$ 3,795

Leadership Perspectives from Industry Events
Search
Thought Leadership and Analyst Meet


Our Clients
6WResearch In News
- India Export Attractiveness Tracker 2026
- India Air Conditioner Market Set for Strong Rebound in 2026 After Weather-Led Correction and GST-Driven Recovery: 6Wresearch
- ADAS in India: How Automatic Emergency Braking, Blind Spot Detection & Driver Monitoring are Transforming Road Safety
- Doha a strategic location for EV manufacturing hub: IPA Qatar
- Demand for luxury TVs surging in the GCC, says Samsung
- Empowering Growth: The Thriving Journey of Bangladesh’s Cable Industry
Latest Reports
- Qatar Access and Home Network Market (2026-2032)
- Nicaragua RPG Gaming Market (2026-2032)
- New Zealand RPG Gaming Market (2026-2032)
- Netherlands RPG Gaming Market (2026-2032)
- Nauru RPG Gaming Market (2026-2032)
- Namibia RPG Gaming Market (2026-2032)
- Mozambique RPG Gaming Market (2026-2032)
- Montenegro RPG Gaming Market (2026-2032)
- Mongolia RPG Gaming Market (2026-2032)
- Monaco RPG Gaming Market (2026-2032)
Industry Events and Analyst Meet

EV India Expo 2026

HIMTEX 2026

India Refining Summit 2026

India EV Show 2026

EV tech India Expo 2026
Whitepaper
- Middle East & Africa Commercial Security Market Click here to view more.
- Middle East & Africa Fire Safety Systems & Equipment Market Click here to view more.
- GCC Drone Market Click here to view more.
- Middle East Lighting Fixture Market Click here to view more.
- GCC Physical & Perimeter Security Market Click here to view more.