Croatia Melamine Market (2026-2032) | Growth, Share, Outlook, Analysis, Revenue, Segmentation, Companies, Value, Trends, Size, Industry & Forecast
Market Forecast By Forms (Melamine Resin, Melamine Foams), By Applications (Laminates, Wood Adhesives, Surface Coatings, Thermoset Plastics), By End-users (Construction, Chemical, Textile, Automotive) And Competitive Landscape
| Product Code: ETC4701971 | Publication Date: Nov 2023 | Updated Date: Apr 2026 | Product Type: Market Research Report | |
| Publisher: 6Wresearch | Author: Shubham Padhi | No. of Pages: 60 | No. of Figures: 30 | No. of Tables: 5 |
Croatia Melamine Market Size (2020-2030)
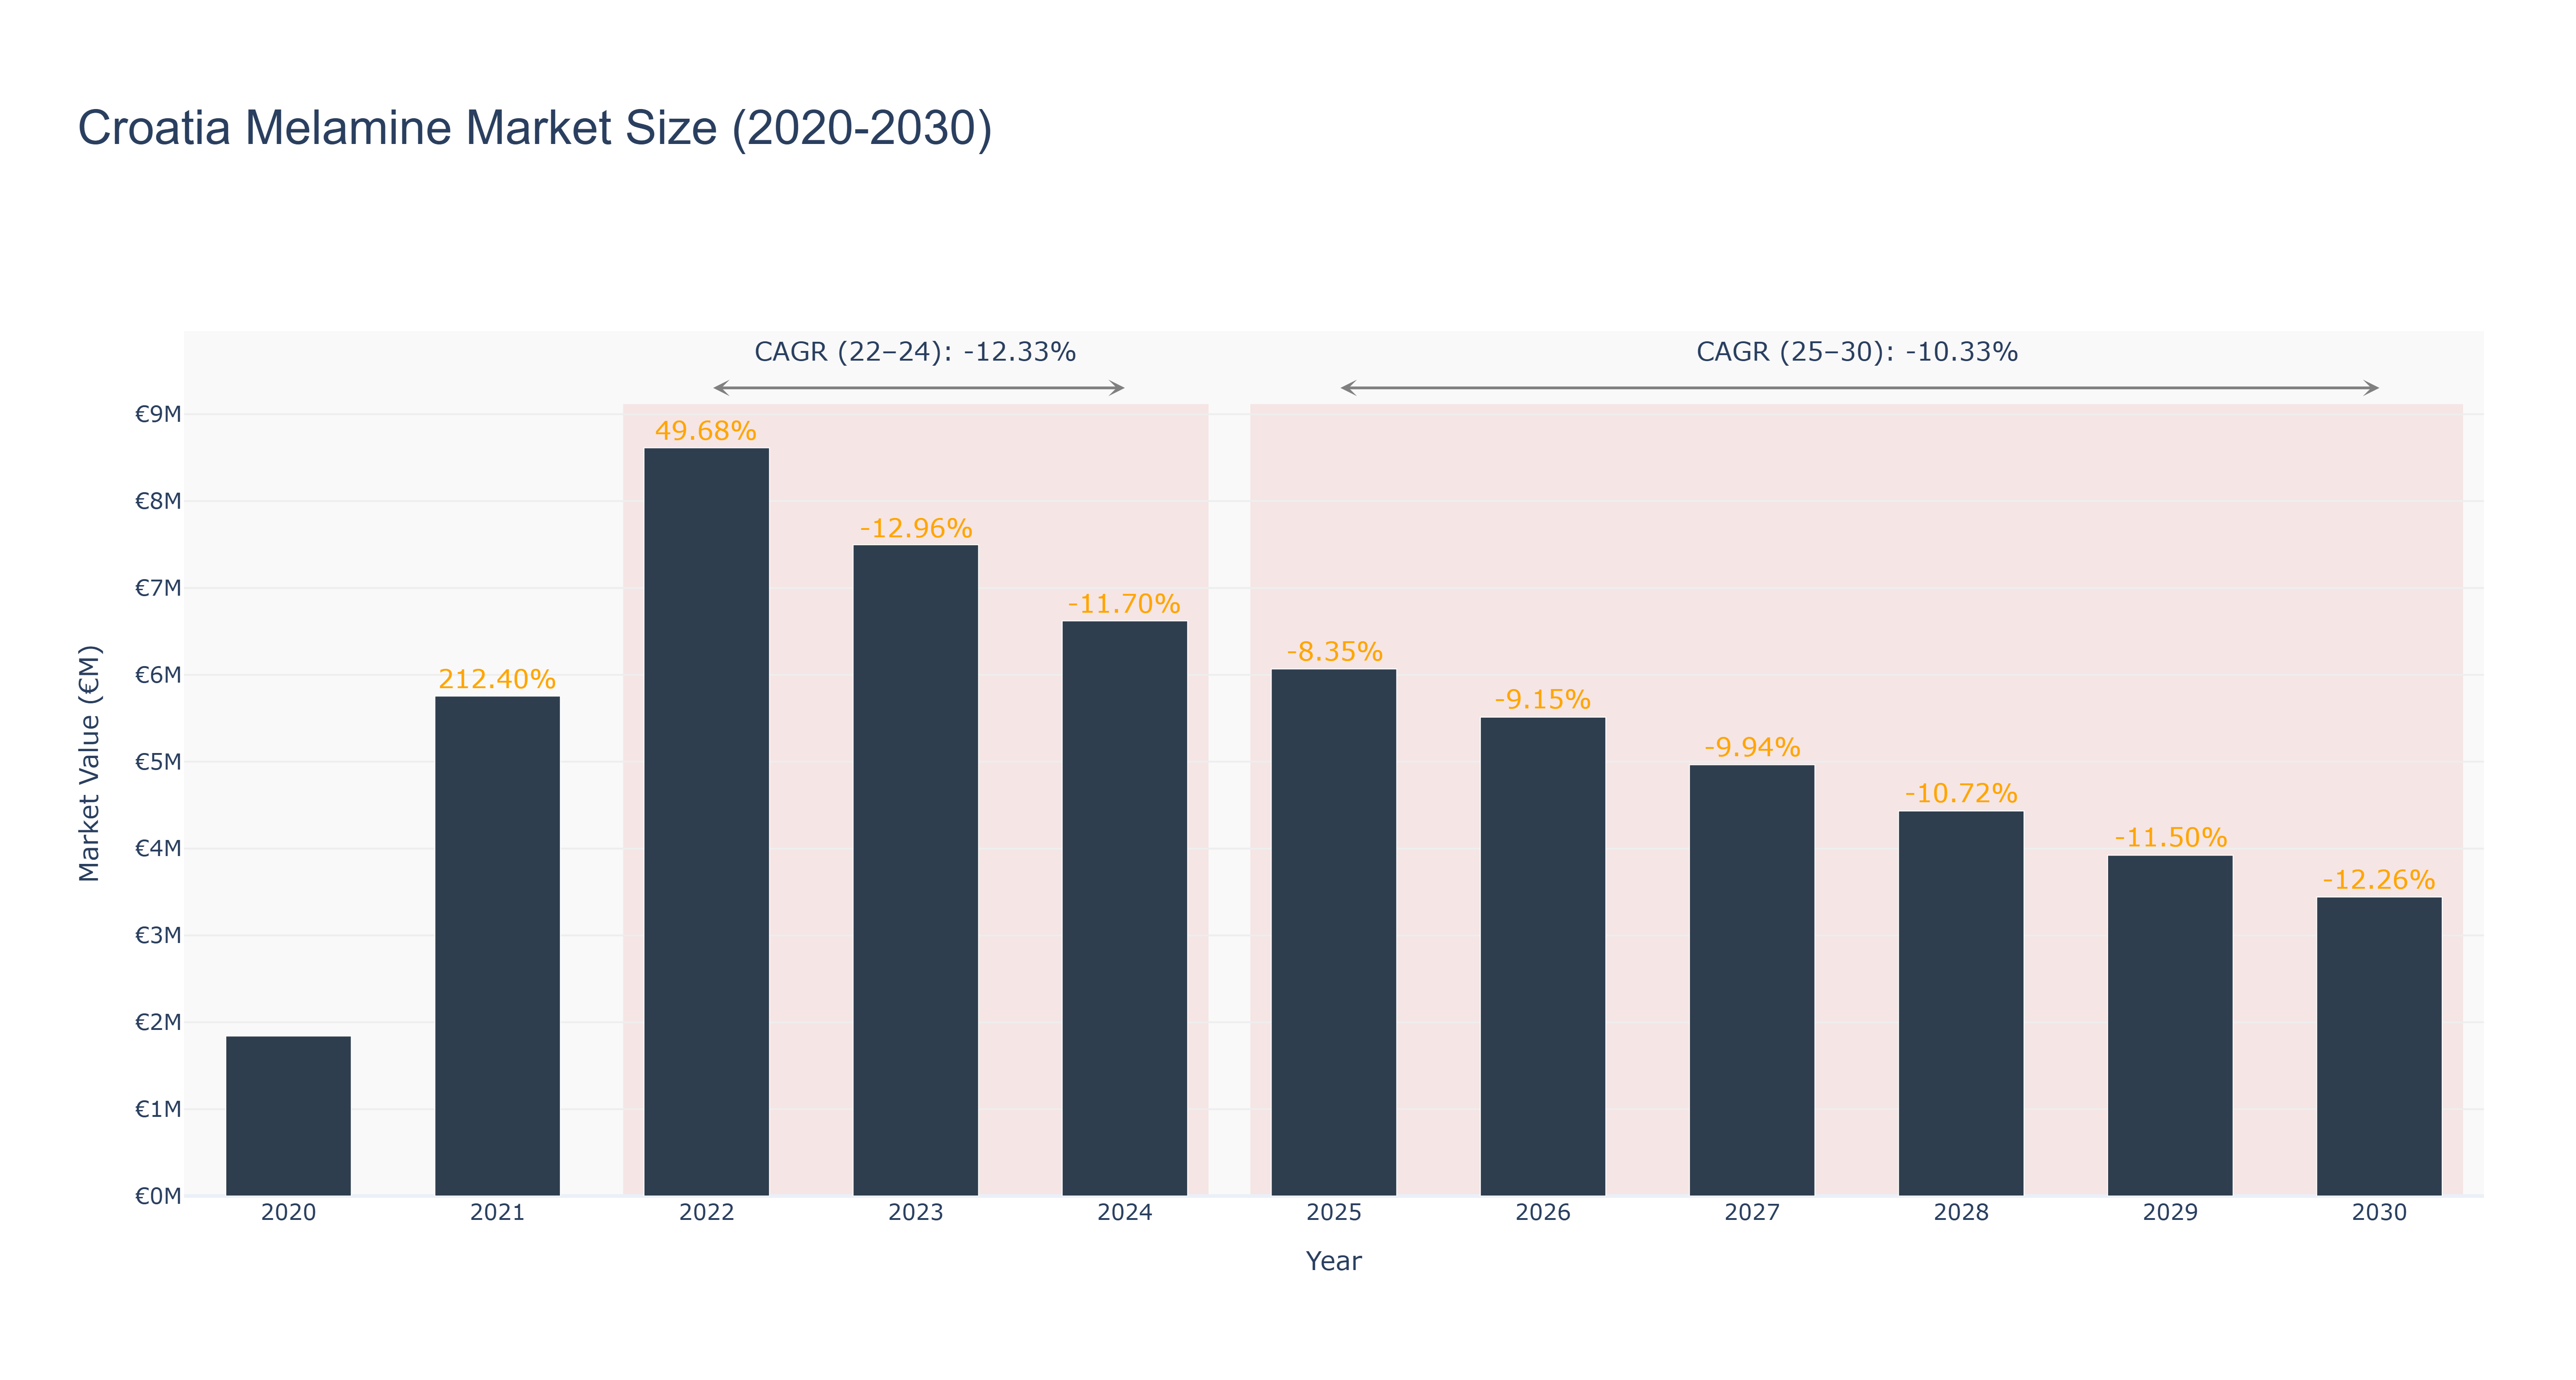
The Croatia Melamine Market experienced significant fluctuations from 2020 to 2024, with a peak market size of €8.61 million in 2022, followed by a decline to €6.62 million by 2024. The actual market growth rates during this period were marked by a remarkable 212.40% in 2021, but subsequent years saw growth stagnate, culminating in a CAGR of -12.33% from 2022 to 2024. Looking ahead to the forecasted period from 2025 to 2030, the market is projected to continue its downward trend, with an expected CAGR of -10.33%, leading to a market size of €3.44 million by 2030. This decline can be attributed to factors such as decreased domestic demand, increased competition from international suppliers, and potential regulatory challenges. As the market adjusts, future growth may hinge on technological advancements and strategic partnerships that can enhance production efficiency and market reach.
Croatia Melamine Market: Production & Trade Performance (2019-2025)
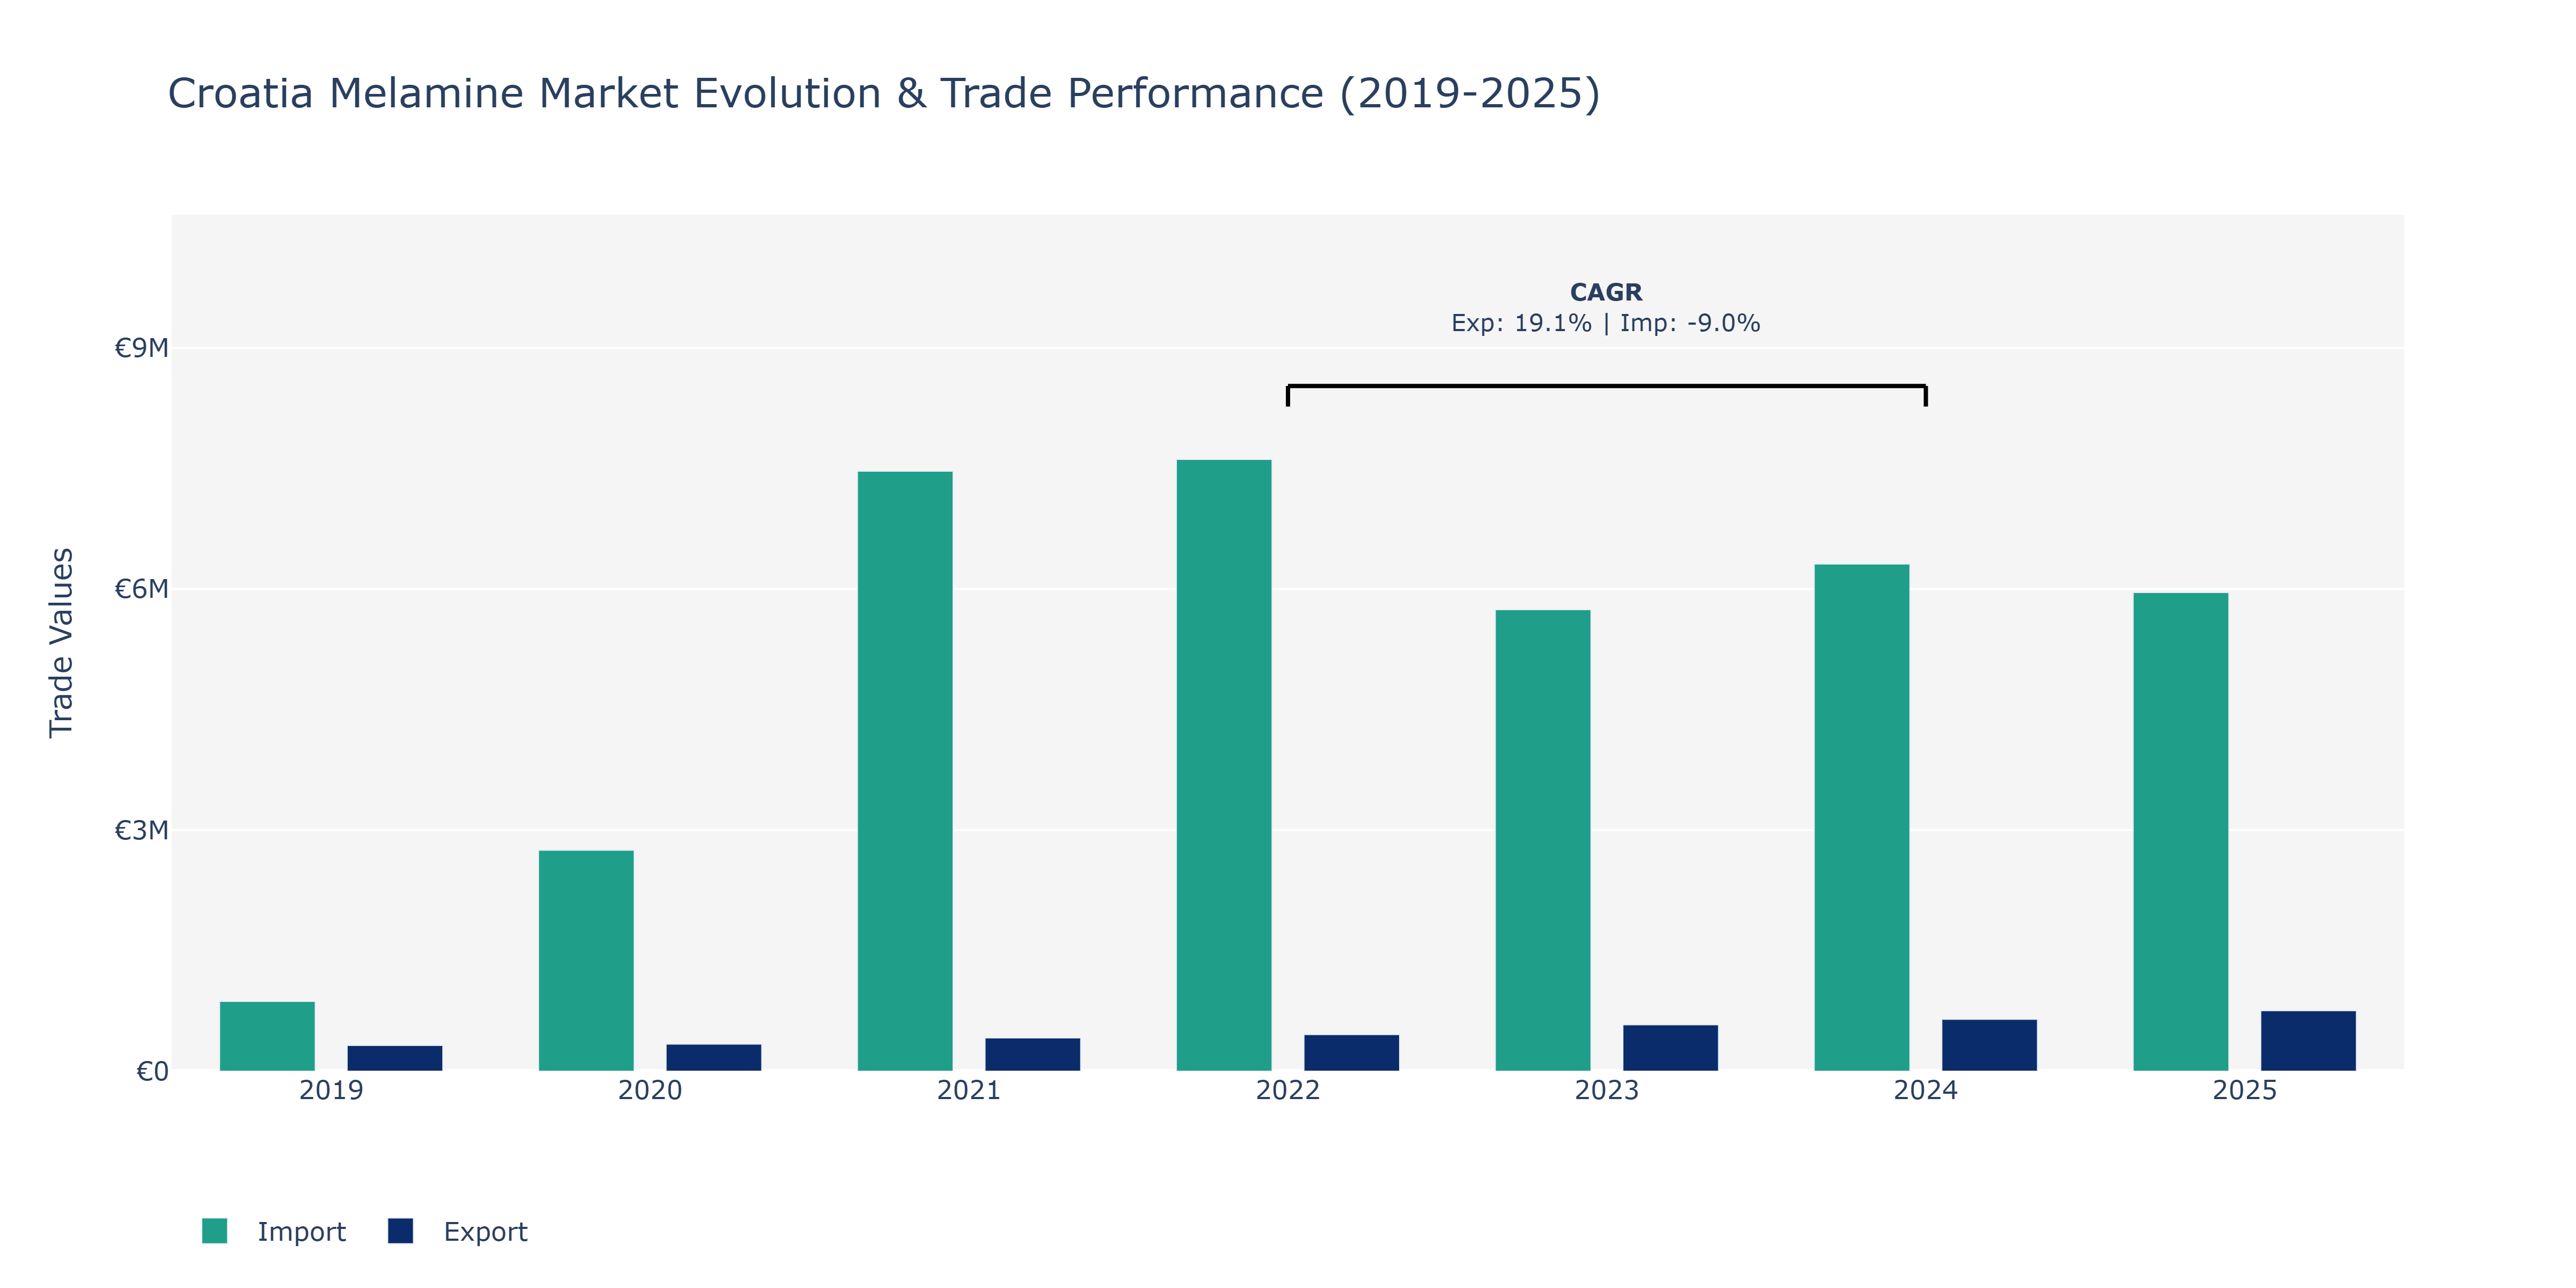
The Croatia Melamine Market saw notable fluctuations in Exports and Imports from 2019 to 2025. Exports demonstrated a consistent upward trend, increasing from €320.63 thousand in 2019 to €753.33 thousand in 2025, reflecting a steady growth trajectory. Conversely, Imports experienced fluctuations, with a peak in 2021 at €7.47 million followed by a decline in 2023 and 2024. The substantial increase in Exports can be attributed to the growing demand for melamine products in international markets, coupled with strategic market expansion initiatives by Croatian manufacturers. On the other hand, the fluctuating trend in Imports may be influenced by varying global market conditions, trade policies, and shifting supplier relationships. The decline in Imports in 2023 and 2024 could signify enhanced domestic production capabilities or changes in sourcing strategies within the industry. This market behavior emphasizes the importance of monitoring global economic dynamics and trade relations for sustainable growth in the Croatia Melamine Market.
Key Highlights of the Report:
- Croatia Melamine Market Outlook
- Market Size of Croatia Melamine Market, 2025
- Forecast of Croatia Melamine Market, 2032
- Historical Data and Forecast of Croatia Melamine Revenues & Volume for the Period 2022 - 2032F
- Croatia Melamine Market Trend Evolution
- Croatia Melamine Market Drivers and Challenges
- Croatia Melamine Price Trends
- Croatia Melamine Porter`s Five Forces
- Croatia Melamine Industry Life Cycle
- Historical Data and Forecast of Croatia Melamine Market Revenues & Volume By Forms for the Period 2022 - 2032F
- Historical Data and Forecast of Croatia Melamine Market Revenues & Volume By Melamine Resin for the Period 2022 - 2032F
- Historical Data and Forecast of Croatia Melamine Market Revenues & Volume By Melamine Foams for the Period 2022 - 2032F
- Historical Data and Forecast of Croatia Melamine Market Revenues & Volume By Applications for the Period 2022 - 2032F
- Historical Data and Forecast of Croatia Melamine Market Revenues & Volume By Laminates for the Period 2022 - 2032F
- Historical Data and Forecast of Croatia Melamine Market Revenues & Volume By Wood Adhesives for the Period 2022 - 2032F
- Historical Data and Forecast of Croatia Melamine Market Revenues & Volume By Surface Coatings for the Period 2022 - 2032F
- Historical Data and Forecast of Croatia Melamine Market Revenues & Volume By Thermoset Plastics for the Period 2022 - 2032F
- Historical Data and Forecast of Croatia Melamine Market Revenues & Volume By End-users for the Period 2022 - 2032F
- Historical Data and Forecast of Croatia Melamine Market Revenues & Volume By Construction for the Period 2022 - 2032F
- Historical Data and Forecast of Croatia Melamine Market Revenues & Volume By Chemical for the Period 2022 - 2032F
- Historical Data and Forecast of Croatia Melamine Market Revenues & Volume By Textile for the Period 2022 - 2032F
- Historical Data and Forecast of Croatia Melamine Market Revenues & Volume By Automotive for the Period 2022 - 2032F
- Croatia Melamine Import Export Trade Statistics
- Market Opportunity Assessment By Forms
- Market Opportunity Assessment By Applications
- Market Opportunity Assessment By End-users
- Croatia Melamine Top Companies Market Share
- Croatia Melamine Competitive Benchmarking By Technical and Operational Parameters
- Croatia Melamine Company Profiles
- Croatia Melamine Key Strategic Recommendations
Frequently Asked Questions About the Market Study (FAQs):
6Wresearch actively monitors the Croatia Melamine Market and publishes its comprehensive annual report, highlighting emerging trends, growth drivers, revenue analysis, and forecast outlook. Our insights help businesses to make data-backed strategic decisions with ongoing market dynamics. Our analysts track relevent industries related to the Croatia Melamine Market, allowing our clients with actionable intelligence and reliable forecasts tailored to emerging regional needs.
Yes, we provide customisation as per your requirements. To learn more, feel free to contact us on sales@6wresearch.com
1 Executive Summary |
2 Introduction |
2.1 Key Highlights of the Report |
2.2 Report Description |
2.3 Market Scope & Segmentation |
2.4 Research Methodology |
2.5 Assumptions |
3 Croatia Melamine Market Overview |
3.1 Croatia Country Macro Economic Indicators |
3.2 Croatia Melamine Market Revenues & Volume, 2022 & 2032F |
3.3 Croatia Melamine Market - Industry Life Cycle |
3.4 Croatia Melamine Market - Porter's Five Forces |
3.5 Croatia Melamine Market Revenues & Volume Share, By Forms, 2022 & 2032F |
3.6 Croatia Melamine Market Revenues & Volume Share, By Applications, 2022 & 2032F |
3.7 Croatia Melamine Market Revenues & Volume Share, By End-users, 2022 & 2032F |
4 Croatia Melamine Market Dynamics |
4.1 Impact Analysis |
4.2 Market Drivers |
4.2.1 Growing demand for melamine in the construction industry due to its properties like durability and heat resistance. |
4.2.2 Increasing use of melamine in the manufacturing of kitchenware and tableware. |
4.2.3 Favorable government regulations supporting the usage of melamine in various applications. |
4.3 Market Restraints |
4.3.1 Fluctuating prices of raw materials used in melamine production. |
4.3.2 Competition from alternative materials such as porcelain and ceramics. |
4.3.3 Environmental concerns related to the production and disposal of melamine. |
5 Croatia Melamine Market Trends |
6 Croatia Melamine Market Segmentations |
6.1 Croatia Melamine Market, By Forms |
6.1.1 Overview and Analysis |
6.1.2 Croatia Melamine Market Revenues & Volume, By Melamine Resin, 2022 - 2032F |
6.1.3 Croatia Melamine Market Revenues & Volume, By Melamine Foams, 2022 - 2032F |
6.2 Croatia Melamine Market, By Applications |
6.2.1 Overview and Analysis |
6.2.2 Croatia Melamine Market Revenues & Volume, By Laminates, 2022 - 2032F |
6.2.3 Croatia Melamine Market Revenues & Volume, By Wood Adhesives, 2022 - 2032F |
6.2.4 Croatia Melamine Market Revenues & Volume, By Surface Coatings, 2022 - 2032F |
6.2.5 Croatia Melamine Market Revenues & Volume, By Thermoset Plastics, 2022 - 2032F |
6.3 Croatia Melamine Market, By End-users |
6.3.1 Overview and Analysis |
6.3.2 Croatia Melamine Market Revenues & Volume, By Construction, 2022 - 2032F |
6.3.3 Croatia Melamine Market Revenues & Volume, By Chemical, 2022 - 2032F |
6.3.4 Croatia Melamine Market Revenues & Volume, By Textile, 2022 - 2032F |
6.3.5 Croatia Melamine Market Revenues & Volume, By Automotive, 2022 - 2032F |
7 Croatia Melamine Market Import-Export Trade Statistics |
7.1 Croatia Melamine Market Export to Major Countries |
7.2 Croatia Melamine Market Imports from Major Countries |
8 Croatia Melamine Market Key Performance Indicators |
8.1 Average selling price of melamine products. |
8.2 Number of new construction projects utilizing melamine. |
8.3 Adoption rate of melamine in the food industry for packaging and serving purposes. |
8.4 Percentage of melamine manufacturers implementing sustainable production practices. |
8.5 Research and development investment in new melamine applications. |
9 Croatia Melamine Market - Opportunity Assessment |
9.1 Croatia Melamine Market Opportunity Assessment, By Forms, 2022 & 2032F |
9.2 Croatia Melamine Market Opportunity Assessment, By Applications, 2022 & 2032F |
9.3 Croatia Melamine Market Opportunity Assessment, By End-users, 2022 & 2032F |
10 Croatia Melamine Market - Competitive Landscape |
10.1 Croatia Melamine Market Revenue Share, By Companies, 2025 |
10.2 Croatia Melamine Market Competitive Benchmarking, By Operating and Technical Parameters |
11 Company Profiles |
12 Recommendations | 13 Disclaimer |
Global Go To Market Strategy - 2030
Export potential enables firms to identify high-growth global markets with greater confidence by combining advanced trade intelligence with a structured quantitative methodology. The framework analyzes emerging demand trends and country-level import patterns while integrating macroeconomic and trade datasets such as GDP and population forecasts, bilateral import–export flows, tariff structures, elasticity differentials between developed and developing economies, geographic distance, and import demand projections. Using weighted trade values from 2020–2024 as the base period to project country-to-country export potential for 2030, these inputs are operationalized through calculated drivers such as gravity model parameters, tariff impact factors, and projected GDP per-capita growth. Through an analysis of hidden potentials, demand hotspots, and market conditions that are most favorable to success, this method enables firms to focus on target countries, maximize returns, and global expansion with data, backed by accuracy.
By factoring in the projected importer demand gap that is currently unmet and could be potential opportunity, it identifies the potential for the Exporter (Country) among 190 countries, against the general trade analysis, which identifies the biggest importer or exporter.
To discover high-growth global markets and optimize your business strategy:
Click Here
Pricing
- Single User License$ 1,995
- Department License$ 2,400
- Site License$ 3,120
- Global License$ 3,795

Leadership Perspectives from Industry Events
Search
Thought Leadership and Analyst Meet


Our Clients
6WResearch In News
- India Air Conditioner Market Set for Strong Rebound in 2026 After Weather-Led Correction and GST-Driven Recovery: 6Wresearch
- ADAS in India: How Automatic Emergency Braking, Blind Spot Detection & Driver Monitoring are Transforming Road Safety
- Doha a strategic location for EV manufacturing hub: IPA Qatar
- Demand for luxury TVs surging in the GCC, says Samsung
- Empowering Growth: The Thriving Journey of Bangladesh’s Cable Industry
- Demand for luxury TVs surging in the GCC, says Samsung
Latest Reports
- Poland Fire Protection Systems Market (2026-2032)
- Cape Verde Portable Hand-Thrown Extinguisher Market (2026-2032)
- Canada Portable Hand-Thrown Extinguisher Market (2026-2032)
- Cameroon Portable Hand-Thrown Extinguisher Market (2026-2032)
- Burundi Portable Hand-Thrown Extinguisher Market (2026-2032)
- Burkina Faso Portable Hand-Thrown Extinguisher Market (2026-2032)
- Bulgaria Portable Hand-Thrown Extinguisher Market (2026-2032)
- Brunei Portable Hand-Thrown Extinguisher Market (2026-2032)
- Botswana Portable Hand-Thrown Extinguisher Market (2026-2032)
- Bosnia and Herzegovina Portable Hand-Thrown Extinguisher Market (2026-2032)
Industry Events and Analyst Meet

HIMTEX 2026

India Refining Summit 2026

India EV Show 2026

EV tech India Expo 2026

Auto Tech Asia 2026
Whitepaper
- Middle East & Africa Commercial Security Market Click here to view more.
- Middle East & Africa Fire Safety Systems & Equipment Market Click here to view more.
- GCC Drone Market Click here to view more.
- Middle East Lighting Fixture Market Click here to view more.
- GCC Physical & Perimeter Security Market Click here to view more.