Croatia Nitrous Oxide Market (2026-2032) | Industry, Forecast, Value, Analysis, Growth, Size, Outlook, Companies, Segmentation, Trends, Share & Revenue
Market Forecast By Applications (Automotive, Medical, Electronics, Food & Beverage, Others) And Competitive Landscape
| Product Code: ETC4737748 | Publication Date: Nov 2023 | Updated Date: Apr 2026 | Product Type: Market Research Report | |
| Publisher: 6Wresearch | Author: Shubham Padhi | No. of Pages: 60 | No. of Figures: 30 | No. of Tables: 5 |
Croatia Nitrous Oxide Market Size (2020-2030)
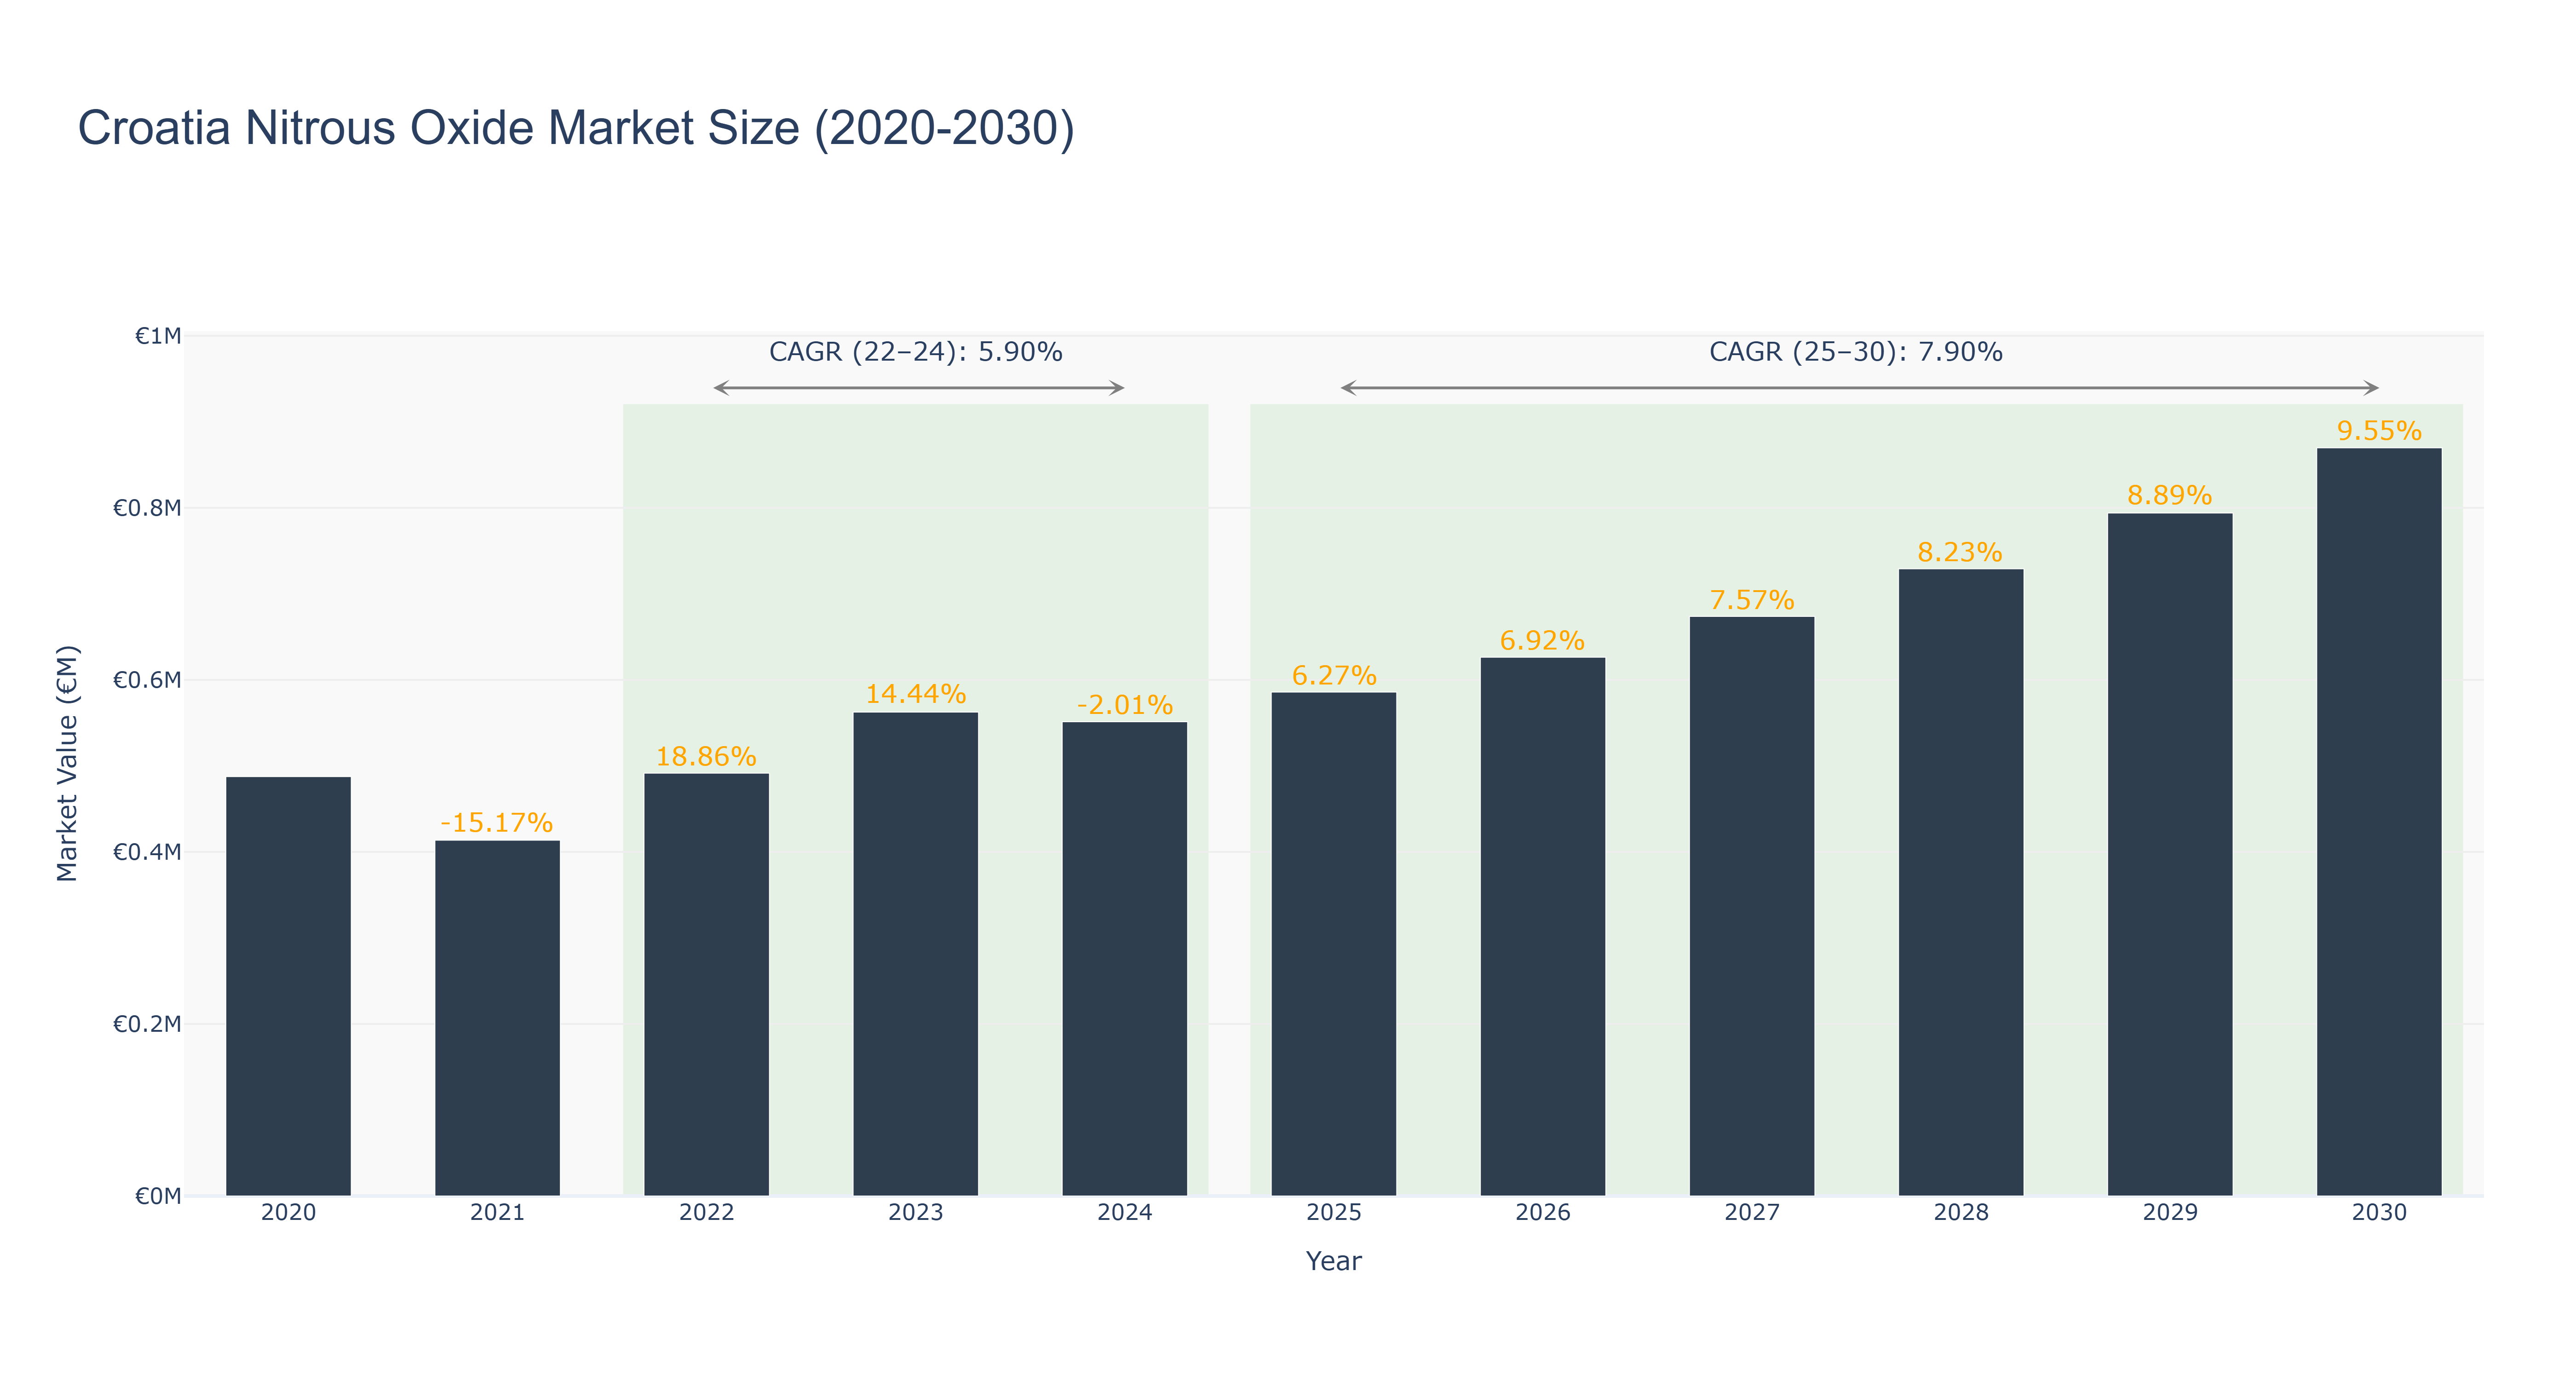
Croatia Nitrous Oxide Market has shown a fluctuating trend in recent years. The peak market size of €0.87 million is forecasted for 2030, with steady growth observed from 2020 to 2029. However, a slight decline in market size was recorded in 2024 due to a negative growth rate of -2.01%. The market rebounded with a 6.27% growth in 2025, followed by consistent growth rates averaging around 7% annually. The CAGR for the period 2022-24 stands at 5.90%, while the CAGR for 2025-30 is projected at 7.90%. Industry drivers fueling this growth include increasing demand for nitrous oxide in medical and industrial applications. Looking ahead, Croatia is set to implement new regulations promoting sustainability in nitrous oxide production, aligning with global environmental goals.
Croatia Nitrous Oxide Market: Production & Trade Performance (2019-2025)
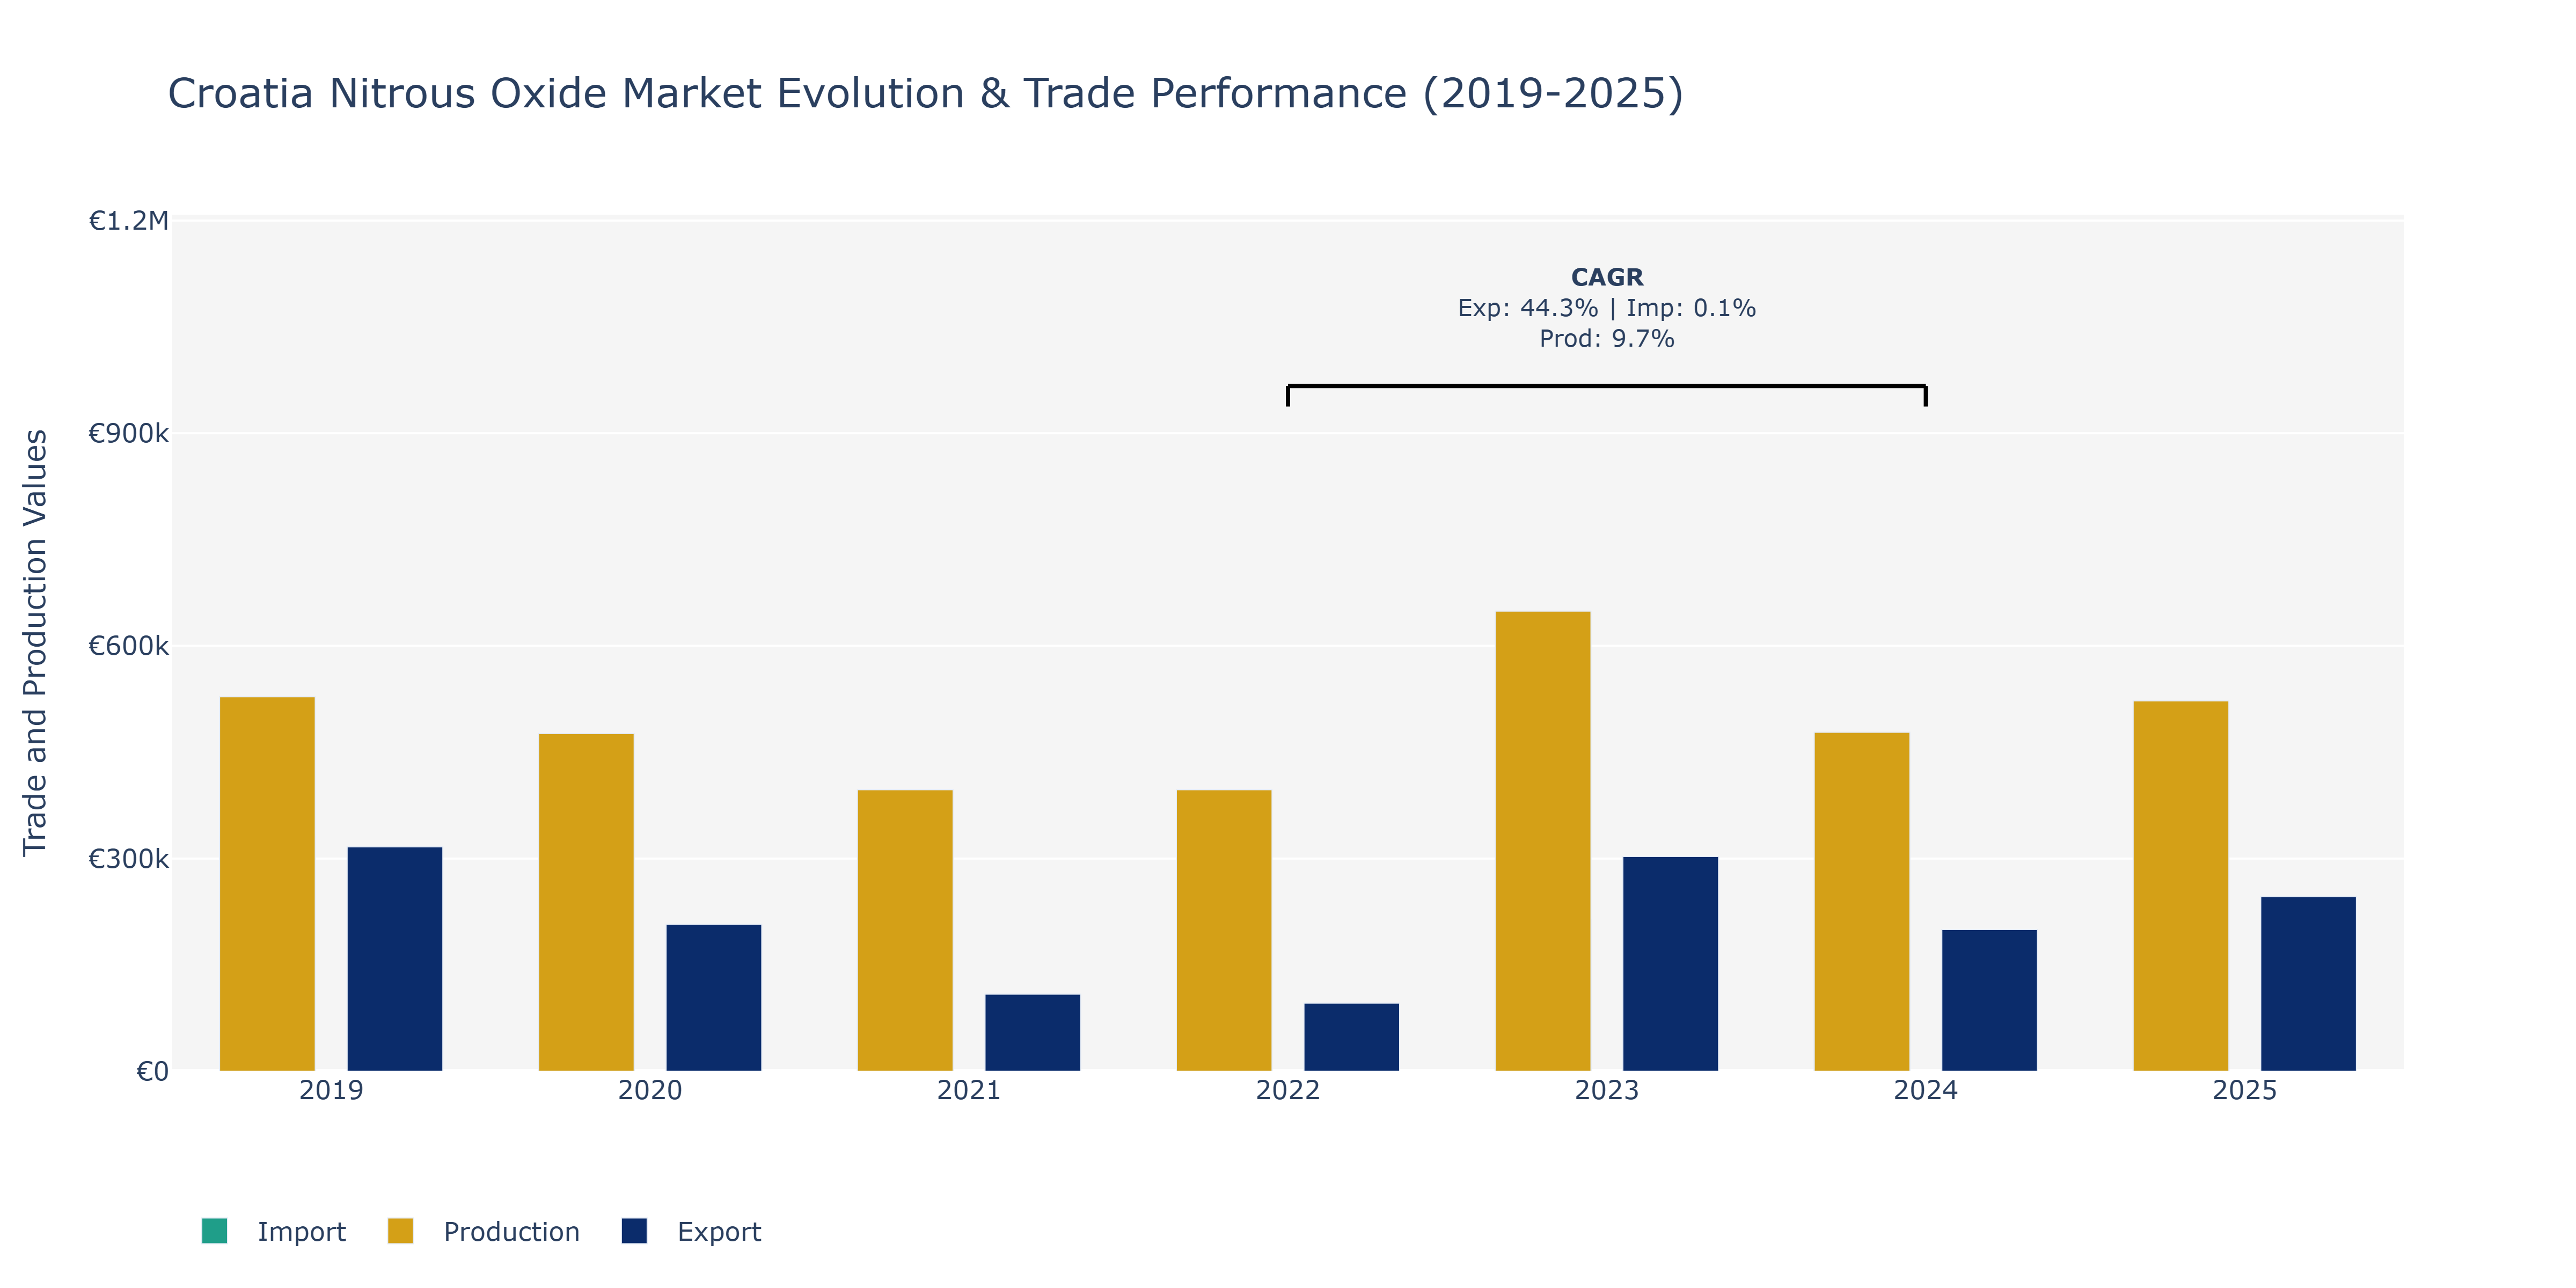
In the Croatia Nitrous Oxide market, the data shows fluctuating trends in exports, imports, and production from 2019 to 2025. Exports saw a sharp decline from €316.5 thousand in 2019 to €108.71 thousand in 2021, before rebounding to €302.82 thousand in 2023, and then tapering to around €246.49 thousand in 2025. Imports, on the other hand, experienced an initial drop from €331.09 thousand in 2019 to €80.92 thousand in 2020, followed by a gradual increase, reaching approximately €187.55 thousand in 2025. Production remained relatively stable around €397 million from 2021 to 2022, with a notable increase to €649 million in 2023, before stabilizing again in the range of €476 million to €522 million from 2024 to 2025. These fluctuations can be attributed to changing global demand for nitrous oxide, evolving trade agreements, and advancements in production technologies within the region. Further research into market dynamics and regulatory changes could provide deeper insights into these trends.
Key Highlights of the Report:
- Croatia Nitrous Oxide Market Outlook
- Market Size of Croatia Nitrous Oxide Market, 2025
- Forecast of Croatia Nitrous Oxide Market, 2032
- Historical Data and Forecast of Croatia Nitrous Oxide Revenues & Volume for the Period 2022 - 2032F
- Croatia Nitrous Oxide Market Trend Evolution
- Croatia Nitrous Oxide Market Drivers and Challenges
- Croatia Nitrous Oxide Price Trends
- Croatia Nitrous Oxide Porter`s Five Forces
- Croatia Nitrous Oxide Industry Life Cycle
- Historical Data and Forecast of Croatia Nitrous Oxide Market Revenues & Volume By Applications for the Period 2022 - 2032F
- Historical Data and Forecast of Croatia Nitrous Oxide Market Revenues & Volume By Automotive for the Period 2022 - 2032F
- Historical Data and Forecast of Croatia Nitrous Oxide Market Revenues & Volume By Medical for the Period 2022 - 2032F
- Historical Data and Forecast of Croatia Nitrous Oxide Market Revenues & Volume By Electronics for the Period 2022 - 2032F
- Historical Data and Forecast of Croatia Nitrous Oxide Market Revenues & Volume By Food & Beverage for the Period 2022 - 2032F
- Historical Data and Forecast of Croatia Nitrous Oxide Market Revenues & Volume By Others for the Period 2022 - 2032F
- Croatia Nitrous Oxide Import Export Trade Statistics
- Market Opportunity Assessment By Applications
- Croatia Nitrous Oxide Top Companies Market Share
- Croatia Nitrous Oxide Competitive Benchmarking By Technical and Operational Parameters
- Croatia Nitrous Oxide Company Profiles
- Croatia Nitrous Oxide Key Strategic Recommendations
Frequently Asked Questions About the Market Study (FAQs):
6Wresearch actively monitors the Croatia Nitrous Oxide Market and publishes its comprehensive annual report, highlighting emerging trends, growth drivers, revenue analysis, and forecast outlook. Our insights help businesses to make data-backed strategic decisions with ongoing market dynamics. Our analysts track relevent industries related to the Croatia Nitrous Oxide Market, allowing our clients with actionable intelligence and reliable forecasts tailored to emerging regional needs.
Yes, we provide customisation as per your requirements. To learn more, feel free to contact us on sales@6wresearch.com
1 Executive Summary |
2 Introduction |
2.1 Key Highlights of the Report |
2.2 Report Description |
2.3 Market Scope & Segmentation |
2.4 Research Methodology |
2.5 Assumptions |
3 Croatia Nitrous Oxide Market Overview |
3.1 Croatia Country Macro Economic Indicators |
3.2 Croatia Nitrous Oxide Market Revenues & Volume, 2022 & 2032F |
3.3 Croatia Nitrous Oxide Market - Industry Life Cycle |
3.4 Croatia Nitrous Oxide Market - Porter's Five Forces |
3.5 Croatia Nitrous Oxide Market Revenues & Volume Share, By Applications, 2022 & 2032F |
4 Croatia Nitrous Oxide Market Dynamics |
4.1 Impact Analysis |
4.2 Market Drivers |
4.2.1 Increasing demand for nitrous oxide in medical and dental applications |
4.2.2 Growth in the food and beverage industry, where nitrous oxide is used for whipping cream and carbonation |
4.2.3 Rising awareness about the benefits of nitrous oxide in industrial applications such as electronics manufacturing |
4.3 Market Restraints |
4.3.1 Stringent regulations regarding the use and handling of nitrous oxide |
4.3.2 Fluctuating prices of raw materials used in the production of nitrous oxide |
4.3.3 Competition from alternative gases and technologies in various applications |
5 Croatia Nitrous Oxide Market Trends |
6 Croatia Nitrous Oxide Market Segmentations |
6.1 Croatia Nitrous Oxide Market, By Applications |
6.1.1 Overview and Analysis |
6.1.2 Croatia Nitrous Oxide Market Revenues & Volume, By Automotive, 2022 - 2032F |
6.1.3 Croatia Nitrous Oxide Market Revenues & Volume, By Medical, 2022 - 2032F |
6.1.4 Croatia Nitrous Oxide Market Revenues & Volume, By Electronics, 2022 - 2032F |
6.1.5 Croatia Nitrous Oxide Market Revenues & Volume, By Food & Beverage, 2022 - 2032F |
6.1.6 Croatia Nitrous Oxide Market Revenues & Volume, By Others, 2022 - 2032F |
7 Croatia Nitrous Oxide Market Import-Export Trade Statistics |
7.1 Croatia Nitrous Oxide Market Export to Major Countries |
7.2 Croatia Nitrous Oxide Market Imports from Major Countries |
8 Croatia Nitrous Oxide Market Key Performance Indicators |
8.1 Number of new medical and dental facilities using nitrous oxide |
8.2 Volume of nitrous oxide sales in the food and beverage sector |
8.3 Adoption rate of nitrous oxide in emerging industrial applications such as electronics manufacturing |
8.4 Percentage of compliance with regulatory requirements for nitrous oxide handling and usage |
8.5 Research and development expenditure on finding new applications for nitrous oxide |
9 Croatia Nitrous Oxide Market - Opportunity Assessment |
9.1 Croatia Nitrous Oxide Market Opportunity Assessment, By Applications, 2022 & 2032F |
10 Croatia Nitrous Oxide Market - Competitive Landscape |
10.1 Croatia Nitrous Oxide Market Revenue Share, By Companies, 2025 |
10.2 Croatia Nitrous Oxide Market Competitive Benchmarking, By Operating and Technical Parameters |
11 Company Profiles |
12 Recommendations | 13 Disclaimer |
Global Go To Market Strategy - 2030
Export potential enables firms to identify high-growth global markets with greater confidence by combining advanced trade intelligence with a structured quantitative methodology. The framework analyzes emerging demand trends and country-level import patterns while integrating macroeconomic and trade datasets such as GDP and population forecasts, bilateral import–export flows, tariff structures, elasticity differentials between developed and developing economies, geographic distance, and import demand projections. Using weighted trade values from 2020–2024 as the base period to project country-to-country export potential for 2030, these inputs are operationalized through calculated drivers such as gravity model parameters, tariff impact factors, and projected GDP per-capita growth. Through an analysis of hidden potentials, demand hotspots, and market conditions that are most favorable to success, this method enables firms to focus on target countries, maximize returns, and global expansion with data, backed by accuracy.
By factoring in the projected importer demand gap that is currently unmet and could be potential opportunity, it identifies the potential for the Exporter (Country) among 190 countries, against the general trade analysis, which identifies the biggest importer or exporter.
To discover high-growth global markets and optimize your business strategy:
Click Here
Pricing
- Single User License$ 1,995
- Department License$ 2,400
- Site License$ 3,120
- Global License$ 3,795

Leadership Perspectives from Industry Events
Search
Thought Leadership and Analyst Meet


Our Clients
6WResearch In News
- ADAS in India: How Automatic Emergency Braking, Blind Spot Detection & Driver Monitoring are Transforming Road Safety
- Doha a strategic location for EV manufacturing hub: IPA Qatar
- Demand for luxury TVs surging in the GCC, says Samsung
- Empowering Growth: The Thriving Journey of Bangladesh’s Cable Industry
- Demand for luxury TVs surging in the GCC, says Samsung
- Video call with a traditional healer? Once unthinkable, it’s now common in South Africa
Latest Reports
- Poland Fire Protection Systems Market (2026-2032)
- Cape Verde Portable Hand-Thrown Extinguisher Market (2026-2032)
- Canada Portable Hand-Thrown Extinguisher Market (2026-2032)
- Cameroon Portable Hand-Thrown Extinguisher Market (2026-2032)
- Burundi Portable Hand-Thrown Extinguisher Market (2026-2032)
- Burkina Faso Portable Hand-Thrown Extinguisher Market (2026-2032)
- Bulgaria Portable Hand-Thrown Extinguisher Market (2026-2032)
- Brunei Portable Hand-Thrown Extinguisher Market (2026-2032)
- Botswana Portable Hand-Thrown Extinguisher Market (2026-2032)
- Bosnia and Herzegovina Portable Hand-Thrown Extinguisher Market (2026-2032)
Industry Events and Analyst Meet

HIMTEX 2026

India Refining Summit 2026

India EV Show 2026

EV tech India Expo 2026

Auto Tech Asia 2026
Whitepaper
- Middle East & Africa Commercial Security Market Click here to view more.
- Middle East & Africa Fire Safety Systems & Equipment Market Click here to view more.
- GCC Drone Market Click here to view more.
- Middle East Lighting Fixture Market Click here to view more.
- GCC Physical & Perimeter Security Market Click here to view more.