Croatia Processed Fruit Market (2026-2032) | Size, Growth, Forecast, Companies, Revenue, Industry, Value, Analysis, Segmentation, Share, Trends & Outlook
Market Forecast By Product (Fresh, Fresh- Cut, Canned, Frozen, Drying &Dehydration), By Processing Equipment (Pre-processing, Processing, Washing, Filling, Seasoning, Packaging) And Competitive Landscape
| Product Code: ETC5515114 | Publication Date: Nov 2023 | Updated Date: Apr 2026 | Product Type: Market Research Report | |
| Publisher: 6Wresearch | Author: Ravi Bhandari | No. of Pages: 60 | No. of Figures: 30 | No. of Tables: 5 |
Croatia Processed Fruit Market Size (2020-2030)
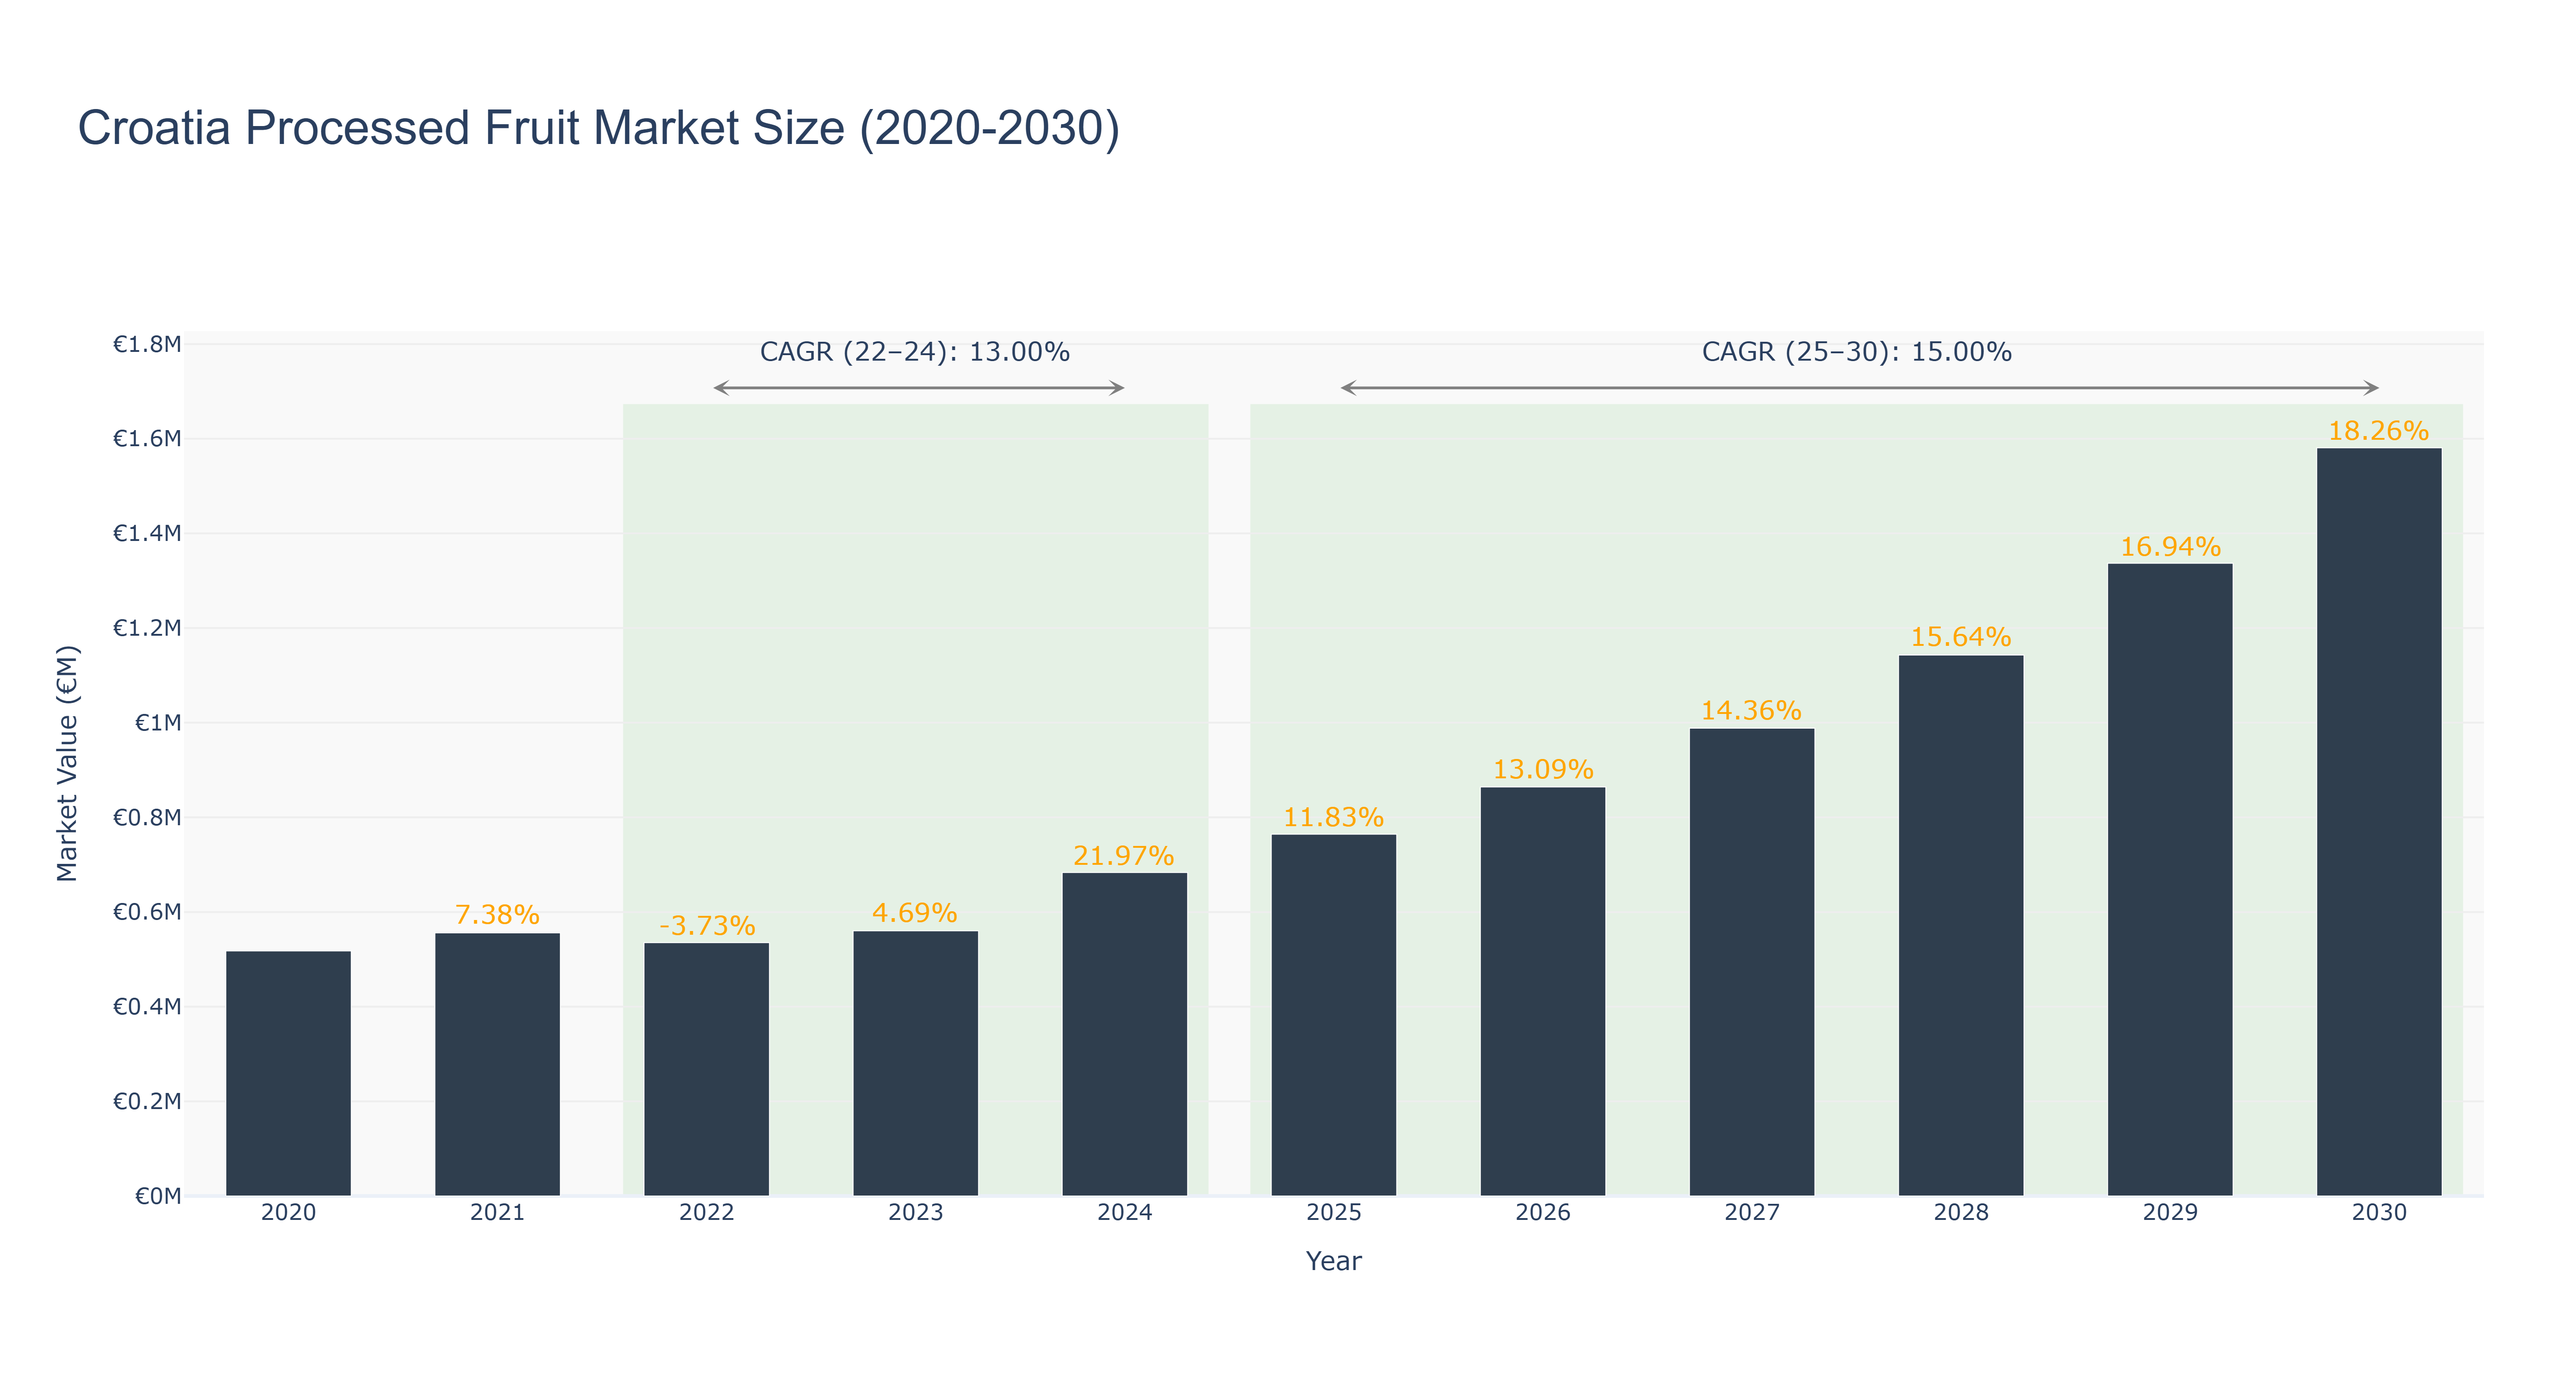
Croatia Processed Fruit Market has shown a positive growth trajectory over the years. The peak market size was €1.58 million in 2030, with consistent growth from €0.52 million in 2020. The market experienced a decline in 2022 to €0.54 million, possibly due to external factors impacting consumer demand or supply chain disruptions. However, the market rebounded strongly in 2024 to €0.68 million, driven by innovative product offerings and increased consumer awareness. The forecasted market size from 2025 to 2030 is expected to continue this upward trend, with a CAGR of 14.99950634%. Industry drivers such as health-conscious consumer preferences and technological advancements in processing methods are likely contributing to this growth. Looking ahead, upcoming projects in Croatia's processed fruit sector, such as sustainable packaging initiatives and expanded distribution networks, are poised to further propel market expansion.
Croatia Processed Fruit Market: Production & Trade Performance (2019-2025)
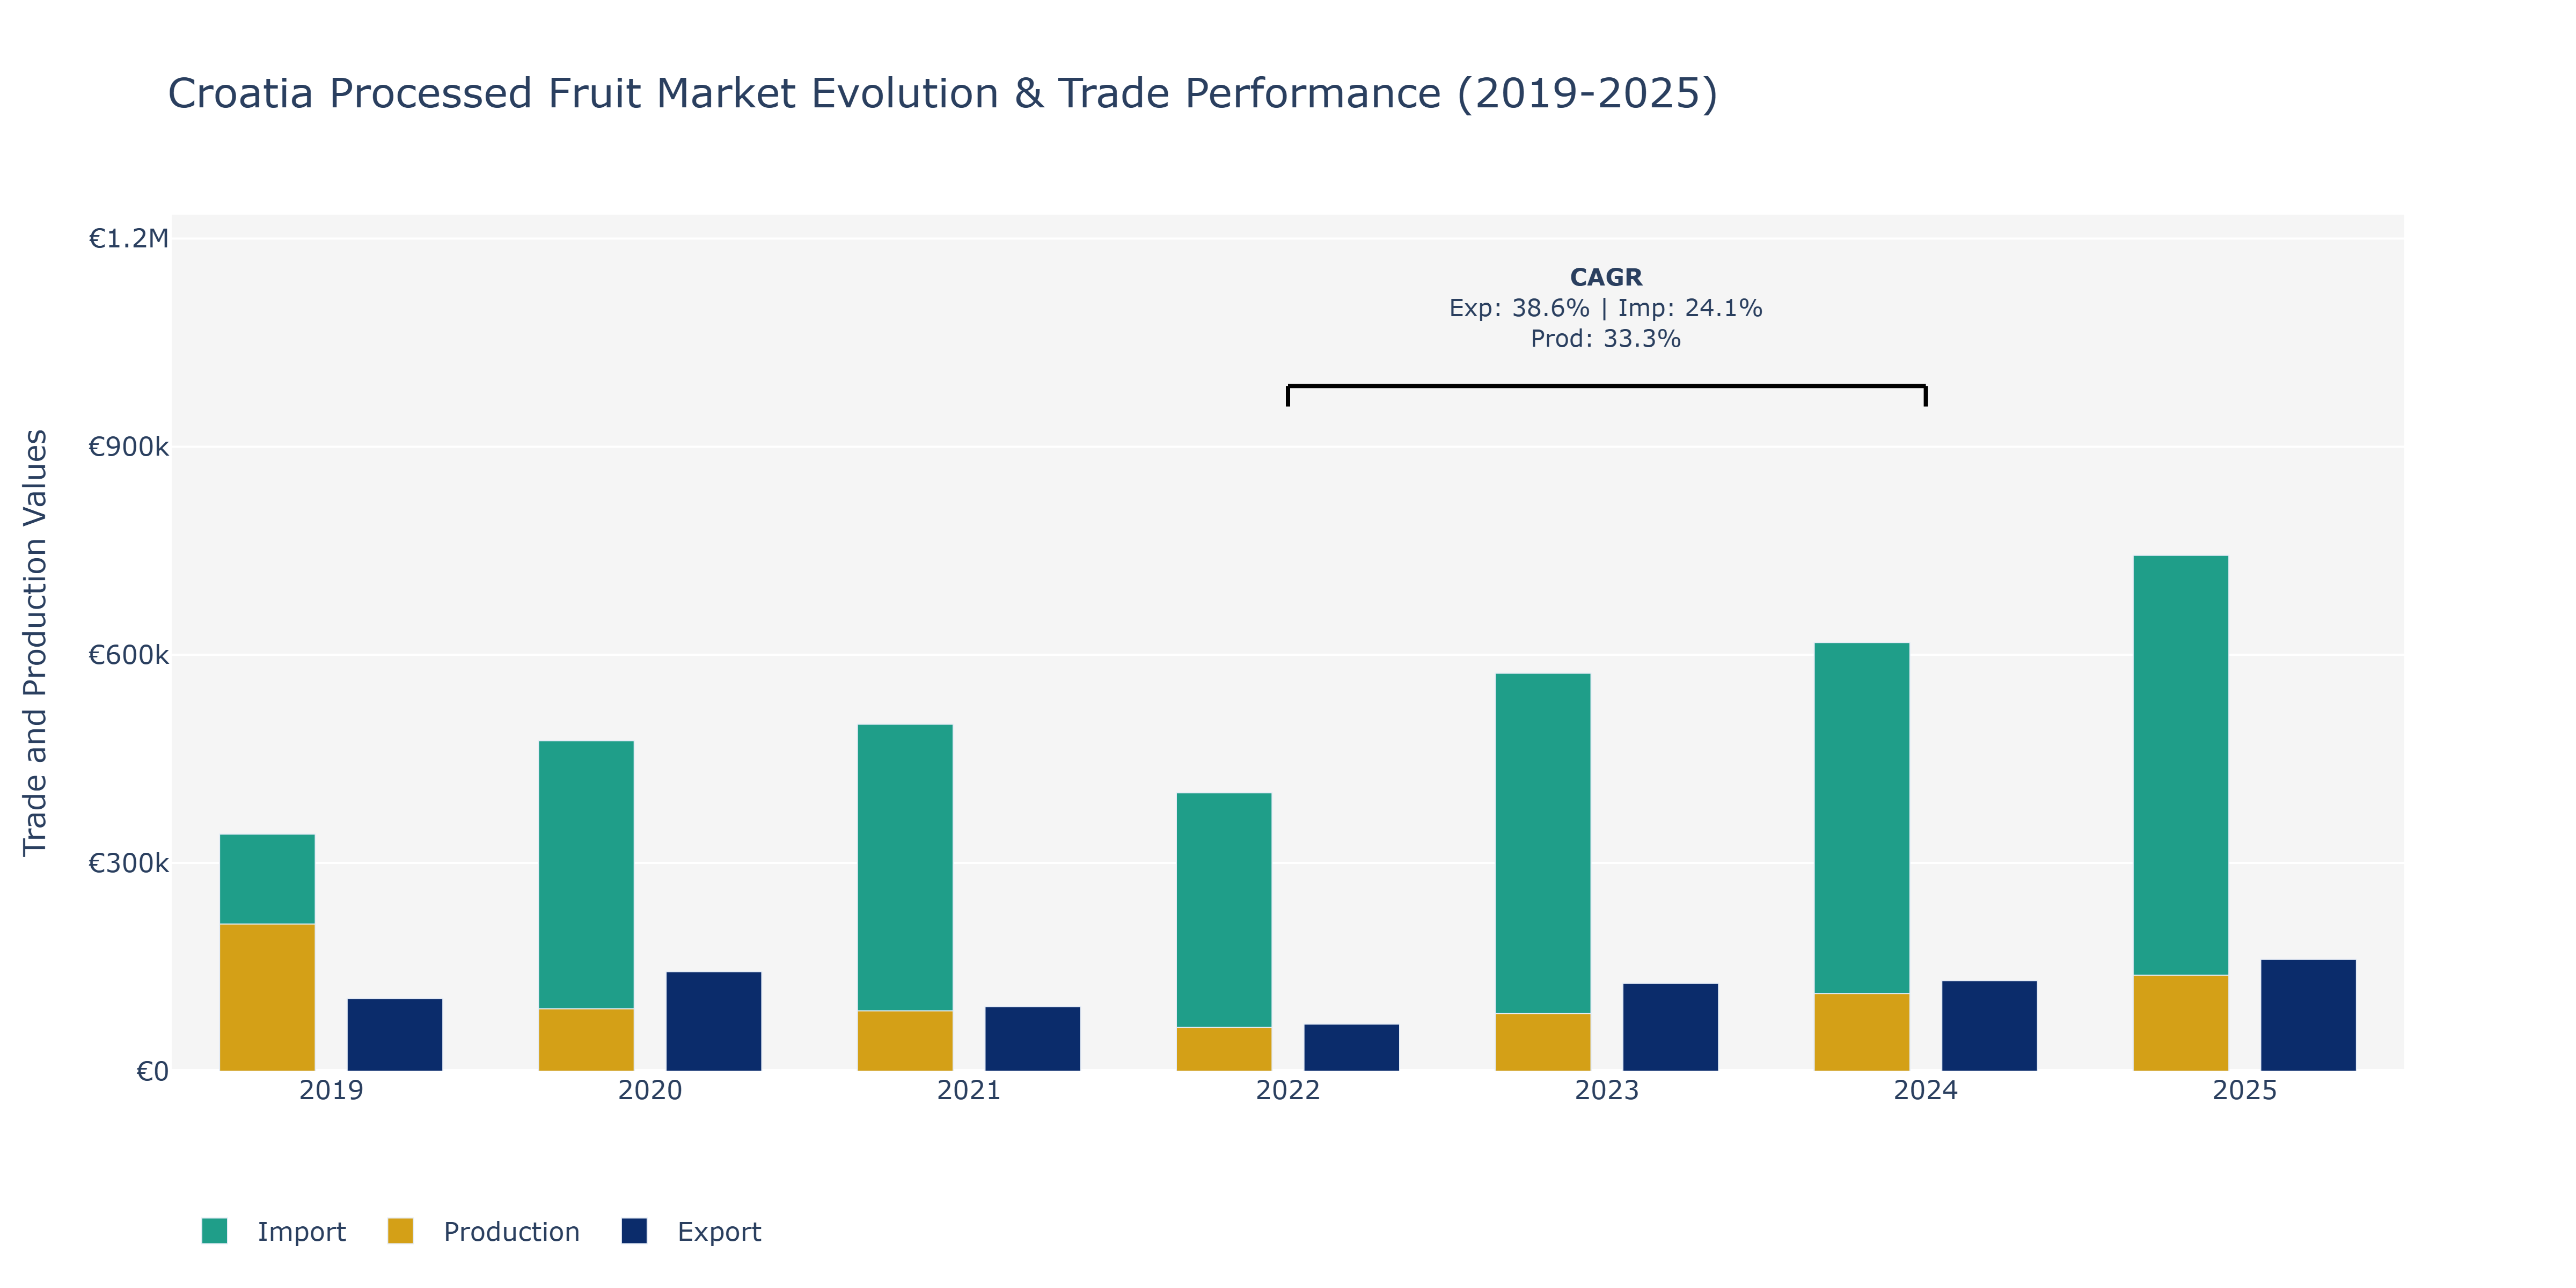
In the Croatia Processed Fruit Market, from 2019 to 2025, exports demonstrated a fluctuating trend, with a notable increase from €104.6 thousand in 2019 to €161.08 thousand in 2025, reaching a peak in the last year. Conversely, imports consistently rose from €341.7 thousand in 2019 to €743.59 thousand in 2025, showing a continuous upward trajectory. Production levels, on the other hand, experienced fluctuations but ultimately increased from €212.2 million in 2019 to €138.2 million in 2025, with a peak in 2024. These trends could be attributed to various factors such as changing consumer preferences, global demand shifts, and technological advancements in processing techniques. For instance, the increase in imports may be driven by growing demand for a variety of processed fruits not locally available, while fluctuations in production could be influenced by weather conditions affecting harvest yields and processing capacities.
Key Highlights of the Report:
- Croatia Processed Fruit Market Outlook
- Market Size of Croatia Processed Fruit Market, 2025
- Forecast of Croatia Processed Fruit Market, 2032
- Historical Data and Forecast of Croatia Processed Fruit Revenues & Volume for the Period 2022 - 2032F
- Croatia Processed Fruit Market Trend Evolution
- Croatia Processed Fruit Market Drivers and Challenges
- Croatia Processed Fruit Price Trends
- Croatia Processed Fruit Porter`s Five Forces
- Croatia Processed Fruit Industry Life Cycle
- Historical Data and Forecast of Croatia Processed Fruit Market Revenues & Volume By Product for the Period 2022 - 2032F
- Historical Data and Forecast of Croatia Processed Fruit Market Revenues & Volume By Fresh for the Period 2022 - 2032F
- Historical Data and Forecast of Croatia Processed Fruit Market Revenues & Volume By Fresh- Cut for the Period 2022 - 2032F
- Historical Data and Forecast of Croatia Processed Fruit Market Revenues & Volume By Canned for the Period 2022 - 2032F
- Historical Data and Forecast of Croatia Processed Fruit Market Revenues & Volume By Frozen for the Period 2022 - 2032F
- Historical Data and Forecast of Croatia Processed Fruit Market Revenues & Volume By Drying &Dehydration for the Period 2022 - 2032F
- Historical Data and Forecast of Croatia Processed Fruit Market Revenues & Volume By Processing Equipment for the Period 2022 - 2032F
- Historical Data and Forecast of Croatia Processed Fruit Market Revenues & Volume By Pre-processing for the Period 2022 - 2032F
- Historical Data and Forecast of Croatia Processed Fruit Market Revenues & Volume By Processing for the Period 2022 - 2032F
- Historical Data and Forecast of Croatia Processed Fruit Market Revenues & Volume By Washing for the Period 2022 - 2032F
- Historical Data and Forecast of Croatia Processed Fruit Market Revenues & Volume By Filling for the Period 2022 - 2032F
- Historical Data and Forecast of Croatia Processed Fruit Market Revenues & Volume By Seasoning for the Period 2022 - 2032F
- Historical Data and Forecast of Croatia Processed Fruit Market Revenues & Volume By Packaging for the Period 2022 - 2032F
- Croatia Processed Fruit Import Export Trade Statistics
- Market Opportunity Assessment By Product
- Market Opportunity Assessment By Processing Equipment
- Croatia Processed Fruit Top Companies Market Share
- Croatia Processed Fruit Competitive Benchmarking By Technical and Operational Parameters
- Croatia Processed Fruit Company Profiles
- Croatia Processed Fruit Key Strategic Recommendations
Frequently Asked Questions About the Market Study (FAQs):
6Wresearch actively monitors the Croatia Processed Fruit Market and publishes its comprehensive annual report, highlighting emerging trends, growth drivers, revenue analysis, and forecast outlook. Our insights help businesses to make data-backed strategic decisions with ongoing market dynamics. Our analysts track relevent industries related to the Croatia Processed Fruit Market, allowing our clients with actionable intelligence and reliable forecasts tailored to emerging regional needs.
Yes, we provide customisation as per your requirements. To learn more, feel free to contact us on sales@6wresearch.com
1 Executive Summary |
2 Introduction |
2.1 Key Highlights of the Report |
2.2 Report Description |
2.3 Market Scope & Segmentation |
2.4 Research Methodology |
2.5 Assumptions |
3 Croatia Processed Fruit Market Overview |
3.1 Croatia Country Macro Economic Indicators |
3.2 Croatia Processed Fruit Market Revenues & Volume, 2022 & 2032F |
3.3 Croatia Processed Fruit Market - Industry Life Cycle |
3.4 Croatia Processed Fruit Market - Porter's Five Forces |
3.5 Croatia Processed Fruit Market Revenues & Volume Share, By Product, 2022 & 2032F |
3.6 Croatia Processed Fruit Market Revenues & Volume Share, By Processing Equipment, 2022 & 2032F |
4 Croatia Processed Fruit Market Dynamics |
4.1 Impact Analysis |
4.2 Market Drivers |
4.2.1 Increasing consumer awareness about health benefits of processed fruits |
4.2.2 Growing demand for convenience foods due to busy lifestyles |
4.2.3 Expansion of retail channels and e-commerce platforms for processed fruit products |
4.3 Market Restraints |
4.3.1 Fluctuating raw material prices impacting production costs |
4.3.2 Seasonal availability of certain fruits affecting supply chain |
4.3.3 Intense competition from other snack and convenience food options |
5 Croatia Processed Fruit Market Trends |
6 Croatia Processed Fruit Market Segmentations |
6.1 Croatia Processed Fruit Market, By Product |
6.1.1 Overview and Analysis |
6.1.2 Croatia Processed Fruit Market Revenues & Volume, By Fresh, 2022 - 2032F |
6.1.3 Croatia Processed Fruit Market Revenues & Volume, By Fresh- Cut, 2022 - 2032F |
6.1.4 Croatia Processed Fruit Market Revenues & Volume, By Canned, 2022 - 2032F |
6.1.5 Croatia Processed Fruit Market Revenues & Volume, By Frozen, 2022 - 2032F |
6.1.6 Croatia Processed Fruit Market Revenues & Volume, By Drying &Dehydration, 2022 - 2032F |
6.2 Croatia Processed Fruit Market, By Processing Equipment |
6.2.1 Overview and Analysis |
6.2.2 Croatia Processed Fruit Market Revenues & Volume, By Pre-processing, 2022 - 2032F |
6.2.3 Croatia Processed Fruit Market Revenues & Volume, By Processing, 2022 - 2032F |
6.2.4 Croatia Processed Fruit Market Revenues & Volume, By Washing, 2022 - 2032F |
6.2.5 Croatia Processed Fruit Market Revenues & Volume, By Filling, 2022 - 2032F |
6.2.6 Croatia Processed Fruit Market Revenues & Volume, By Seasoning, 2022 - 2032F |
6.2.7 Croatia Processed Fruit Market Revenues & Volume, By Packaging, 2022 - 2032F |
7 Croatia Processed Fruit Market Import-Export Trade Statistics |
7.1 Croatia Processed Fruit Market Export to Major Countries |
7.2 Croatia Processed Fruit Market Imports from Major Countries |
8 Croatia Processed Fruit Market Key Performance Indicators |
8.1 Percentage increase in online sales of processed fruit products |
8.2 Customer retention rate for processed fruit brands |
8.3 Number of new product launches in the processed fruit market |
9 Croatia Processed Fruit Market - Opportunity Assessment |
9.1 Croatia Processed Fruit Market Opportunity Assessment, By Product, 2022 & 2032F |
9.2 Croatia Processed Fruit Market Opportunity Assessment, By Processing Equipment, 2022 & 2032F |
10 Croatia Processed Fruit Market - Competitive Landscape |
10.1 Croatia Processed Fruit Market Revenue Share, By Companies, 2025 |
10.2 Croatia Processed Fruit Market Competitive Benchmarking, By Operating and Technical Parameters |
11 Company Profiles |
12 Recommendations | 13 Disclaimer |
Global Go To Market Strategy - 2030
Export potential enables firms to identify high-growth global markets with greater confidence by combining advanced trade intelligence with a structured quantitative methodology. The framework analyzes emerging demand trends and country-level import patterns while integrating macroeconomic and trade datasets such as GDP and population forecasts, bilateral import–export flows, tariff structures, elasticity differentials between developed and developing economies, geographic distance, and import demand projections. Using weighted trade values from 2020–2024 as the base period to project country-to-country export potential for 2030, these inputs are operationalized through calculated drivers such as gravity model parameters, tariff impact factors, and projected GDP per-capita growth. Through an analysis of hidden potentials, demand hotspots, and market conditions that are most favorable to success, this method enables firms to focus on target countries, maximize returns, and global expansion with data, backed by accuracy.
By factoring in the projected importer demand gap that is currently unmet and could be potential opportunity, it identifies the potential for the Exporter (Country) among 190 countries, against the general trade analysis, which identifies the biggest importer or exporter.
To discover high-growth global markets and optimize your business strategy:
Click Here
Pricing
- Single User License$ 1,995
- Department License$ 2,400
- Site License$ 3,120
- Global License$ 3,795

Leadership Perspectives from Industry Events
Search
Thought Leadership and Analyst Meet


Our Clients
6WResearch In News
- Doha a strategic location for EV manufacturing hub: IPA Qatar
- Demand for luxury TVs surging in the GCC, says Samsung
- Empowering Growth: The Thriving Journey of Bangladesh’s Cable Industry
- Demand for luxury TVs surging in the GCC, says Samsung
- Video call with a traditional healer? Once unthinkable, it’s now common in South Africa
- Intelligent Buildings To Smooth GCC’s Path To Net Zero
Latest Reports
- Cape Verde Portable Hand-Thrown Extinguisher Market (2026-2032)
- Canada Portable Hand-Thrown Extinguisher Market (2026-2032)
- Cameroon Portable Hand-Thrown Extinguisher Market (2026-2032)
- Burundi Portable Hand-Thrown Extinguisher Market (2026-2032)
- Burkina Faso Portable Hand-Thrown Extinguisher Market (2026-2032)
- Bulgaria Portable Hand-Thrown Extinguisher Market (2026-2032)
- Brunei Portable Hand-Thrown Extinguisher Market (2026-2032)
- Botswana Portable Hand-Thrown Extinguisher Market (2026-2032)
- Bosnia and Herzegovina Portable Hand-Thrown Extinguisher Market (2026-2032)
- Bolivia Portable Hand-Thrown Extinguisher Market (2026-2032)
Industry Events and Analyst Meet

HIMTEX 2026

India Refining Summit 2026

India EV Show 2026

EV tech India Expo 2026

Auto Tech Asia 2026
Whitepaper
- Middle East & Africa Commercial Security Market Click here to view more.
- Middle East & Africa Fire Safety Systems & Equipment Market Click here to view more.
- GCC Drone Market Click here to view more.
- Middle East Lighting Fixture Market Click here to view more.
- GCC Physical & Perimeter Security Market Click here to view more.