Croatia Shaving Cream Market (2026-2032) | Share, Segmentation, Forecast, Analysis, Size, Revenue, Value, Outlook, Growth, Companies, Trends & Industry
Market Forecast By Product Types (Aftershave, Pre-shave, ), By Applications (Household, Hotel, Commercial, ), By Distribution Channels ( Supermarkets, Specialty Stores, Drug Stores, Convenience Stores, Online Retail) And Competitive Landscape
| Product Code: ETC5318293 | Publication Date: Nov 2023 | Updated Date: Apr 2026 | Product Type: Market Research Report | |
| Publisher: 6Wresearch | Author: Ravi Bhandari | No. of Pages: 60 | No. of Figures: 30 | No. of Tables: 5 |
Croatia Shaving Cream Market Size (2020-2030)
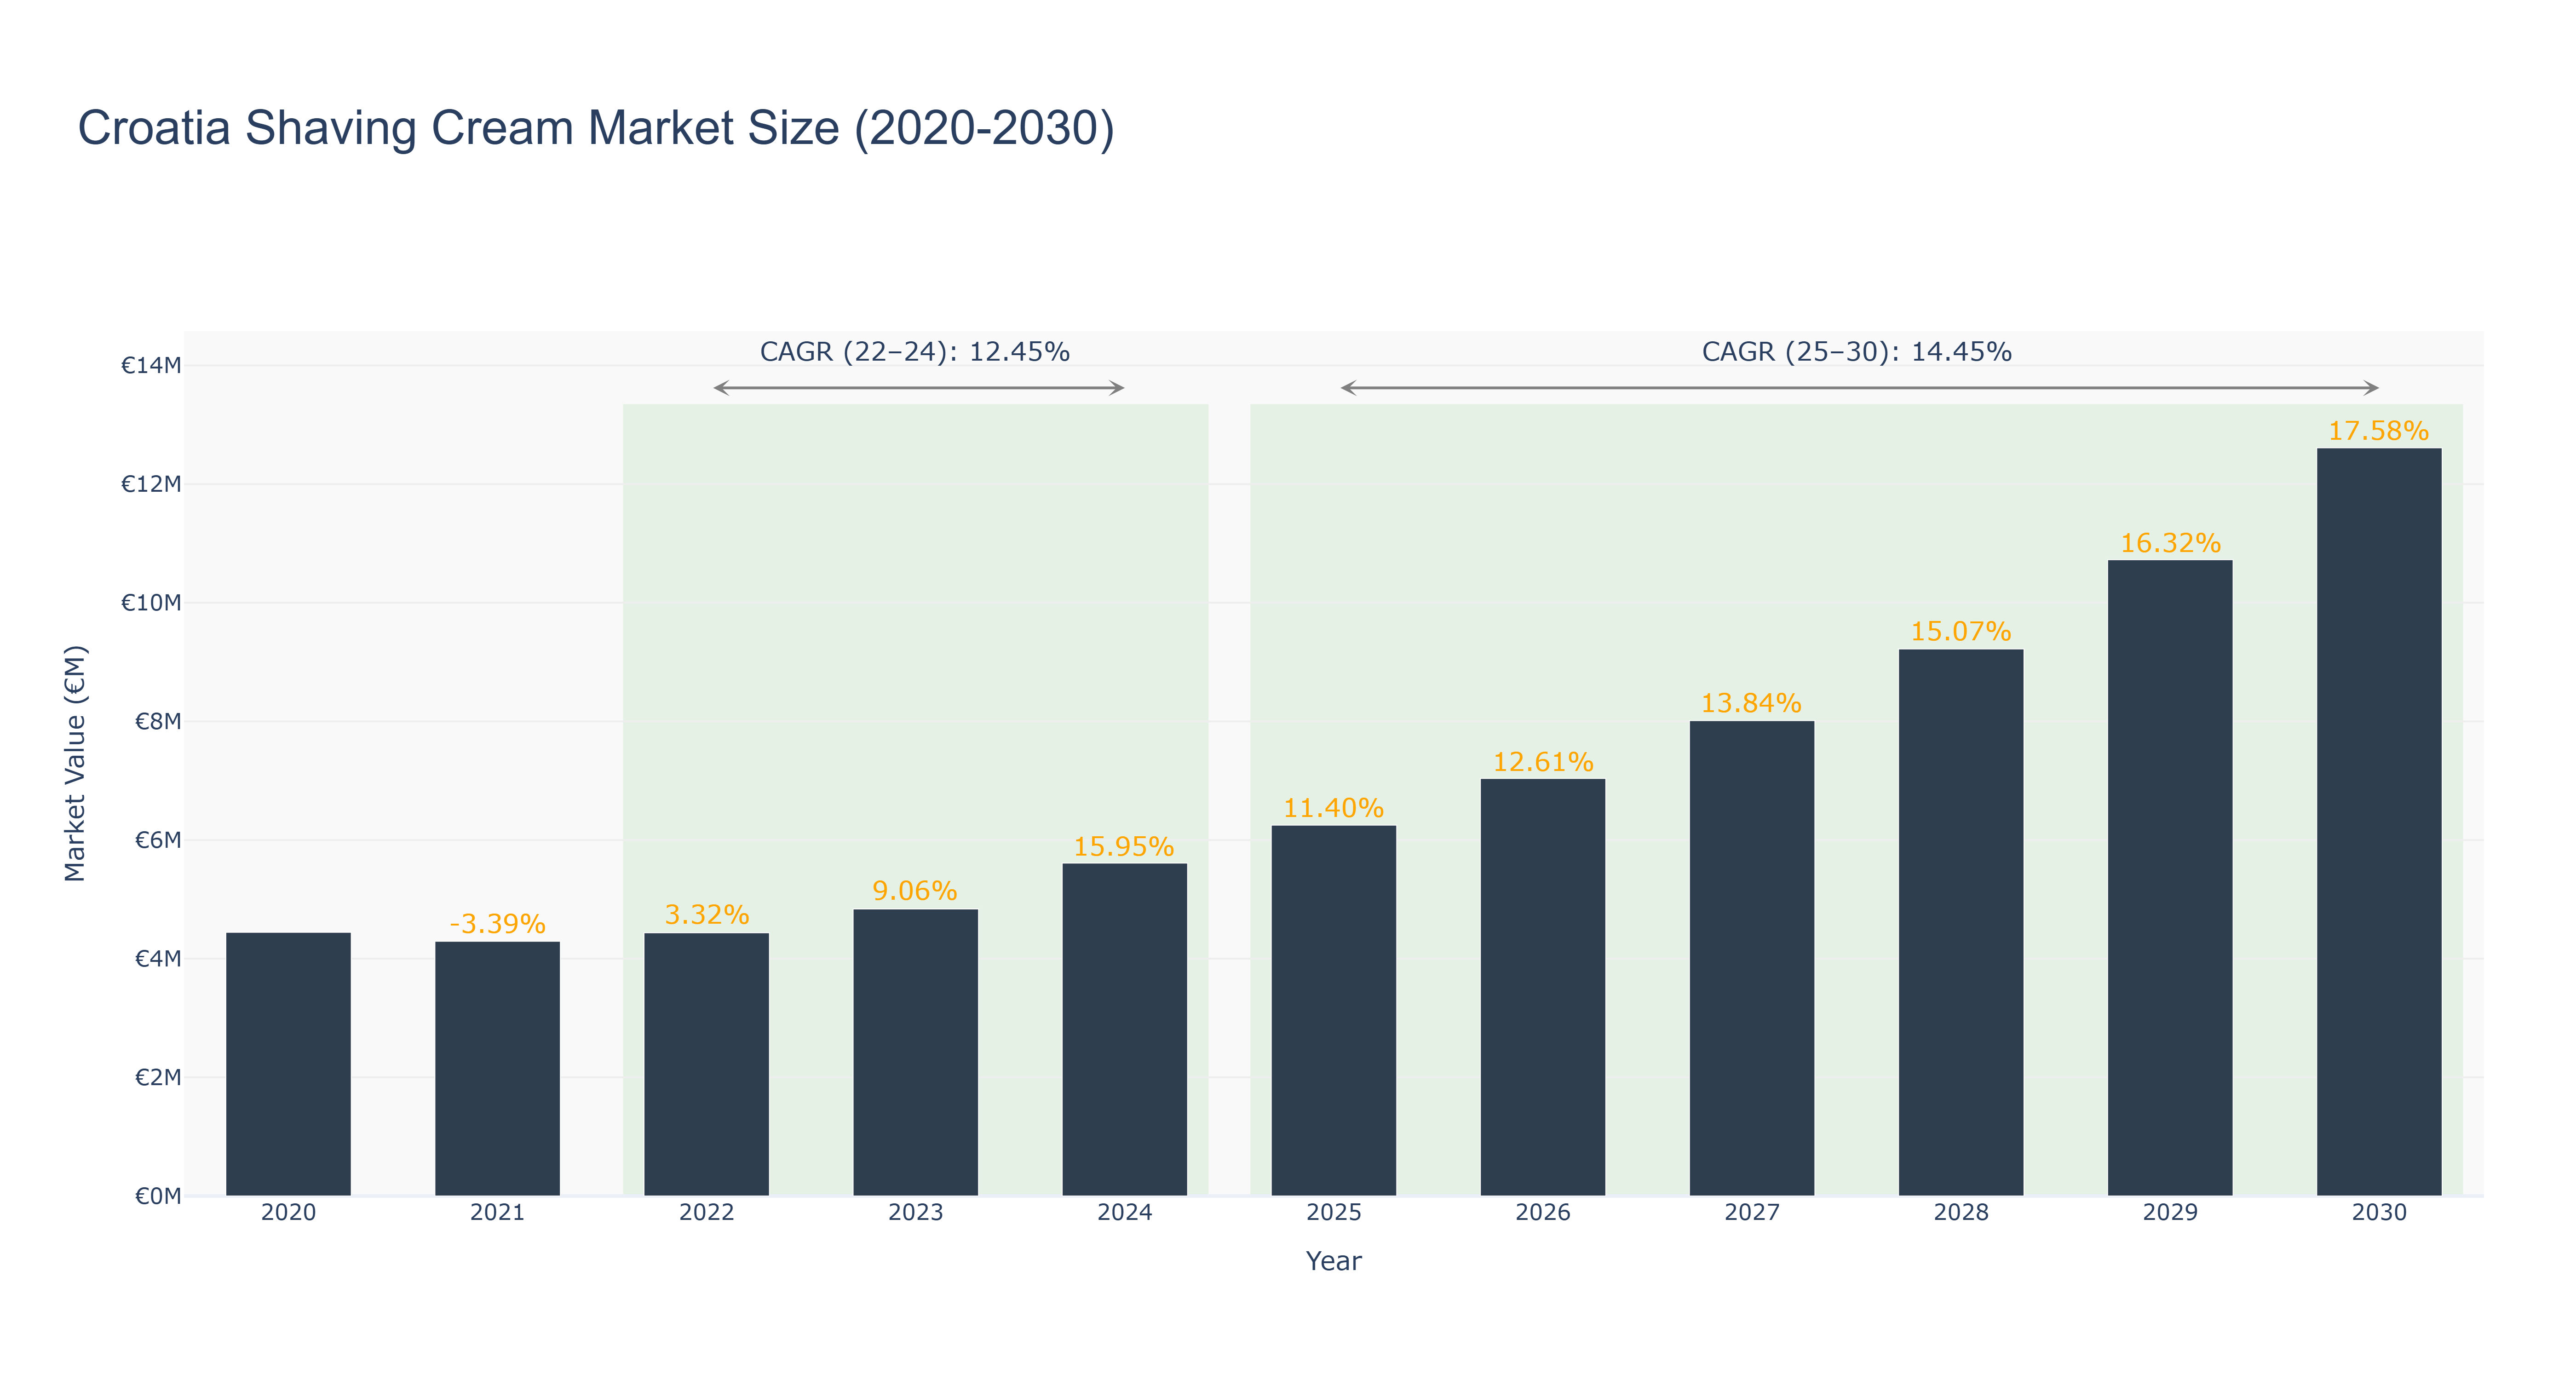
The Croatia Shaving Cream Market has shown a promising growth trend over the years. The peak market size of €12.61 million is forecasted for 2030, with a steady increase from €4.45 million in 2020. The market experienced significant growth from 2020 to 2024, driven by increasing consumer demand for grooming products. The forecasted CAGR for 2025-2030 stands at 14.45%, indicating a robust growth trajectory. The market's growth can be attributed to innovative product offerings and a growing focus on personal grooming among consumers. In the near future, Croatia is set to witness the launch of eco-friendly shaving cream products, aligning with the global sustainability trend. This development is expected to further boost market growth and cater to the rising demand for environmentally conscious products.
Croatia Shaving Cream Market: Production & Trade Performance (2019-2025)
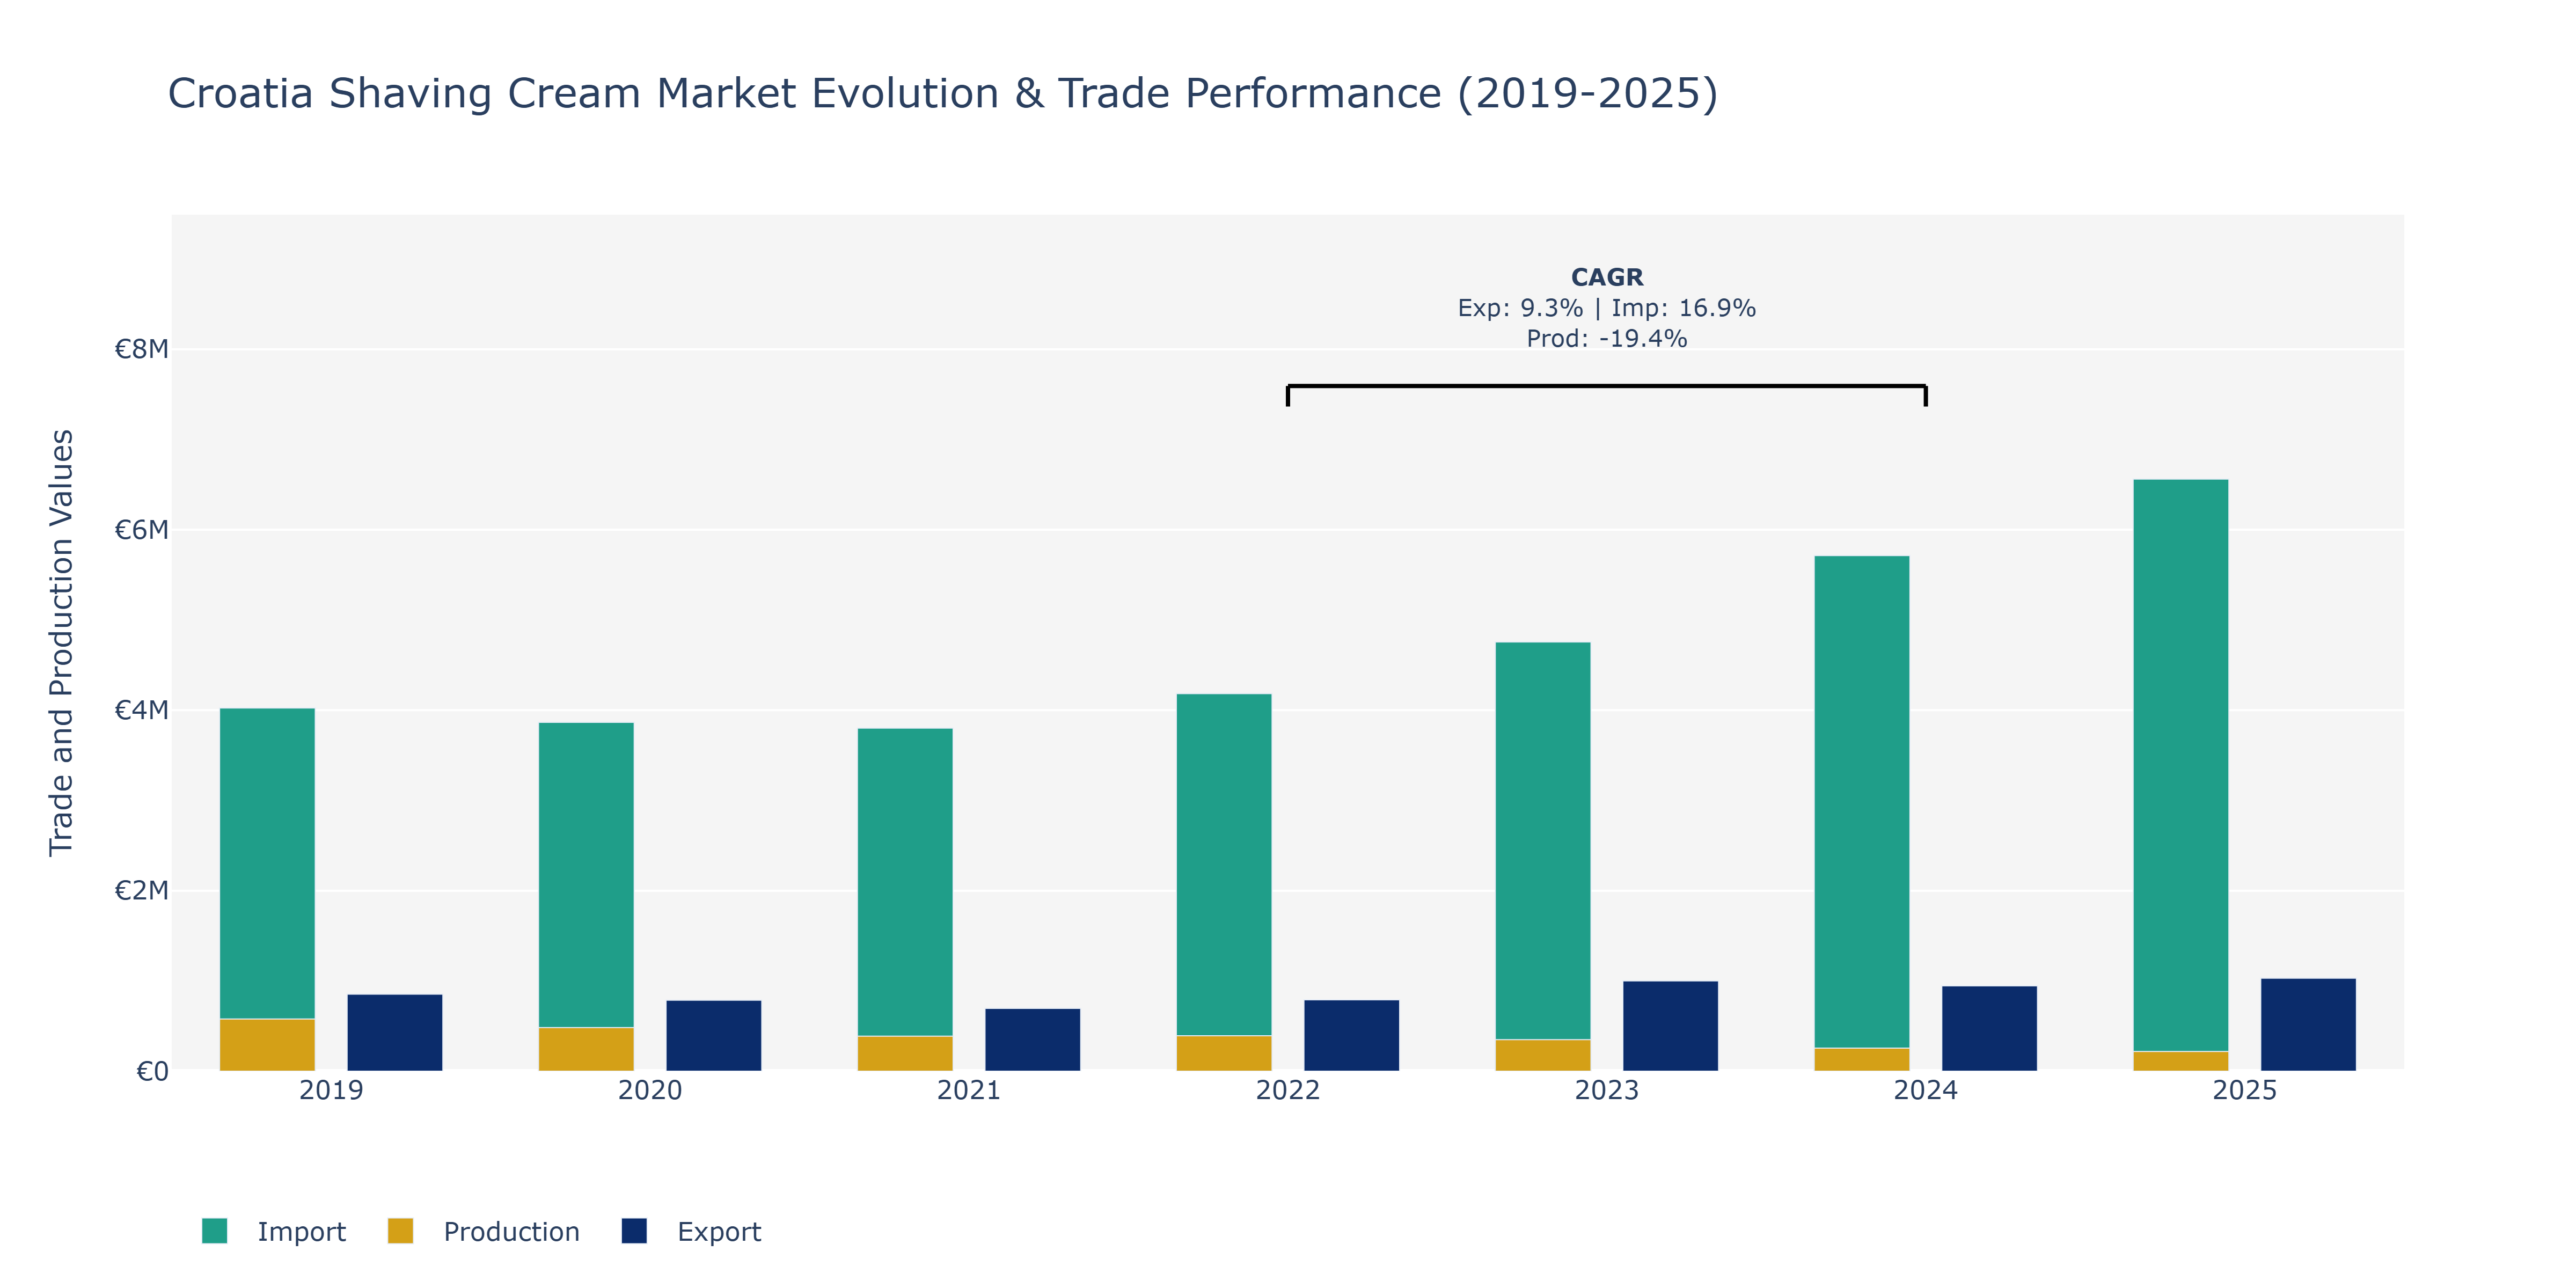
Between 2019 and 2025, the Croatia Shaving Cream Market witnessed varying trends in exports, imports, and production. Exports initially declined from €853.07 thousand in 2019 to €696.03 thousand in 2021 before showing a recovery reaching €1.0 million in 2023, with a slight decrease to €944.97 thousand in 2024 and then increasing again to around €1.03 million in 2025. Imports followed a similar pattern with a decrease from €4.02 million in 2019 to €3.8 million in 2021, peaking at €6.56 million in 2025. On the other hand, production experienced a significant drop from €578 million in 2019 to €350 thousand in 2023, recovering slightly to €255 thousand in 2024 and increasing to approximately €219 thousand in 2025. The fluctuations in exports and imports could be attributed to changing consumer preferences, economic conditions, and international trade agreements, while the decline in production might have been influenced by shifts in market demand, raw material costs, and production efficiency improvements within the industry.
Key Highlights of the Report:
- Croatia Shaving Cream Market Outlook
- Market Size of Croatia Shaving Cream Market, 2025
- Forecast of Croatia Shaving Cream Market, 2032
- Historical Data and Forecast of Croatia Shaving Cream Revenues & Volume for the Period 2022 - 2032F
- Croatia Shaving Cream Market Trend Evolution
- Croatia Shaving Cream Market Drivers and Challenges
- Croatia Shaving Cream Price Trends
- Croatia Shaving Cream Porter`s Five Forces
- Croatia Shaving Cream Industry Life Cycle
- Historical Data and Forecast of Croatia Shaving Cream Market Revenues & Volume By Product Types for the Period 2022 - 2032F
- Historical Data and Forecast of Croatia Shaving Cream Market Revenues & Volume By Aftershave for the Period 2022 - 2032F
- Historical Data and Forecast of Croatia Shaving Cream Market Revenues & Volume By Pre-shave for the Period 2022 - 2032F
- Historical Data and Forecast of Croatia Shaving Cream Market Revenues & Volume By for the Period 2022 - 2032F
- Historical Data and Forecast of Croatia Shaving Cream Market Revenues & Volume By Applications for the Period 2022 - 2032F
- Historical Data and Forecast of Croatia Shaving Cream Market Revenues & Volume By Household for the Period 2022 - 2032F
- Historical Data and Forecast of Croatia Shaving Cream Market Revenues & Volume By Hotel for the Period 2022 - 2032F
- Historical Data and Forecast of Croatia Shaving Cream Market Revenues & Volume By Commercial for the Period 2022 - 2032F
- Historical Data and Forecast of Croatia Shaving Cream Market Revenues & Volume By for the Period 2022 - 2032F
- Historical Data and Forecast of Croatia Shaving Cream Market Revenues & Volume By Distribution Channels for the Period 2022 - 2032F
- Historical Data and Forecast of Croatia Shaving Cream Market Revenues & Volume By Supermarkets for the Period 2022 - 2032F
- Historical Data and Forecast of Croatia Shaving Cream Market Revenues & Volume By Specialty Stores for the Period 2022 - 2032F
- Historical Data and Forecast of Croatia Shaving Cream Market Revenues & Volume By Drug Stores for the Period 2022 - 2032F
- Historical Data and Forecast of Croatia Shaving Cream Market Revenues & Volume By Convenience Stores for the Period 2022 - 2032F
- Historical Data and Forecast of Croatia Shaving Cream Market Revenues & Volume By Online Retail for the Period 2022 - 2032F
- Croatia Shaving Cream Import Export Trade Statistics
- Market Opportunity Assessment By Product Types
- Market Opportunity Assessment By Applications
- Market Opportunity Assessment By Distribution Channels
- Croatia Shaving Cream Top Companies Market Share
- Croatia Shaving Cream Competitive Benchmarking By Technical and Operational Parameters
- Croatia Shaving Cream Company Profiles
- Croatia Shaving Cream Key Strategic Recommendations
Frequently Asked Questions About the Market Study (FAQs):
6Wresearch actively monitors the Croatia Shaving Cream Market and publishes its comprehensive annual report, highlighting emerging trends, growth drivers, revenue analysis, and forecast outlook. Our insights help businesses to make data-backed strategic decisions with ongoing market dynamics. Our analysts track relevent industries related to the Croatia Shaving Cream Market, allowing our clients with actionable intelligence and reliable forecasts tailored to emerging regional needs.
Yes, we provide customisation as per your requirements. To learn more, feel free to contact us on sales@6wresearch.com
1 Executive Summary |
2 Introduction |
2.1 Key Highlights of the Report |
2.2 Report Description |
2.3 Market Scope & Segmentation |
2.4 Research Methodology |
2.5 Assumptions |
3 Croatia Shaving Cream Market Overview |
3.1 Croatia Country Macro Economic Indicators |
3.2 Croatia Shaving Cream Market Revenues & Volume, 2022 & 2032F |
3.3 Croatia Shaving Cream Market - Industry Life Cycle |
3.4 Croatia Shaving Cream Market - Porter's Five Forces |
3.5 Croatia Shaving Cream Market Revenues & Volume Share, By Product Types, 2022 & 2032F |
3.6 Croatia Shaving Cream Market Revenues & Volume Share, By Applications , 2022 & 2032F |
3.7 Croatia Shaving Cream Market Revenues & Volume Share, By Distribution Channels, 2022 & 2032F |
4 Croatia Shaving Cream Market Dynamics |
4.1 Impact Analysis |
4.2 Market Drivers |
4.2.1 Increasing focus on personal grooming and hygiene |
4.2.2 Growing disposable income of consumers in Croatia |
4.2.3 Rising awareness about skincare products and routines |
4.3 Market Restraints |
4.3.1 Intense competition from established and new brands in the market |
4.3.2 Price sensitivity among consumers |
4.3.3 Fluctuating raw material prices affecting production costs |
5 Croatia Shaving Cream Market Trends |
6 Croatia Shaving Cream Market Segmentations |
6.1 Croatia Shaving Cream Market, By Product Types |
6.1.1 Overview and Analysis |
6.1.2 Croatia Shaving Cream Market Revenues & Volume, By Aftershave, 2022 - 2032F |
6.1.3 Croatia Shaving Cream Market Revenues & Volume, By Pre-shave, 2022 - 2032F |
6.1.4 Croatia Shaving Cream Market Revenues & Volume, By ? , 2022 - 2032F |
6.2 Croatia Shaving Cream Market, By Applications |
6.2.1 Overview and Analysis |
6.2.2 Croatia Shaving Cream Market Revenues & Volume, By Household, 2022 - 2032F |
6.2.3 Croatia Shaving Cream Market Revenues & Volume, By Hotel, 2022 - 2032F |
6.2.4 Croatia Shaving Cream Market Revenues & Volume, By Commercial, 2022 - 2032F |
6.2.5 Croatia Shaving Cream Market Revenues & Volume, By ? , 2022 - 2032F |
6.3 Croatia Shaving Cream Market, By Distribution Channels |
6.3.1 Overview and Analysis |
6.3.2 Croatia Shaving Cream Market Revenues & Volume, By Supermarkets, 2022 - 2032F |
6.3.3 Croatia Shaving Cream Market Revenues & Volume, By Specialty Stores, 2022 - 2032F |
6.3.4 Croatia Shaving Cream Market Revenues & Volume, By Drug Stores, 2022 - 2032F |
6.3.5 Croatia Shaving Cream Market Revenues & Volume, By Convenience Stores, 2022 - 2032F |
6.3.6 Croatia Shaving Cream Market Revenues & Volume, By Online Retail, 2022 - 2032F |
7 Croatia Shaving Cream Market Import-Export Trade Statistics |
7.1 Croatia Shaving Cream Market Export to Major Countries |
7.2 Croatia Shaving Cream Market Imports from Major Countries |
8 Croatia Shaving Cream Market Key Performance Indicators |
8.1 Customer satisfaction score (based on feedback and reviews) |
8.2 Rate of new product adoption in the market |
8.3 Growth in the number of distribution channels carrying shaving cream products |
8.4 Increase in social media engagement and brand visibility |
8.5 Trends in online search volume for shaving cream-related keywords |
9 Croatia Shaving Cream Market - Opportunity Assessment |
9.1 Croatia Shaving Cream Market Opportunity Assessment, By Product Types, 2022 & 2032F |
9.2 Croatia Shaving Cream Market Opportunity Assessment, By Applications , 2022 & 2032F |
9.3 Croatia Shaving Cream Market Opportunity Assessment, By Distribution Channels, 2022 & 2032F |
10 Croatia Shaving Cream Market - Competitive Landscape |
10.1 Croatia Shaving Cream Market Revenue Share, By Companies, 2025 |
10.2 Croatia Shaving Cream Market Competitive Benchmarking, By Operating and Technical Parameters |
11 Company Profiles |
12 Recommendations | 13 Disclaimer |
Global Go To Market Strategy - 2030
Export potential enables firms to identify high-growth global markets with greater confidence by combining advanced trade intelligence with a structured quantitative methodology. The framework analyzes emerging demand trends and country-level import patterns while integrating macroeconomic and trade datasets such as GDP and population forecasts, bilateral import–export flows, tariff structures, elasticity differentials between developed and developing economies, geographic distance, and import demand projections. Using weighted trade values from 2020–2024 as the base period to project country-to-country export potential for 2030, these inputs are operationalized through calculated drivers such as gravity model parameters, tariff impact factors, and projected GDP per-capita growth. Through an analysis of hidden potentials, demand hotspots, and market conditions that are most favorable to success, this method enables firms to focus on target countries, maximize returns, and global expansion with data, backed by accuracy.
By factoring in the projected importer demand gap that is currently unmet and could be potential opportunity, it identifies the potential for the Exporter (Country) among 190 countries, against the general trade analysis, which identifies the biggest importer or exporter.
To discover high-growth global markets and optimize your business strategy:
Click Here
Pricing
- Single User License$ 1,995
- Department License$ 2,400
- Site License$ 3,120
- Global License$ 3,795

Leadership Perspectives from Industry Events
Search
Thought Leadership and Analyst Meet


Our Clients
6WResearch In News
- India Export Attractiveness Tracker 2026
- India Air Conditioner Market Set for Strong Rebound in 2026 After Weather-Led Correction and GST-Driven Recovery: 6Wresearch
- ADAS in India: How Automatic Emergency Braking, Blind Spot Detection & Driver Monitoring are Transforming Road Safety
- Doha a strategic location for EV manufacturing hub: IPA Qatar
- Demand for luxury TVs surging in the GCC, says Samsung
- Empowering Growth: The Thriving Journey of Bangladesh’s Cable Industry
Latest Reports
- Qatar Access and Home Network Market (2026-2032)
- Nicaragua RPG Gaming Market (2026-2032)
- New Zealand RPG Gaming Market (2026-2032)
- Netherlands RPG Gaming Market (2026-2032)
- Nauru RPG Gaming Market (2026-2032)
- Namibia RPG Gaming Market (2026-2032)
- Mozambique RPG Gaming Market (2026-2032)
- Montenegro RPG Gaming Market (2026-2032)
- Mongolia RPG Gaming Market (2026-2032)
- Monaco RPG Gaming Market (2026-2032)
Industry Events and Analyst Meet

EV India Expo 2026

HIMTEX 2026

India Refining Summit 2026

India EV Show 2026

EV tech India Expo 2026
Whitepaper
- Middle East & Africa Commercial Security Market Click here to view more.
- Middle East & Africa Fire Safety Systems & Equipment Market Click here to view more.
- GCC Drone Market Click here to view more.
- Middle East Lighting Fixture Market Click here to view more.
- GCC Physical & Perimeter Security Market Click here to view more.