Cyprus Graphene Market (2025-2031) | Industry, Outlook, Share, Growth, Trends, Size & Revenue, Forecast, Competitive Landscape, Segmentation, Value, Companies, Analysis
Market Forecast By Type (Bulk Graphene, Monolayer Graphene), By Application (Composites, Paints, Coatings, and Inks, Energy Storage & Harvesting, Electronics, Catalyst, Tires, Others), By End-use Industry (Automotive & Transportation, Aerospace, Electronics, Military & Defense, Others) And Competitive Landscape
| Product Code: ETC6895676 | Publication Date: Sep 2024 | Updated Date: Apr 2026 | Product Type: Market Research Report | |
| Publisher: 6Wresearch | Author: Shubham Padhi | No. of Pages: 75 | No. of Figures: 35 | No. of Tables: 20 |
Cyprus Graphene Market Size (2020-2030)
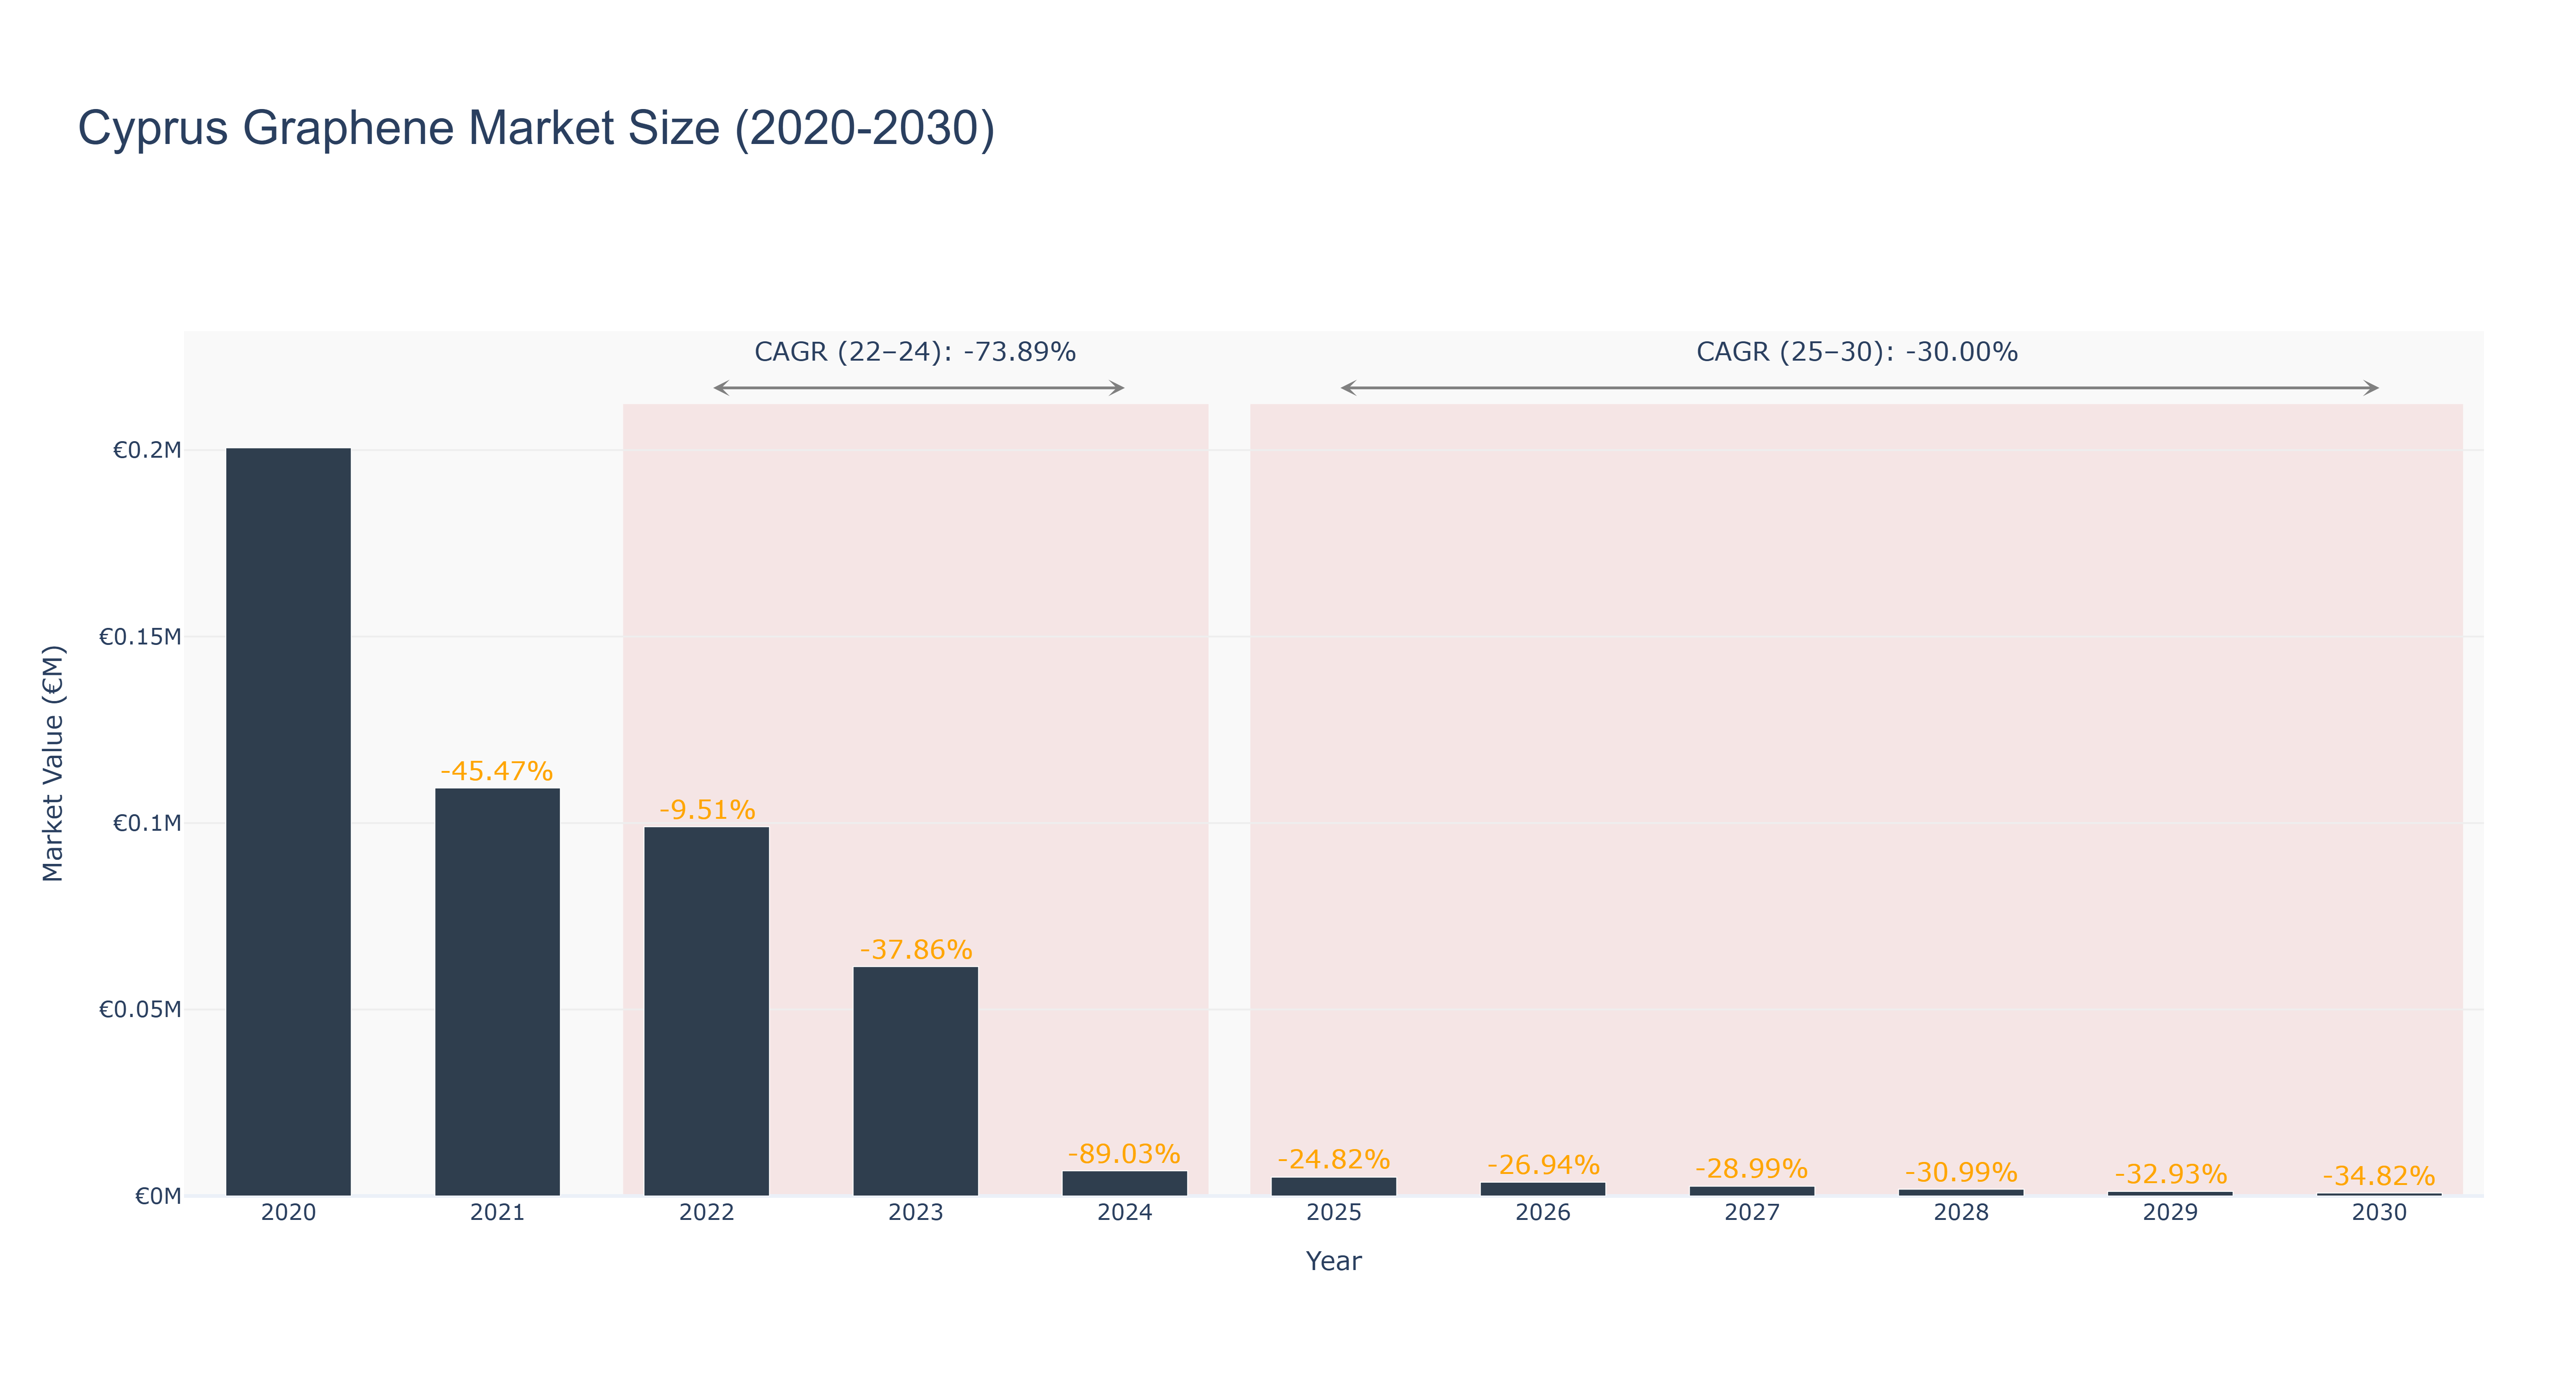
The Cyprus Graphene Market has experienced a significant decline in recent years, with actual market sizes decreasing from €200.61 thousand in 2020 to a low of €6.75 thousand in 2024, reflecting a compounded annual growth rate (CAGR) of -73.89% from 2022 to 2024. The downturn can be attributed to various factors, including reduced investment in research and development, market saturation, and limited commercial applications of graphene within the region. Looking ahead, the forecasted period from 2025 to 2030 indicates a continued contraction, with projected market sizes decreasing to €1.22 thousand by 2029 and a CAGR of -30.00%. Despite these challenges, potential avenues for growth exist, driven by increasing interest in advanced materials and sustainability initiatives. Strategic collaborations and technological advancements may help revitalize the market, although substantial recovery appears unlikely in the short term without significant innovation or external investment.
Cyprus Graphene Market: Production & Trade Performance (2019-2025)
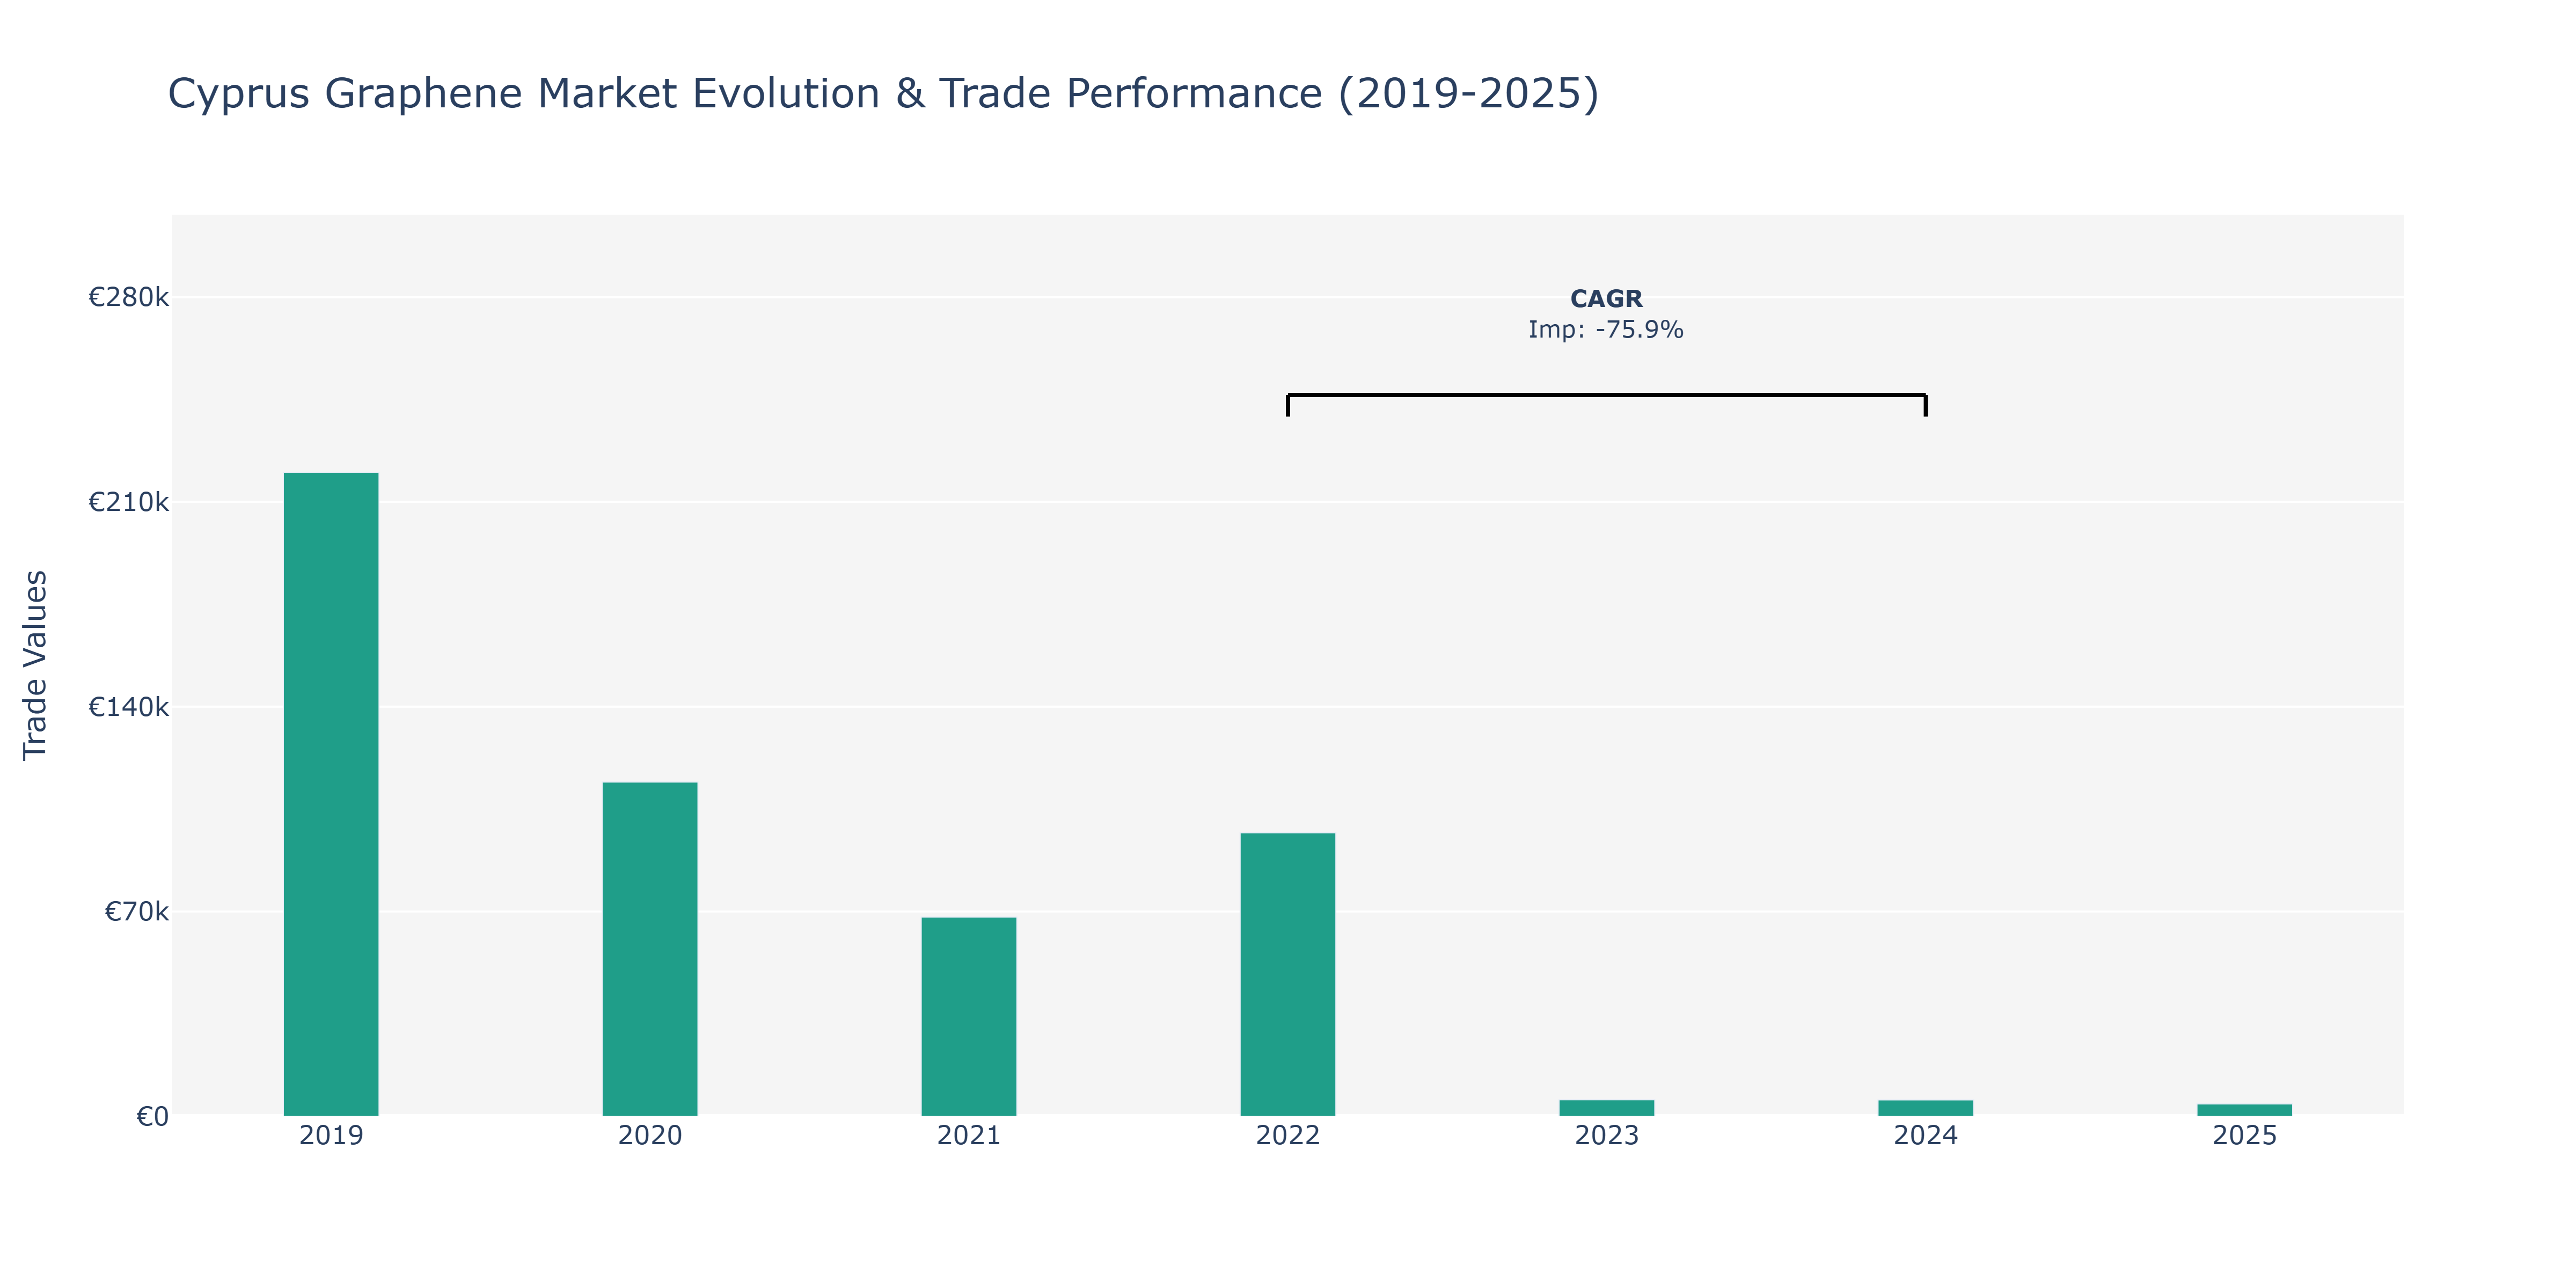
Over the observed period, Imports in the Cyprus Graphene Market exhibited notable fluctuations. In 2019, imports stood at €220.13 thousand, showing a substantial decline to €114.22 thousand in 2020. The trend continued downwards in 2021, with imports dropping to €68.11 thousand. A slight recovery was witnessed in 2022, reaching €96.89 thousand before experiencing a sharp decrease to €5.64 thousand in 2023. This decline continued into 2024, with imports remaining relatively stable at €5.61 thousand. By 2025, imports further decreased to €4.21 thousand. The drastic fluctuations in imports can be attributed to various factors, such as changes in global graphene supply chains, economic conditions affecting demand, and possibly shifts in government regulations impacting trade dynamics. The market's volatility underscores the importance of market players adapting swiftly to changing conditions to ensure sustainability and growth in the Cyprus Graphene Market.
Key Highlights of the Report:
- Cyprus Graphene Market Outlook
- Market Size of Cyprus Graphene Market, 2024
- Forecast of Cyprus Graphene Market, 2031
- Historical Data and Forecast of Cyprus Graphene Revenues & Volume for the Period 2021- 2031
- Cyprus Graphene Market Trend Evolution
- Cyprus Graphene Market Drivers and Challenges
- Cyprus Graphene Price Trends
- Cyprus Graphene Porter's Five Forces
- Cyprus Graphene Industry Life Cycle
- Historical Data and Forecast of Cyprus Graphene Market Revenues & Volume By Type for the Period 2021- 2031
- Historical Data and Forecast of Cyprus Graphene Market Revenues & Volume By Bulk Graphene for the Period 2021- 2031
- Historical Data and Forecast of Cyprus Graphene Market Revenues & Volume By Monolayer Graphene for the Period 2021- 2031
- Historical Data and Forecast of Cyprus Graphene Market Revenues & Volume By Application for the Period 2021- 2031
- Historical Data and Forecast of Cyprus Graphene Market Revenues & Volume By Composites for the Period 2021- 2031
- Historical Data and Forecast of Cyprus Graphene Market Revenues & Volume By Paints, Coatings, and Inks for the Period 2021- 2031
- Historical Data and Forecast of Cyprus Graphene Market Revenues & Volume By Energy Storage & Harvesting for the Period 2021- 2031
- Historical Data and Forecast of Cyprus Graphene Market Revenues & Volume By Electronics for the Period 2021- 2031
- Historical Data and Forecast of Cyprus Graphene Market Revenues & Volume By Catalyst for the Period 2021- 2031
- Historical Data and Forecast of Cyprus Graphene Market Revenues & Volume By Tires for the Period 2021- 2031
- Historical Data and Forecast of Cyprus Graphene Market Revenues & Volume By Others for the Period 2021- 2031
- Historical Data and Forecast of Cyprus Graphene Market Revenues & Volume By End-use Industry for the Period 2021- 2031
- Historical Data and Forecast of Cyprus Graphene Market Revenues & Volume By Automotive & Transportation for the Period 2021- 2031
- Historical Data and Forecast of Cyprus Graphene Market Revenues & Volume By Aerospace for the Period 2021- 2031
- Historical Data and Forecast of Cyprus Graphene Market Revenues & Volume By Electronics for the Period 2021- 2031
- Historical Data and Forecast of Cyprus Graphene Market Revenues & Volume By Military & Defense for the Period 2021- 2031
- Historical Data and Forecast of Cyprus Graphene Market Revenues & Volume By Others for the Period 2021- 2031
- Cyprus Graphene Import Export Trade Statistics
- Market Opportunity Assessment By Type
- Market Opportunity Assessment By Application
- Market Opportunity Assessment By End-use Industry
- Cyprus Graphene Top Companies Market Share
- Cyprus Graphene Competitive Benchmarking By Technical and Operational Parameters
- Cyprus Graphene Company Profiles
- Cyprus Graphene Key Strategic Recommendations
Frequently Asked Questions About the Market Study (FAQs):
6Wresearch actively monitors the Cyprus Graphene Market and publishes its comprehensive annual report, highlighting emerging trends, growth drivers, revenue analysis, and forecast outlook. Our insights help businesses to make data-backed strategic decisions with ongoing market dynamics. Our analysts track relevent industries related to the Cyprus Graphene Market, allowing our clients with actionable intelligence and reliable forecasts tailored to emerging regional needs.
Yes, we provide customisation as per your requirements. To learn more, feel free to contact us on sales@6wresearch.com
1 Executive Summary |
2 Introduction |
2.1 Key Highlights of the Report |
2.2 Report Description |
2.3 Market Scope & Segmentation |
2.4 Research Methodology |
2.5 Assumptions |
3 Cyprus Graphene Market Overview |
3.1 Cyprus Country Macro Economic Indicators |
3.2 Cyprus Graphene Market Revenues & Volume, 2021 & 2031F |
3.3 Cyprus Graphene Market - Industry Life Cycle |
3.4 Cyprus Graphene Market - Porter's Five Forces |
3.5 Cyprus Graphene Market Revenues & Volume Share, By Type, 2021 & 2031F |
3.6 Cyprus Graphene Market Revenues & Volume Share, By Application, 2021 & 2031F |
3.7 Cyprus Graphene Market Revenues & Volume Share, By End-use Industry, 2021 & 2031F |
4 Cyprus Graphene Market Dynamics |
4.1 Impact Analysis |
4.2 Market Drivers |
4.3 Market Restraints |
5 Cyprus Graphene Market Trends |
6 Cyprus Graphene Market, By Types |
6.1 Cyprus Graphene Market, By Type |
6.1.1 Overview and Analysis |
6.1.2 Cyprus Graphene Market Revenues & Volume, By Type, 2021- 2031F |
6.1.3 Cyprus Graphene Market Revenues & Volume, By Bulk Graphene, 2021- 2031F |
6.1.4 Cyprus Graphene Market Revenues & Volume, By Monolayer Graphene, 2021- 2031F |
6.2 Cyprus Graphene Market, By Application |
6.2.1 Overview and Analysis |
6.2.2 Cyprus Graphene Market Revenues & Volume, By Composites, 2021- 2031F |
6.2.3 Cyprus Graphene Market Revenues & Volume, By Paints, Coatings, and Inks, 2021- 2031F |
6.2.4 Cyprus Graphene Market Revenues & Volume, By Energy Storage & Harvesting, 2021- 2031F |
6.2.5 Cyprus Graphene Market Revenues & Volume, By Electronics, 2021- 2031F |
6.2.6 Cyprus Graphene Market Revenues & Volume, By Catalyst, 2021- 2031F |
6.2.7 Cyprus Graphene Market Revenues & Volume, By Tires, 2021- 2031F |
6.3 Cyprus Graphene Market, By End-use Industry |
6.3.1 Overview and Analysis |
6.3.2 Cyprus Graphene Market Revenues & Volume, By Automotive & Transportation, 2021- 2031F |
6.3.3 Cyprus Graphene Market Revenues & Volume, By Aerospace, 2021- 2031F |
6.3.4 Cyprus Graphene Market Revenues & Volume, By Electronics, 2021- 2031F |
6.3.5 Cyprus Graphene Market Revenues & Volume, By Military & Defense, 2021- 2031F |
6.3.6 Cyprus Graphene Market Revenues & Volume, By Others, 2021- 2031F |
7 Cyprus Graphene Market Import-Export Trade Statistics |
7.1 Cyprus Graphene Market Export to Major Countries |
7.2 Cyprus Graphene Market Imports from Major Countries |
8 Cyprus Graphene Market Key Performance Indicators |
9 Cyprus Graphene Market - Opportunity Assessment |
9.1 Cyprus Graphene Market Opportunity Assessment, By Type, 2021 & 2031F |
9.2 Cyprus Graphene Market Opportunity Assessment, By Application, 2021 & 2031F |
9.3 Cyprus Graphene Market Opportunity Assessment, By End-use Industry, 2021 & 2031F |
10 Cyprus Graphene Market - Competitive Landscape |
10.1 Cyprus Graphene Market Revenue Share, By Companies, 2024 |
10.2 Cyprus Graphene Market Competitive Benchmarking, By Operating and Technical Parameters |
11 Company Profiles |
12 Recommendations |
13 Disclaimer |
Global Go To Market Strategy - 2030
Export potential enables firms to identify high-growth global markets with greater confidence by combining advanced trade intelligence with a structured quantitative methodology. The framework analyzes emerging demand trends and country-level import patterns while integrating macroeconomic and trade datasets such as GDP and population forecasts, bilateral import–export flows, tariff structures, elasticity differentials between developed and developing economies, geographic distance, and import demand projections. Using weighted trade values from 2020–2024 as the base period to project country-to-country export potential for 2030, these inputs are operationalized through calculated drivers such as gravity model parameters, tariff impact factors, and projected GDP per-capita growth. Through an analysis of hidden potentials, demand hotspots, and market conditions that are most favorable to success, this method enables firms to focus on target countries, maximize returns, and global expansion with data, backed by accuracy.
By factoring in the projected importer demand gap that is currently unmet and could be potential opportunity, it identifies the potential for the Exporter (Country) among 190 countries, against the general trade analysis, which identifies the biggest importer or exporter.
To discover high-growth global markets and optimize your business strategy:
Click Here
Pricing
- Single User License$ 1,995
- Department License$ 2,400
- Site License$ 3,120
- Global License$ 3,795

Leadership Perspectives from Industry Events
Search
Thought Leadership and Analyst Meet


Our Clients
6WResearch In News
- Doha a strategic location for EV manufacturing hub: IPA Qatar
- Demand for luxury TVs surging in the GCC, says Samsung
- Empowering Growth: The Thriving Journey of Bangladesh’s Cable Industry
- Demand for luxury TVs surging in the GCC, says Samsung
- Video call with a traditional healer? Once unthinkable, it’s now common in South Africa
- Intelligent Buildings To Smooth GCC’s Path To Net Zero
Latest Reports
- Cape Verde Portable Hand-Thrown Extinguisher Market (2026-2032)
- Canada Portable Hand-Thrown Extinguisher Market (2026-2032)
- Cameroon Portable Hand-Thrown Extinguisher Market (2026-2032)
- Burundi Portable Hand-Thrown Extinguisher Market (2026-2032)
- Burkina Faso Portable Hand-Thrown Extinguisher Market (2026-2032)
- Bulgaria Portable Hand-Thrown Extinguisher Market (2026-2032)
- Brunei Portable Hand-Thrown Extinguisher Market (2026-2032)
- Botswana Portable Hand-Thrown Extinguisher Market (2026-2032)
- Bosnia and Herzegovina Portable Hand-Thrown Extinguisher Market (2026-2032)
- Bolivia Portable Hand-Thrown Extinguisher Market (2026-2032)
Industry Events and Analyst Meet

HIMTEX 2026

India Refining Summit 2026

India EV Show 2026

EV tech India Expo 2026

Auto Tech Asia 2026
Whitepaper
- Middle East & Africa Commercial Security Market Click here to view more.
- Middle East & Africa Fire Safety Systems & Equipment Market Click here to view more.
- GCC Drone Market Click here to view more.
- Middle East Lighting Fixture Market Click here to view more.
- GCC Physical & Perimeter Security Market Click here to view more.