Denmark Pipeline Construction Market (2025-2031) | Companies, Share, Analysis, Value, Outlook, Industry, Growth, Trends, Forecast, Segmentation, Competitive Landscape, Size & Revenue
Market Forecast By Pipe Type (Metallic, Non-Metallic), By Application (Liquid Pipeline, Gas Pipeline), By End User (Oil and Gas, Chemical, Water and Wastewater, Energy, Others) And Competitive Landscape
| Product Code: ETC6967024 | Publication Date: Sep 2024 | Updated Date: Apr 2026 | Product Type: Market Research Report | |
| Publisher: 6Wresearch | Author: Dhaval Chaurasia | No. of Pages: 75 | No. of Figures: 35 | No. of Tables: 20 |
Denmark Pipeline Construction Market Size (2020-2030)
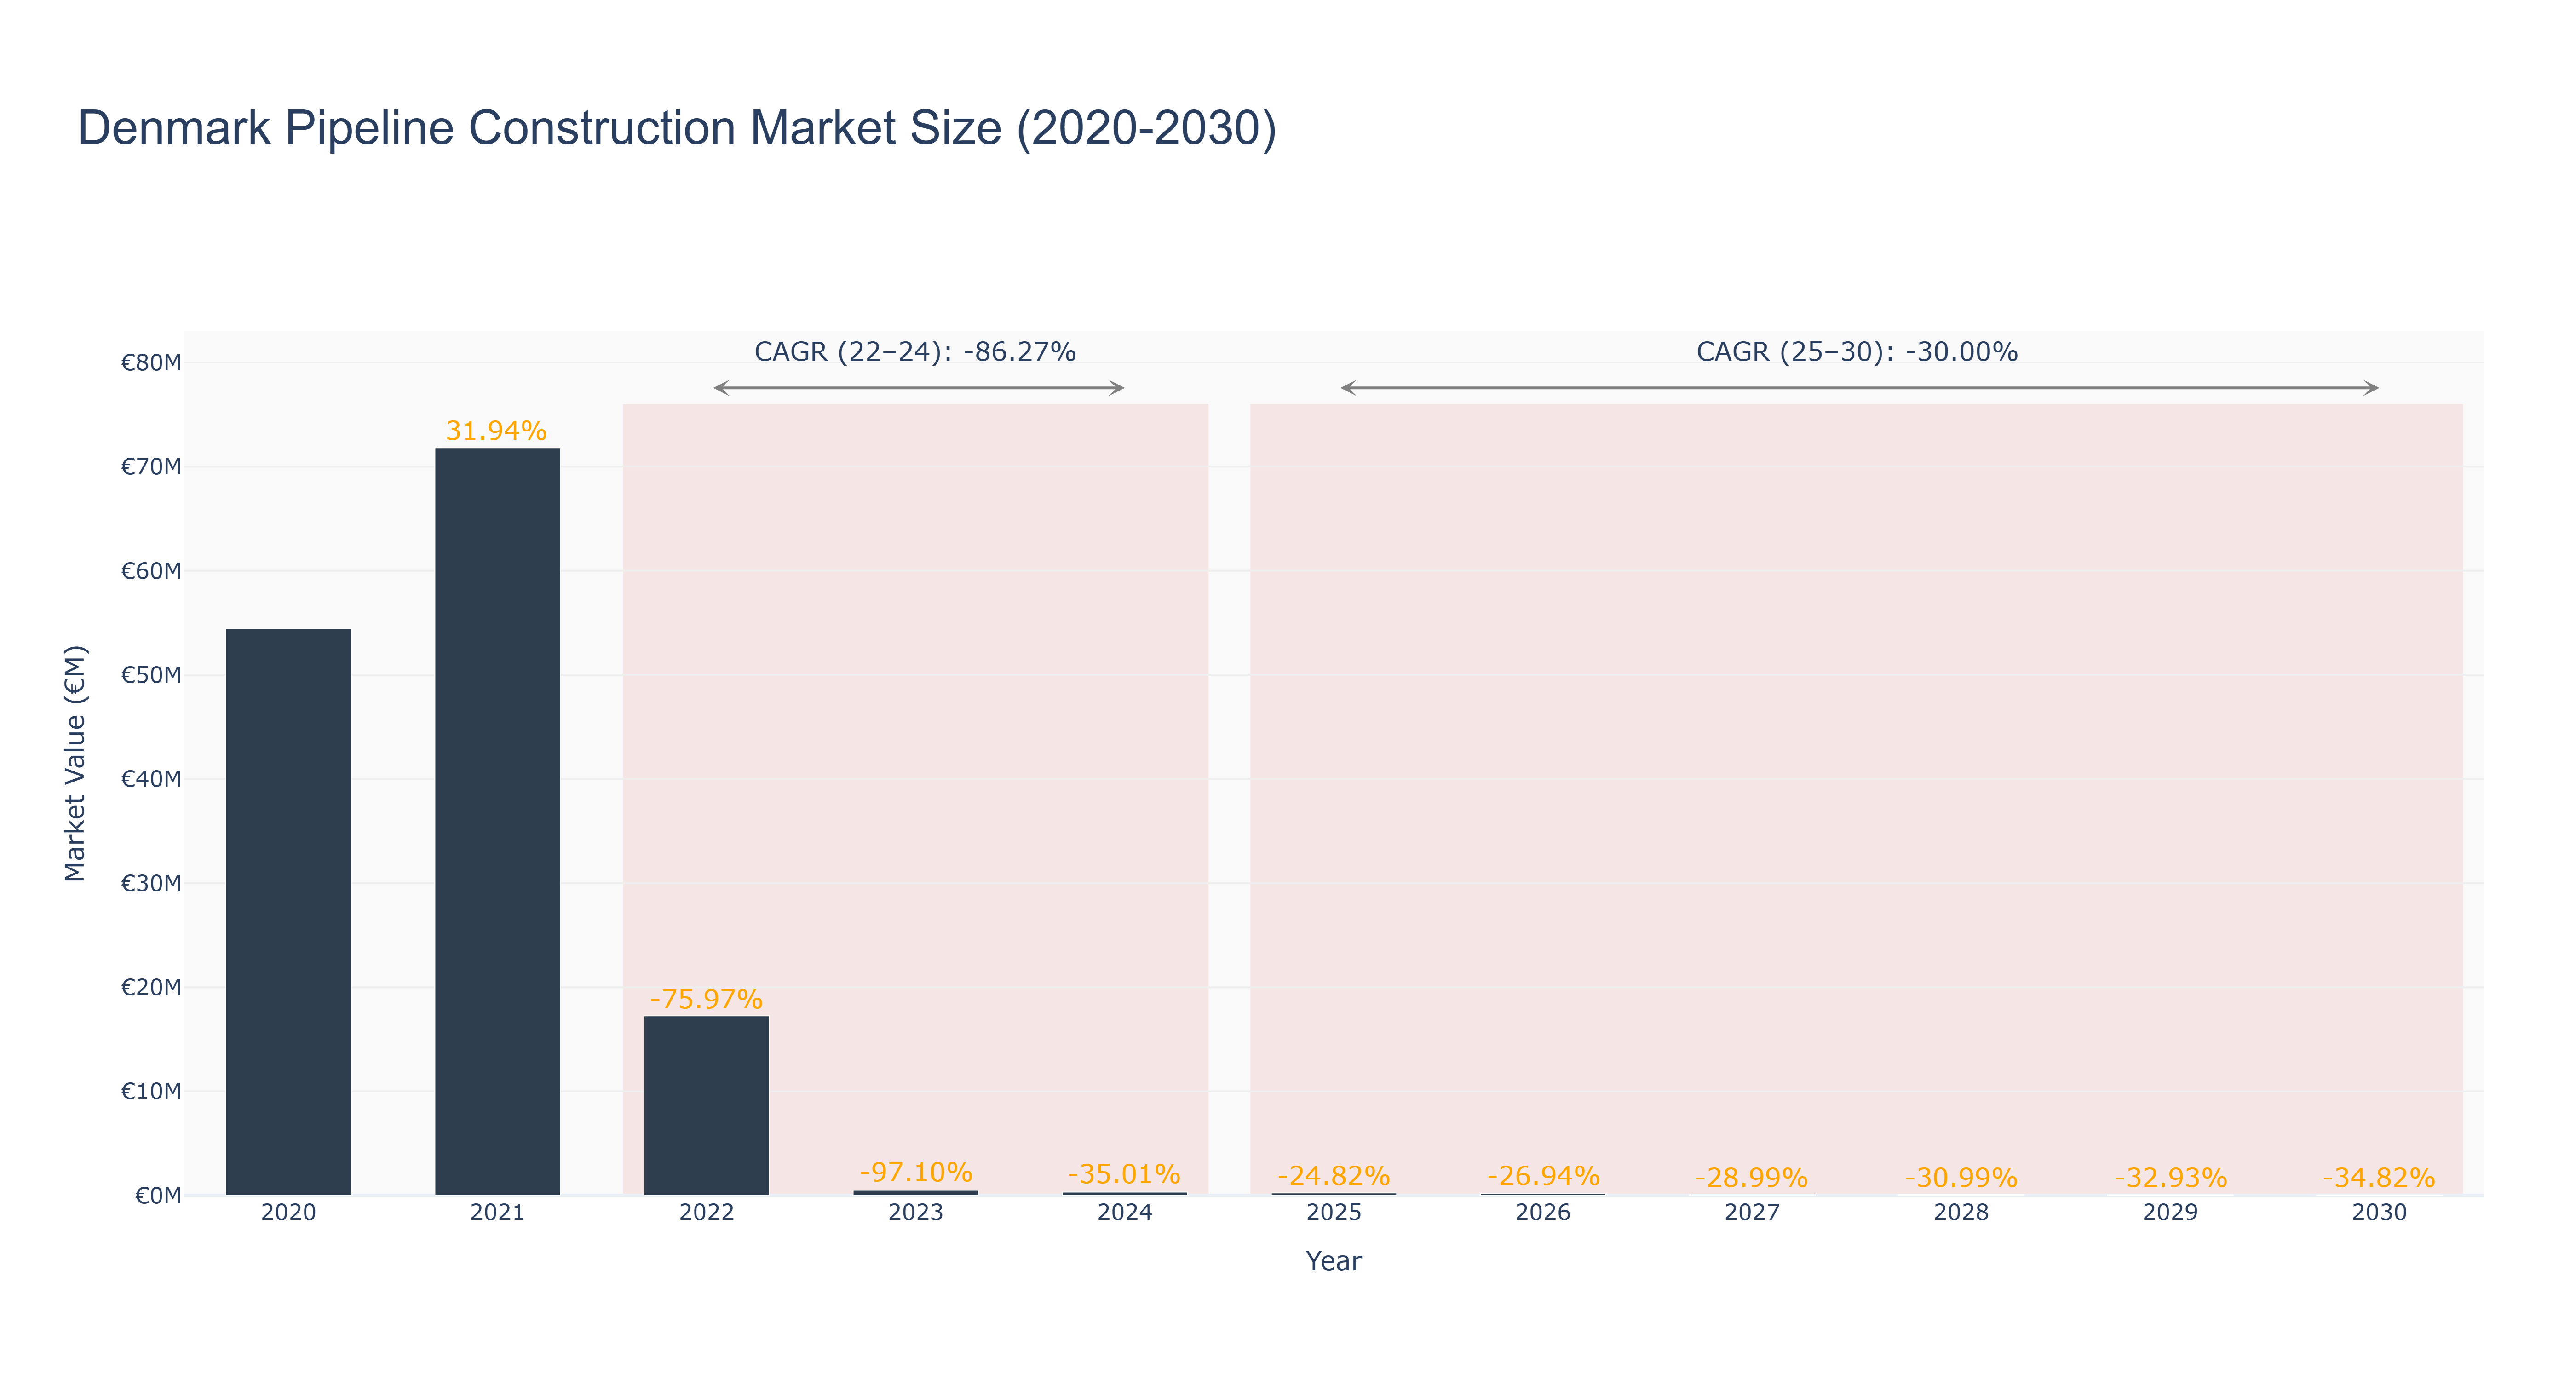
The Denmark Pipeline Construction Market experienced a peak market size of €71.81 million in 2021. However, a significant decline followed with the market size plummeting to €0.04 million in 2030. The CAGR from 2022 to 2024 was -86.27%, reflecting a sharp downturn, while the CAGR from 2025 to 2030 is projected at -30.0%. This downward trend can be attributed to economic slowdowns, reduced infrastructure investments, and shifts in energy policies towards more sustainable alternatives. Looking ahead, Denmark is gearing towards implementing advanced pipeline technologies to enhance efficiency and sustainability in its construction projects. Future developments in the market may focus on digitalization, automation, and eco-friendly practices to meet evolving industry demands and regulatory standards.
Denmark Pipeline Construction Market: Production & Trade Performance (2019-2025)
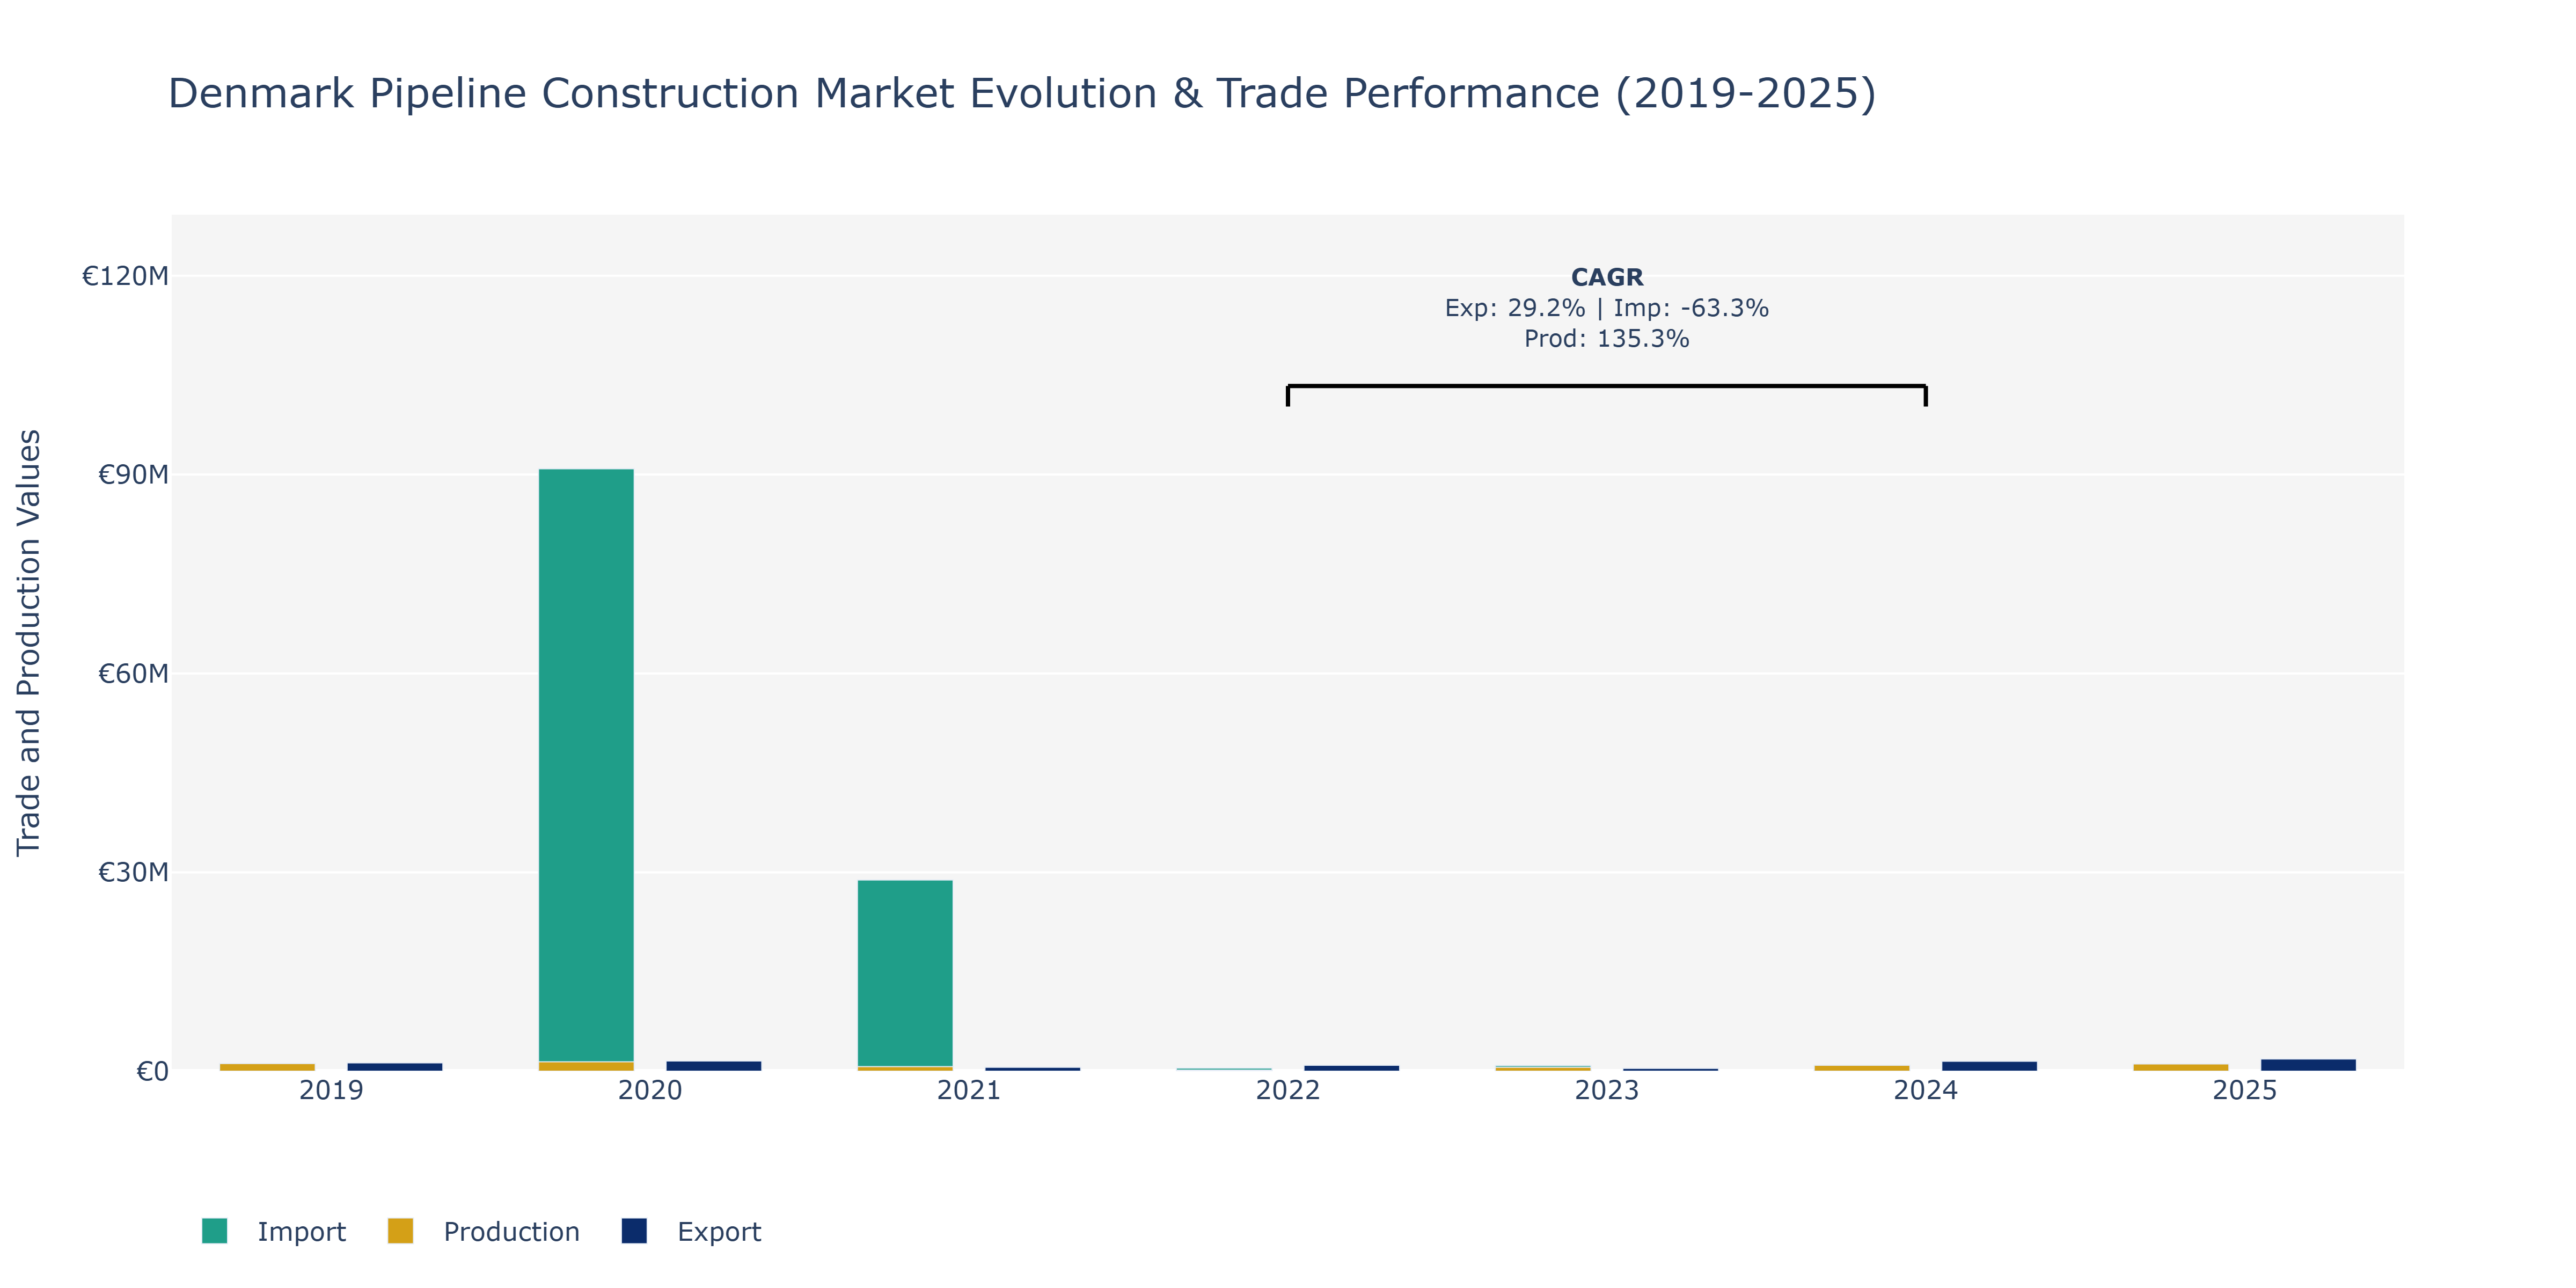
In the Denmark Pipeline Construction Market, from 2019 to 2025, Exports demonstrated a steady growth trajectory, with a notable peak in 2020 at €1.54 million. This increase could be attributed to expanding global demand for Danish pipeline infrastructure expertise and products. Imports, on the other hand, fluctuated significantly, experiencing a sharp decline in 2020 to €90.88 million before gradually stabilizing. Such volatility might have been influenced by shifts in global supply chains, trade regulations, or local demand patterns. Production levels followed a robust upward trend, reaching €1.08 billion in 2025. This surge, especially evident from 2022 to 2024 with a remarkable CAGR of 135.33%, suggests substantial investments in domestic manufacturing capabilities, likely driven by government initiatives to boost infrastructure development. The market's overall performance reflects Denmark's strategic positioning in the pipeline construction sector, emphasizing both export competitiveness and domestic production capacity.
Key Highlights of the Report:
- Denmark Pipeline Construction Market Outlook
- Market Size of Denmark Pipeline Construction Market, 2024
- Forecast of Denmark Pipeline Construction Market, 2031
- Historical Data and Forecast of Denmark Pipeline Construction Revenues & Volume for the Period 2021- 2031
- Denmark Pipeline Construction Market Trend Evolution
- Denmark Pipeline Construction Market Drivers and Challenges
- Denmark Pipeline Construction Price Trends
- Denmark Pipeline Construction Porter's Five Forces
- Denmark Pipeline Construction Industry Life Cycle
- Historical Data and Forecast of Denmark Pipeline Construction Market Revenues & Volume By Pipe Type for the Period 2021- 2031
- Historical Data and Forecast of Denmark Pipeline Construction Market Revenues & Volume By Metallic for the Period 2021- 2031
- Historical Data and Forecast of Denmark Pipeline Construction Market Revenues & Volume By Non-Metallic for the Period 2021- 2031
- Historical Data and Forecast of Denmark Pipeline Construction Market Revenues & Volume By Application for the Period 2021- 2031
- Historical Data and Forecast of Denmark Pipeline Construction Market Revenues & Volume By Liquid Pipeline for the Period 2021- 2031
- Historical Data and Forecast of Denmark Pipeline Construction Market Revenues & Volume By Gas Pipeline for the Period 2021- 2031
- Historical Data and Forecast of Denmark Pipeline Construction Market Revenues & Volume By End User for the Period 2021- 2031
- Historical Data and Forecast of Denmark Pipeline Construction Market Revenues & Volume By Oil and Gas for the Period 2021- 2031
- Historical Data and Forecast of Denmark Pipeline Construction Market Revenues & Volume By Chemical for the Period 2021- 2031
- Historical Data and Forecast of Denmark Pipeline Construction Market Revenues & Volume By Water and Wastewater for the Period 2021- 2031
- Historical Data and Forecast of Denmark Pipeline Construction Market Revenues & Volume By Energy for the Period 2021- 2031
- Historical Data and Forecast of Denmark Pipeline Construction Market Revenues & Volume By Others for the Period 2021- 2031
- Denmark Pipeline Construction Import Export Trade Statistics
- Market Opportunity Assessment By Pipe Type
- Market Opportunity Assessment By Application
- Market Opportunity Assessment By End User
- Denmark Pipeline Construction Top Companies Market Share
- Denmark Pipeline Construction Competitive Benchmarking By Technical and Operational Parameters
- Denmark Pipeline Construction Company Profiles
- Denmark Pipeline Construction Key Strategic Recommendations
Frequently Asked Questions About the Market Study (FAQs):
6Wresearch actively monitors the Denmark Pipeline Construction Market and publishes its comprehensive annual report, highlighting emerging trends, growth drivers, revenue analysis, and forecast outlook. Our insights help businesses to make data-backed strategic decisions with ongoing market dynamics. Our analysts track relevent industries related to the Denmark Pipeline Construction Market, allowing our clients with actionable intelligence and reliable forecasts tailored to emerging regional needs.
Yes, we provide customisation as per your requirements. To learn more, feel free to contact us on sales@6wresearch.com
1 Executive Summary |
2 Introduction |
2.1 Key Highlights of the Report |
2.2 Report Description |
2.3 Market Scope & Segmentation |
2.4 Research Methodology |
2.5 Assumptions |
3 Denmark Pipeline Construction Market Overview |
3.1 Denmark Country Macro Economic Indicators |
3.2 Denmark Pipeline Construction Market Revenues & Volume, 2021 & 2031F |
3.3 Denmark Pipeline Construction Market - Industry Life Cycle |
3.4 Denmark Pipeline Construction Market - Porter's Five Forces |
3.5 Denmark Pipeline Construction Market Revenues & Volume Share, By Pipe Type, 2021 & 2031F |
3.6 Denmark Pipeline Construction Market Revenues & Volume Share, By Application, 2021 & 2031F |
3.7 Denmark Pipeline Construction Market Revenues & Volume Share, By End User, 2021 & 2031F |
4 Denmark Pipeline Construction Market Dynamics |
4.1 Impact Analysis |
4.2 Market Drivers |
4.2.1 Increasing demand for energy and infrastructure development in Denmark |
4.2.2 Government initiatives to promote sustainable and renewable energy sources |
4.2.3 Growth in industrial activities and urbanization leading to the need for pipeline infrastructure |
4.3 Market Restraints |
4.3.1 Stringent regulatory requirements and environmental concerns impacting project timelines and costs |
4.3.2 Fluctuating raw material prices affecting overall project economics |
4.3.3 Competition from alternative energy sources and transportation methods |
5 Denmark Pipeline Construction Market Trends |
6 Denmark Pipeline Construction Market, By Types |
6.1 Denmark Pipeline Construction Market, By Pipe Type |
6.1.1 Overview and Analysis |
6.1.2 Denmark Pipeline Construction Market Revenues & Volume, By Pipe Type, 2021- 2031F |
6.1.3 Denmark Pipeline Construction Market Revenues & Volume, By Metallic, 2021- 2031F |
6.1.4 Denmark Pipeline Construction Market Revenues & Volume, By Non-Metallic, 2021- 2031F |
6.2 Denmark Pipeline Construction Market, By Application |
6.2.1 Overview and Analysis |
6.2.2 Denmark Pipeline Construction Market Revenues & Volume, By Liquid Pipeline, 2021- 2031F |
6.2.3 Denmark Pipeline Construction Market Revenues & Volume, By Gas Pipeline, 2021- 2031F |
6.3 Denmark Pipeline Construction Market, By End User |
6.3.1 Overview and Analysis |
6.3.2 Denmark Pipeline Construction Market Revenues & Volume, By Oil and Gas, 2021- 2031F |
6.3.3 Denmark Pipeline Construction Market Revenues & Volume, By Chemical, 2021- 2031F |
6.3.4 Denmark Pipeline Construction Market Revenues & Volume, By Water and Wastewater, 2021- 2031F |
6.3.5 Denmark Pipeline Construction Market Revenues & Volume, By Energy, 2021- 2031F |
6.3.6 Denmark Pipeline Construction Market Revenues & Volume, By Others, 2021- 2031F |
7 Denmark Pipeline Construction Market Import-Export Trade Statistics |
7.1 Denmark Pipeline Construction Market Export to Major Countries |
7.2 Denmark Pipeline Construction Market Imports from Major Countries |
8 Denmark Pipeline Construction Market Key Performance Indicators |
8.1 Percentage of renewable energy sources in Denmark's energy mix |
8.2 Number of infrastructure projects initiated by the government |
8.3 Growth in industrial output and urban population density |
9 Denmark Pipeline Construction Market - Opportunity Assessment |
9.1 Denmark Pipeline Construction Market Opportunity Assessment, By Pipe Type, 2021 & 2031F |
9.2 Denmark Pipeline Construction Market Opportunity Assessment, By Application, 2021 & 2031F |
9.3 Denmark Pipeline Construction Market Opportunity Assessment, By End User, 2021 & 2031F |
10 Denmark Pipeline Construction Market - Competitive Landscape |
10.1 Denmark Pipeline Construction Market Revenue Share, By Companies, 2024 |
10.2 Denmark Pipeline Construction Market Competitive Benchmarking, By Operating and Technical Parameters |
11 Company Profiles |
12 Recommendations |
13 Disclaimer |
Global Go To Market Strategy - 2030
Export potential enables firms to identify high-growth global markets with greater confidence by combining advanced trade intelligence with a structured quantitative methodology. The framework analyzes emerging demand trends and country-level import patterns while integrating macroeconomic and trade datasets such as GDP and population forecasts, bilateral import–export flows, tariff structures, elasticity differentials between developed and developing economies, geographic distance, and import demand projections. Using weighted trade values from 2020–2024 as the base period to project country-to-country export potential for 2030, these inputs are operationalized through calculated drivers such as gravity model parameters, tariff impact factors, and projected GDP per-capita growth. Through an analysis of hidden potentials, demand hotspots, and market conditions that are most favorable to success, this method enables firms to focus on target countries, maximize returns, and global expansion with data, backed by accuracy.
By factoring in the projected importer demand gap that is currently unmet and could be potential opportunity, it identifies the potential for the Exporter (Country) among 190 countries, against the general trade analysis, which identifies the biggest importer or exporter.
To discover high-growth global markets and optimize your business strategy:
Click Here
Pricing
- Single User License$ 1,995
- Department License$ 2,400
- Site License$ 3,120
- Global License$ 3,795

Leadership Perspectives from Industry Events
Search
Thought Leadership and Analyst Meet


Our Clients
6WResearch In News
- India Export Attractiveness Tracker 2026
- India Air Conditioner Market Set for Strong Rebound in 2026 After Weather-Led Correction and GST-Driven Recovery: 6Wresearch
- ADAS in India: How Automatic Emergency Braking, Blind Spot Detection & Driver Monitoring are Transforming Road Safety
- Doha a strategic location for EV manufacturing hub: IPA Qatar
- Demand for luxury TVs surging in the GCC, says Samsung
- Empowering Growth: The Thriving Journey of Bangladesh’s Cable Industry
Latest Reports
- Qatar Access and Home Network Market (2026-2032)
- Nicaragua RPG Gaming Market (2026-2032)
- New Zealand RPG Gaming Market (2026-2032)
- Netherlands RPG Gaming Market (2026-2032)
- Nauru RPG Gaming Market (2026-2032)
- Namibia RPG Gaming Market (2026-2032)
- Mozambique RPG Gaming Market (2026-2032)
- Montenegro RPG Gaming Market (2026-2032)
- Mongolia RPG Gaming Market (2026-2032)
- Monaco RPG Gaming Market (2026-2032)
Industry Events and Analyst Meet

EV India Expo 2026

HIMTEX 2026

India Refining Summit 2026

India EV Show 2026

EV tech India Expo 2026
Whitepaper
- Middle East & Africa Commercial Security Market Click here to view more.
- Middle East & Africa Fire Safety Systems & Equipment Market Click here to view more.
- GCC Drone Market Click here to view more.
- Middle East Lighting Fixture Market Click here to view more.
- GCC Physical & Perimeter Security Market Click here to view more.