Denmark Raman Spectroscopy Market (2025-2031) | Trends, Analysis, Outlook, Size, Share, Revenue, Industry, Growth, Segmentation, Value, Companies & Forecast
Market Forecast By Instrument (Microscopy Raman, FT Raman, Handheld & Portable Raman, Others), By Sampling Technique (Surface Enhanced Raman Scattering (SERS), Tip Enhanced Raman Scattering (TERS), Others), By Application (Pharmaceutical, Life Science, Materials Science, Carbon Material, Semiconductor, Others) And Competitive Landscape
| Product Code: ETC5562997 | Publication Date: Nov 2023 | Updated Date: Dec 2025 | Product Type: Market Research Report | |
| Publisher: 6Wresearch | Author: Vasudha | No. of Pages: 60 | No. of Figures: 30 | No. of Tables: 5 |
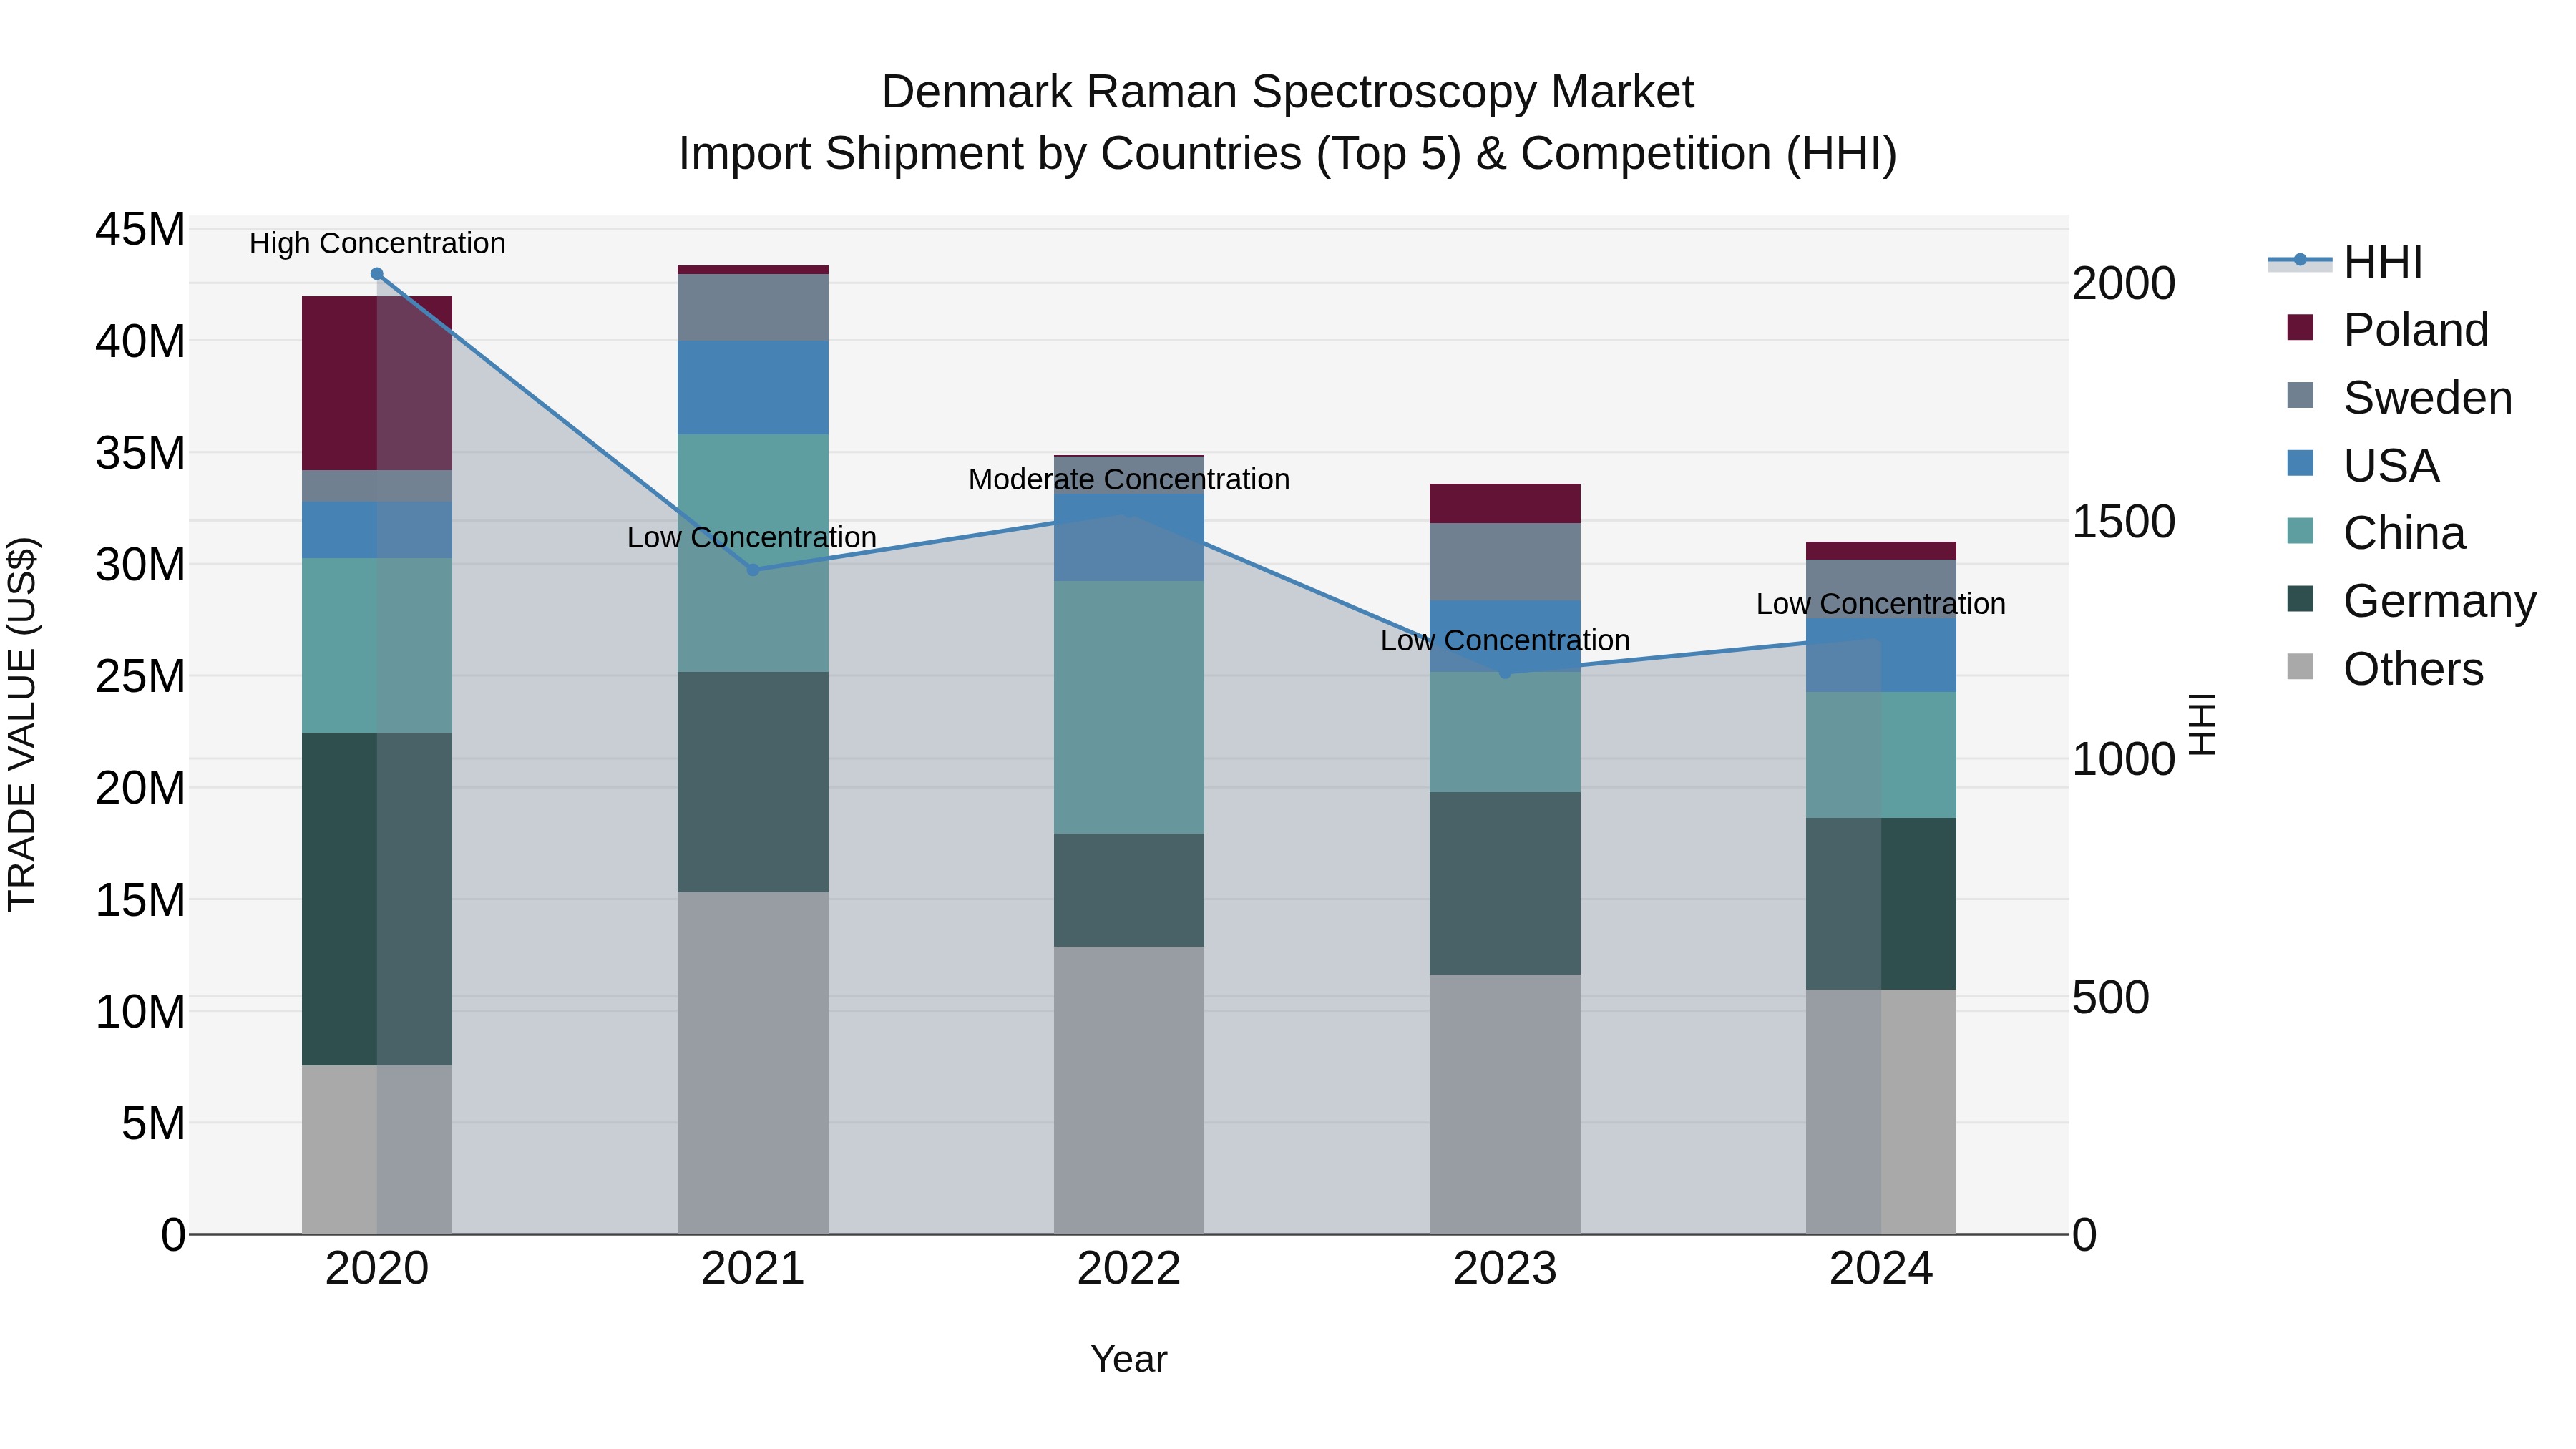
Denmark Raman Spectroscopy Market Top 5 Importing Countries and Market Competition (HHI) Analysis
In 2024, Denmark import shipments of Raman spectroscopy equipment were primarily sourced from Germany, China, USA, Sweden, and Canada. The market displayed low concentration with a Herfindahl-Hirschman Index (HHI) indicating competitive dynamics. However, the industry experienced a negative compound annual growth rate (CAGR) of -7.31% from 2020 to 2024, with a further decline in growth rate of -7.74% from 2023 to 2024. This trend suggests a challenging market environment for Raman spectroscopy imports in Denmark, potentially influenced by various factors impacting demand and supply chains.
Denmark Raman Spectroscopy Market Overview
The Raman Spectroscopy market in Denmark is growing, driven by advancements in analytical techniques used across various industries, including pharmaceuticals, environmental monitoring, and materials science. Raman spectroscopy offers non-destructive analysis and is increasingly favored for its ability to provide detailed molecular information. The Danish government`s support for research and development in scientific instrumentation and analytical chemistry fosters innovation in this market. As industries continue to seek efficient and accurate analytical methods, the demand for Raman spectroscopy equipment and applications is expected to rise, reflecting a broader trend towards precision and efficiency in scientific research.
Drivers of the market
The Denmark Raman spectroscopy market is driven by its increasing use in pharmaceutical, chemical, and environmental monitoring applications. The technology`s ability to provide non-destructive analysis of molecular composition makes it valuable in quality control and research. Furthermore, growing advancements in Raman spectroscopy technology, such as portable and handheld devices, are expanding its adoption in academic and industrial sectors in Denmark. The rise in life sciences and material science research is also a key factor contributing to market growth.
Challenges of the market
The Denmark Raman Spectroscopy market faces challenges related to technological advancements, cost factors, and market acceptance. Although Raman spectroscopy offers significant advantages in chemical analysis and materials characterization, the high cost of advanced spectroscopic equipment can deter small and medium-sized enterprises from adoption. Furthermore, the complexity of interpreting Raman spectra requires specialized knowledge, which can limit the user base. The competition from alternative analytical techniques, such as mass spectrometry and infrared spectroscopy, adds pressure on Raman spectroscopy providers to demonstrate unique advantages and improve performance. Additionally, ensuring the reliability and reproducibility of results across different applications remains a critical challenge. As industries increasingly demand real-time and on-site analysis, Raman spectroscopy systems must evolve to meet these expectations while maintaining accuracy and reliability.
Government Policy of the market
Denmark has actively promoted scientific research and technological innovation, and this extends to the Raman spectroscopy market. Government research grants and funding initiatives aimed at enhancing Denmarks capabilities in scientific instrumentation have bolstered the adoption of advanced spectroscopic technologies. Additionally, regulatory bodies ensure compliance with EU safety standards for scientific equipment, which influences the production and use of Raman spectroscopy in industries like pharmaceuticals, materials science, and environmental monitoring.
Key Highlights of the Report:
- Denmark Raman Spectroscopy Market Outlook
- Market Size of Denmark Raman Spectroscopy Market, 2024
- Forecast of Denmark Raman Spectroscopy Market, 2031
- Historical Data and Forecast of Denmark Raman Spectroscopy Revenues & Volume for the Period 2021-2031
- Denmark Raman Spectroscopy Market Trend Evolution
- Denmark Raman Spectroscopy Market Drivers and Challenges
- Denmark Raman Spectroscopy Price Trends
- Denmark Raman Spectroscopy Porter`s Five Forces
- Denmark Raman Spectroscopy Industry Life Cycle
- Historical Data and Forecast of Denmark Raman Spectroscopy Market Revenues & Volume By Instrument for the Period 2021-2031
- Historical Data and Forecast of Denmark Raman Spectroscopy Market Revenues & Volume By Microscopy Raman for the Period 2021-2031
- Historical Data and Forecast of Denmark Raman Spectroscopy Market Revenues & Volume By FT Raman for the Period 2021-2031
- Historical Data and Forecast of Denmark Raman Spectroscopy Market Revenues & Volume By Handheld & Portable Raman for the Period 2021-2031
- Historical Data and Forecast of Denmark Raman Spectroscopy Market Revenues & Volume By Others for the Period 2021-2031
- Historical Data and Forecast of Denmark Raman Spectroscopy Market Revenues & Volume By Sampling Technique for the Period 2021-2031
- Historical Data and Forecast of Denmark Raman Spectroscopy Market Revenues & Volume By Surface Enhanced Raman Scattering (SERS) for the Period 2021-2031
- Historical Data and Forecast of Denmark Raman Spectroscopy Market Revenues & Volume By Tip Enhanced Raman Scattering (TERS) for the Period 2021-2031
- Historical Data and Forecast of Denmark Raman Spectroscopy Market Revenues & Volume By Others for the Period 2021-2031
- Historical Data and Forecast of Denmark Raman Spectroscopy Market Revenues & Volume By Application for the Period 2021-2031
- Historical Data and Forecast of Denmark Raman Spectroscopy Market Revenues & Volume By Pharmaceutical for the Period 2021-2031
- Historical Data and Forecast of Denmark Raman Spectroscopy Market Revenues & Volume By Life Science for the Period 2021-2031
- Historical Data and Forecast of Denmark Raman Spectroscopy Market Revenues & Volume By Materials Science for the Period 2021-2031
- Historical Data and Forecast of Denmark Raman Spectroscopy Market Revenues & Volume By Carbon Material for the Period 2021-2031
- Historical Data and Forecast of Denmark Raman Spectroscopy Market Revenues & Volume By Semiconductor for the Period 2021-2031
- Historical Data and Forecast of Denmark Raman Spectroscopy Market Revenues & Volume By Others for the Period 2021-2031
- Denmark Raman Spectroscopy Import Export Trade Statistics
- Market Opportunity Assessment By Instrument
- Market Opportunity Assessment By Sampling Technique
- Market Opportunity Assessment By Application
- Denmark Raman Spectroscopy Top Companies Market Share
- Denmark Raman Spectroscopy Competitive Benchmarking By Technical and Operational Parameters
- Denmark Raman Spectroscopy Company Profiles
- Denmark Raman Spectroscopy Key Strategic Recommendations
Frequently Asked Questions About the Market Study (FAQs):
6Wresearch actively monitors the Denmark Raman Spectroscopy Market and publishes its comprehensive annual report, highlighting emerging trends, growth drivers, revenue analysis, and forecast outlook. Our insights help businesses to make data-backed strategic decisions with ongoing market dynamics. Our analysts track relevent industries related to the Denmark Raman Spectroscopy Market, allowing our clients with actionable intelligence and reliable forecasts tailored to emerging regional needs.
Yes, we provide customisation as per your requirements. To learn more, feel free to contact us on sales@6wresearch.com
1 Executive Summary |
2 Introduction |
2.1 Key Highlights of the Report |
2.2 Report Description |
2.3 Market Scope & Segmentation |
2.4 Research Methodology |
2.5 Assumptions |
3 Denmark Raman Spectroscopy Market Overview |
3.1 Denmark Country Macro Economic Indicators |
3.2 Denmark Raman Spectroscopy Market Revenues & Volume, 2021 & 2031F |
3.3 Denmark Raman Spectroscopy Market - Industry Life Cycle |
3.4 Denmark Raman Spectroscopy Market - Porter's Five Forces |
3.5 Denmark Raman Spectroscopy Market Revenues & Volume Share, By Instrument , 2021 & 2031F |
3.6 Denmark Raman Spectroscopy Market Revenues & Volume Share, By Sampling Technique , 2021 & 2031F |
3.7 Denmark Raman Spectroscopy Market Revenues & Volume Share, By Application , 2021 & 2031F |
4 Denmark Raman Spectroscopy Market Dynamics |
4.1 Impact Analysis |
4.2 Market Drivers |
4.2.1 Increasing demand for pharmaceutical and biotechnology applications of Raman spectroscopy in Denmark |
4.2.2 Growing adoption of Raman spectroscopy in material science research and quality control processes |
4.2.3 Government initiatives promoting the use of Raman spectroscopy in environmental monitoring and food safety applications |
4.3 Market Restraints |
4.3.1 High initial investment and maintenance costs associated with Raman spectroscopy equipment |
4.3.2 Lack of skilled professionals proficient in Raman spectroscopy techniques in Denmark |
4.3.3 Presence of alternative technologies offering similar analytical capabilities at a lower cost |
5 Denmark Raman Spectroscopy Market Trends |
6 Denmark Raman Spectroscopy Market Segmentations |
6.1 Denmark Raman Spectroscopy Market, By Instrument |
6.1.1 Overview and Analysis |
6.1.2 Denmark Raman Spectroscopy Market Revenues & Volume, By Microscopy Raman, 2021-2031F |
6.1.3 Denmark Raman Spectroscopy Market Revenues & Volume, By FT Raman, 2021-2031F | 6.1.5 Denmark Raman Spectroscopy Market Revenues & Volume, By Handheld & Portable Raman, 2021-2031F |
6.1.5 Denmark Raman Spectroscopy Market Revenues & Volume, By Others, 2021-2031F |
6.2 Denmark Raman Spectroscopy Market, By Sampling Technique |
6.2.1 Overview and Analysis |
6.2.2 Denmark Raman Spectroscopy Market Revenues & Volume, By Surface Enhanced Raman Scattering (SERS), 2021-2031F |
6.2.3 Denmark Raman Spectroscopy Market Revenues & Volume, By Tip Enhanced Raman Scattering (TERS), 2021-2031F |
6.2.4 Denmark Raman Spectroscopy Market Revenues & Volume, By Others, 2021-2031F |
6.3 Denmark Raman Spectroscopy Market, By Application |
6.3.1 Overview and Analysis |
6.3.2 Denmark Raman Spectroscopy Market Revenues & Volume, By Pharmaceutical, 2021-2031F |
6.3.3 Denmark Raman Spectroscopy Market Revenues & Volume, By Life Science, 2021-2031F |
6.3.4 Denmark Raman Spectroscopy Market Revenues & Volume, By Materials Science, 2021-2031F |
6.3.5 Denmark Raman Spectroscopy Market Revenues & Volume, By Carbon Material, 2021-2031F |
6.3.6 Denmark Raman Spectroscopy Market Revenues & Volume, By Semiconductor, 2021-2031F |
6.3.7 Denmark Raman Spectroscopy Market Revenues & Volume, By Others, 2021-2031F |
7 Denmark Raman Spectroscopy Market Import-Export Trade Statistics |
7.1 Denmark Raman Spectroscopy Market Export to Major Countries |
7.2 Denmark Raman Spectroscopy Market Imports from Major Countries |
8 Denmark Raman Spectroscopy Market Key Performance Indicators |
8.1 Number of research grants or funding allocated for projects involving Raman spectroscopy applications |
8.2 Percentage increase in the number of Raman spectroscopy publications from Danish research institutions |
8.3 Adoption rate of Raman spectroscopy in key industries such as pharmaceuticals, biotechnology, and materials science in Denmark |
9 Denmark Raman Spectroscopy Market - Opportunity Assessment |
9.1 Denmark Raman Spectroscopy Market Opportunity Assessment, By Instrument , 2021 & 2031F |
9.2 Denmark Raman Spectroscopy Market Opportunity Assessment, By Sampling Technique , 2021 & 2031F |
9.3 Denmark Raman Spectroscopy Market Opportunity Assessment, By Application , 2021 & 2031F |
10 Denmark Raman Spectroscopy Market - Competitive Landscape |
10.1 Denmark Raman Spectroscopy Market Revenue Share, By Companies, 2024 |
10.2 Denmark Raman Spectroscopy Market Competitive Benchmarking, By Operating and Technical Parameters |
11 Company Profiles |
12 Recommendations | 13 Disclaimer |
Global Go To Market Strategy - 2030
Export potential enables firms to identify high-growth global markets with greater confidence by combining advanced trade intelligence with a structured quantitative methodology. The framework analyzes emerging demand trends and country-level import patterns while integrating macroeconomic and trade datasets such as GDP and population forecasts, bilateral import–export flows, tariff structures, elasticity differentials between developed and developing economies, geographic distance, and import demand projections. Using weighted trade values from 2020–2024 as the base period to project country-to-country export potential for 2030, these inputs are operationalized through calculated drivers such as gravity model parameters, tariff impact factors, and projected GDP per-capita growth. Through an analysis of hidden potentials, demand hotspots, and market conditions that are most favorable to success, this method enables firms to focus on target countries, maximize returns, and global expansion with data, backed by accuracy.
By factoring in the projected importer demand gap that is currently unmet and could be potential opportunity, it identifies the potential for the Exporter (Country) among 190 countries, against the general trade analysis, which identifies the biggest importer or exporter.
To discover high-growth global markets and optimize your business strategy:
Click Here
Pricing
- Single User License$ 1,995
- Department License$ 2,400
- Site License$ 3,120
- Global License$ 3,795

Leadership Perspectives from Industry Events
Search
Thought Leadership and Analyst Meet


Our Clients
6WResearch In News
- India Export Attractiveness Tracker 2026
- India Air Conditioner Market Set for Strong Rebound in 2026 After Weather-Led Correction and GST-Driven Recovery: 6Wresearch
- ADAS in India: How Automatic Emergency Braking, Blind Spot Detection & Driver Monitoring are Transforming Road Safety
- Doha a strategic location for EV manufacturing hub: IPA Qatar
- Demand for luxury TVs surging in the GCC, says Samsung
- Empowering Growth: The Thriving Journey of Bangladesh’s Cable Industry
Latest Reports
- Nicaragua RPG Gaming Market (2026-2032)
- New Zealand RPG Gaming Market (2026-2032)
- Netherlands RPG Gaming Market (2026-2032)
- Nauru RPG Gaming Market (2026-2032)
- Namibia RPG Gaming Market (2026-2032)
- Mozambique RPG Gaming Market (2026-2032)
- Montenegro RPG Gaming Market (2026-2032)
- Mongolia RPG Gaming Market (2026-2032)
- Monaco RPG Gaming Market (2026-2032)
- Micronesia RPG Gaming Market (2026-2032)
Industry Events and Analyst Meet

EV India Expo 2026

HIMTEX 2026

India Refining Summit 2026

India EV Show 2026

EV tech India Expo 2026
Whitepaper
- Middle East & Africa Commercial Security Market Click here to view more.
- Middle East & Africa Fire Safety Systems & Equipment Market Click here to view more.
- GCC Drone Market Click here to view more.
- Middle East Lighting Fixture Market Click here to view more.
- GCC Physical & Perimeter Security Market Click here to view more.