El Salvador Propionic acid Market (2025-2031) | Share, Industry, Forecast, Companies, Revenue, Growth, Size, Segmentation, Outlook, Value, Trends & Analysis
Market Forecast By Application (Herbicides, Rubber Products, Plasticizers, Food Preservatives, Others), By End use Industry (Pharmaceuticals, Personal Care, Food & Beverage, Agriculture, Others) And Competitive Landscape
| Product Code: ETC4746267 | Publication Date: Nov 2023 | Updated Date: Nov 2025 | Product Type: Market Research Report | |
| Publisher: 6Wresearch | Author: Sachin Kumar Rai | No. of Pages: 60 | No. of Figures: 30 | No. of Tables: 5 |
El Salvador Propionic Acid Market Year-wise Growth Rate (2021-2031F)
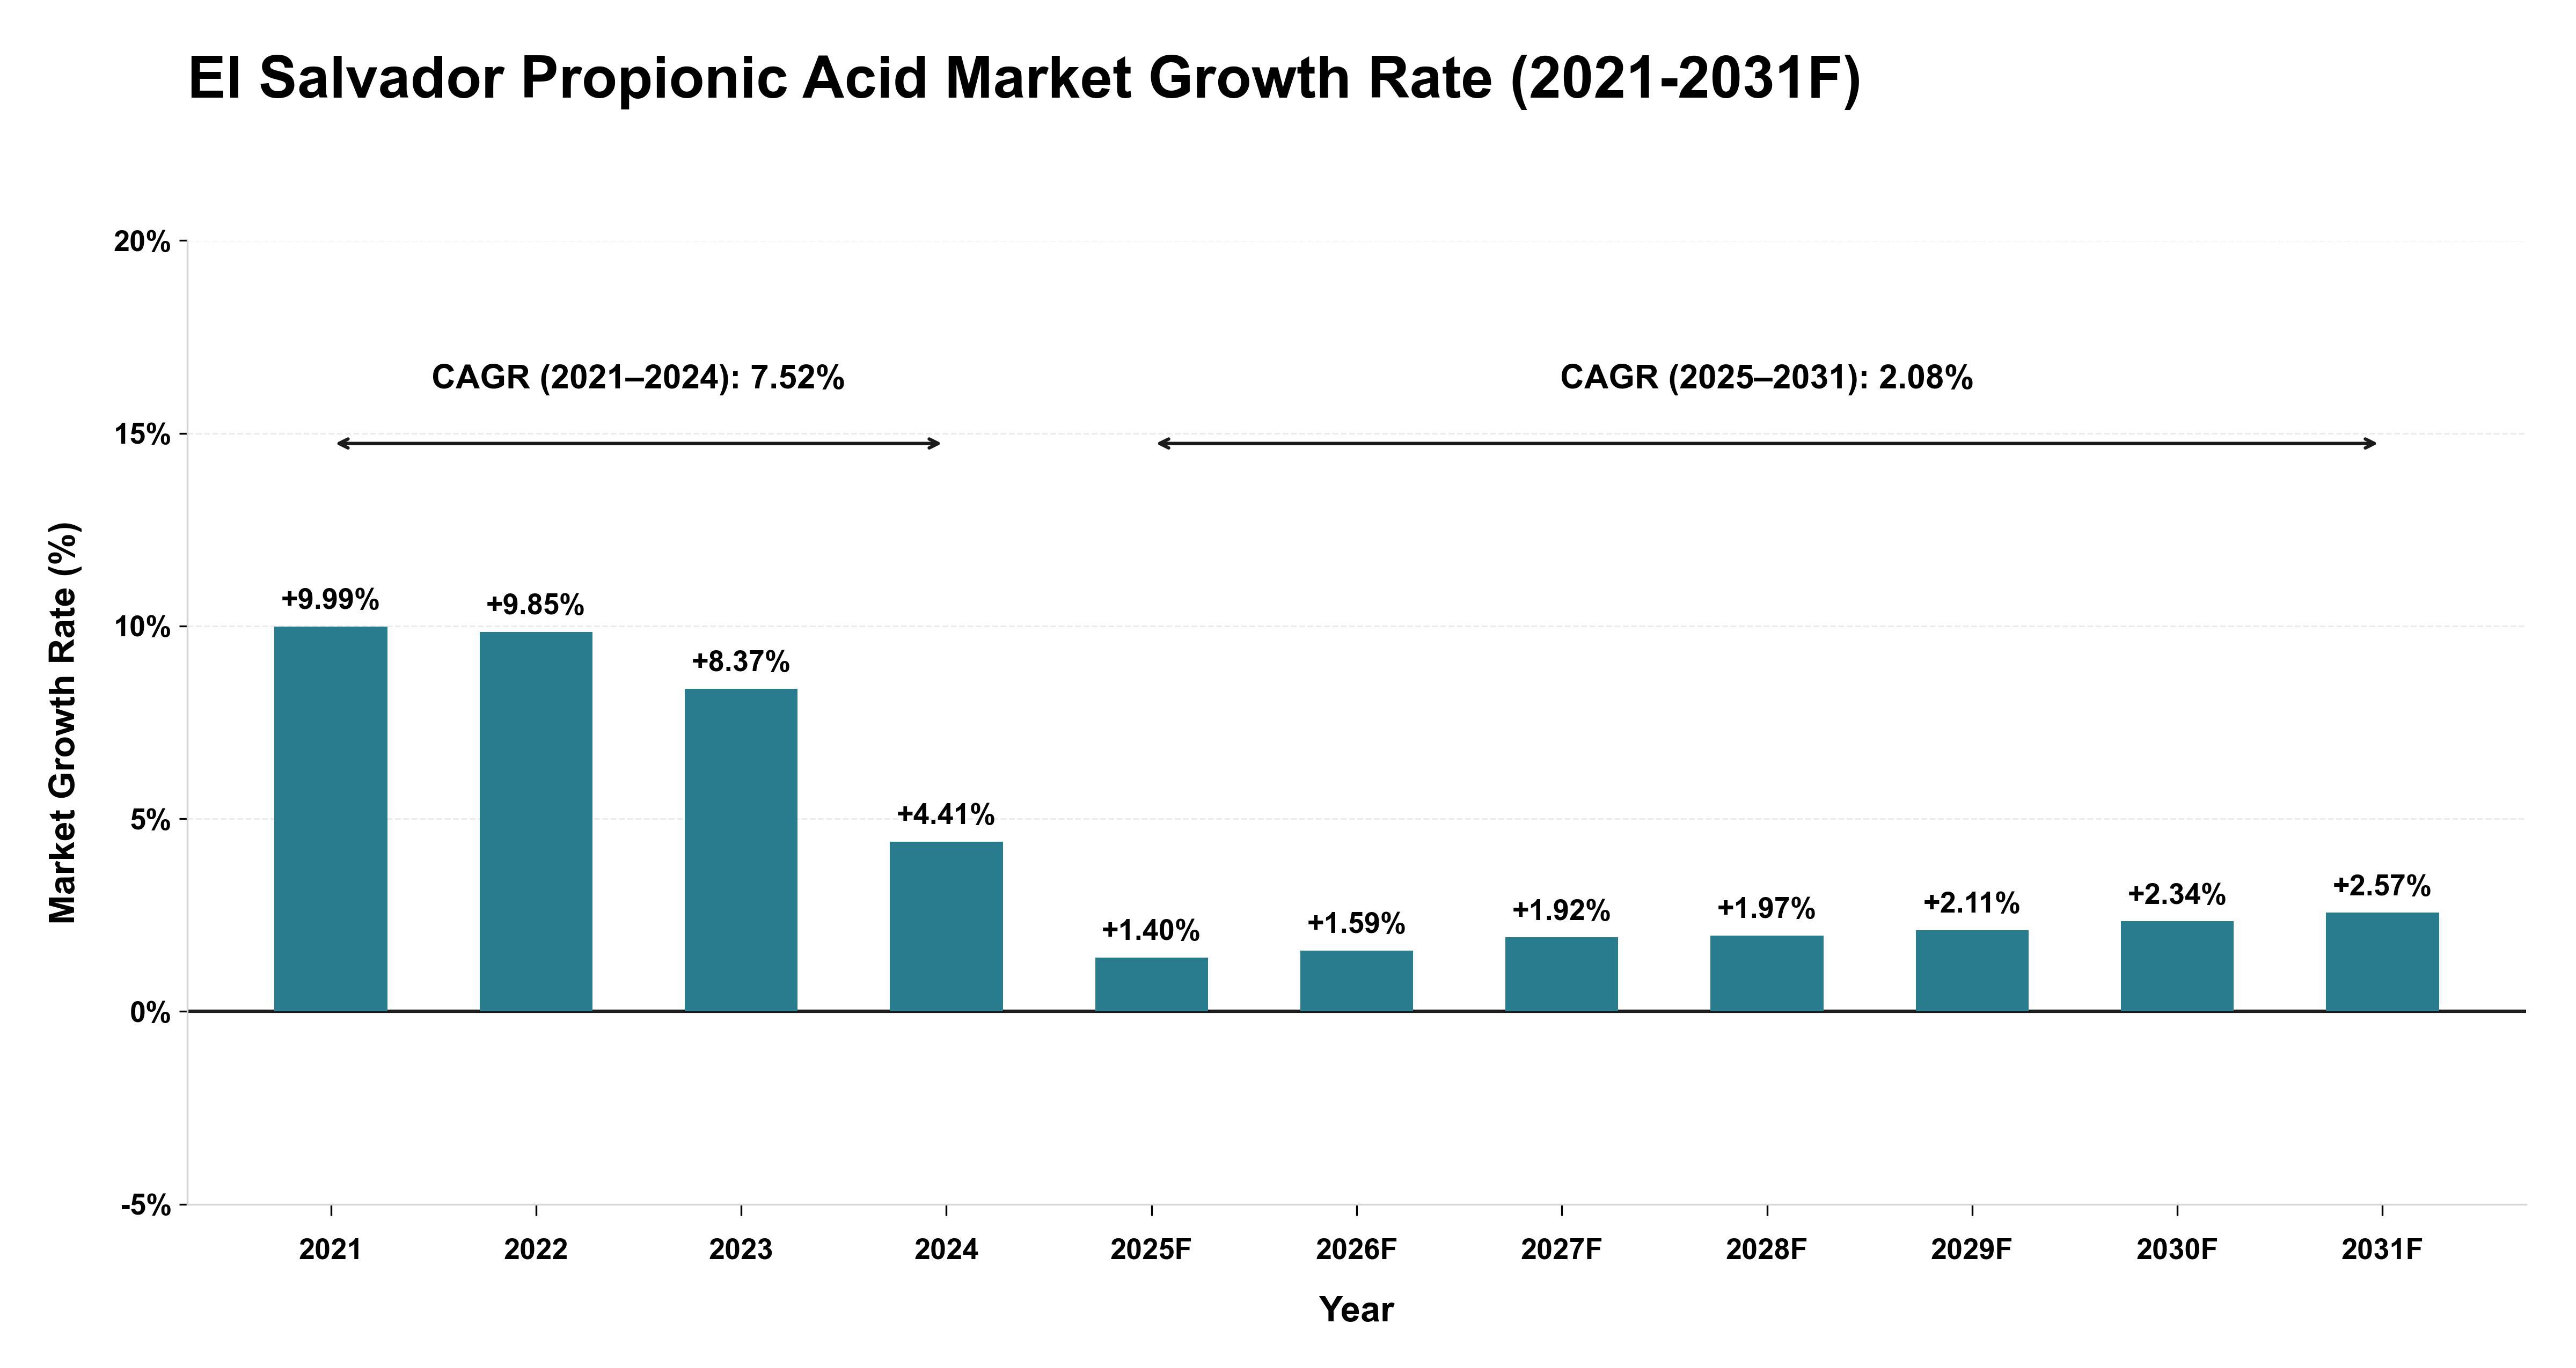
The El Salvador Propionic Acid Market experienced robust growth from 2021 to 2024, with a historical CAGR of 7.52%. This period saw significant demand from the agriculture and food preservation sectors, driven by increased awareness of food safety standards and the need for effective preservatives. However, in 2024, the growth rate decelerated to 4.41%, signaling a shift in market dynamics. Looking ahead to 2025-2031, the forecast CAGR of 2.08% suggests a more moderate but steady growth trajectory. This slowdown can be attributed to market saturation in key end-use industries, coupled with regulatory pressures on chemical usage. The market is expected to stabilize, with a focus on product innovation and sustainable practices to drive future growth amidst evolving consumer preferences and stringent regulations.
El Salvador Propionic acid Market Overview
The propionic acid market in El Salvador is expanding due to its use in food preservation, animal feed, and industrial applications. As consumer demand for safe and long-lasting food products increases, propionic acid is becoming an essential ingredient in the food processing industry. Additionally, its application in the production of herbicides and plastics is supporting market growth.
Drivers of the market
The propionic acid market in El Salvador is expanding due to its use as a preservative in the food and beverage industry, as well as in the production of various chemicals. The rise in demand for food preservation and the increasing use of propionic acid in animal feed are driving market growth. With growing industrial activity and rising consumer demand for processed foods, propionic acid is gaining traction in El Salvador`s manufacturing and food sectors.
Challenges of the market
The propionic acid market in El Salvador faces challenges such as limited local production capacity and a high dependency on imported products, which increases costs. The lack of awareness about the applications of propionic acid in industries such as food preservation and animal feed also limits market demand. Additionally, environmental regulations concerning chemical manufacturing and handling may create compliance challenges for local manufacturers. The market is also constrained by fluctuating raw material prices, as propionic acid is derived from petroleum-based sources, which exposes the market to supply chain disruptions.
Government Policy of the market
The propionic acid market in El Salvador is influenced by government policies aimed at fostering the growth of the chemical and agricultural industries. Propionic acid is used as a preservative in the food industry and as a fungicide in agriculture, making it an essential chemical for local markets. The government supports the agricultural sector through initiatives that promote sustainable farming practices, driving the demand for propionic acid-based products. Furthermore, policies that encourage the local production of chemicals and reduce dependence on imports help expand the propionic acid market in the country.
Key Highlights of the Report:
- El Salvador Propionic acid Market Outlook
- Market Size of El Salvador Propionic acid Market, 2024
- Forecast of El Salvador Propionic acid Market, 2031
- Historical Data and Forecast of El Salvador Propionic acid Revenues & Volume for the Period 2021-2031
- El Salvador Propionic acid Market Trend Evolution
- El Salvador Propionic acid Market Drivers and Challenges
- El Salvador Propionic acid Price Trends
- El Salvador Propionic acid Porter`s Five Forces
- El Salvador Propionic acid Industry Life Cycle
- Historical Data and Forecast of El Salvador Propionic acid Market Revenues & Volume By Application for the Period 2021-2031
- Historical Data and Forecast of El Salvador Propionic acid Market Revenues & Volume By Herbicides for the Period 2021-2031
- Historical Data and Forecast of El Salvador Propionic acid Market Revenues & Volume By Rubber Products for the Period 2021-2031
- Historical Data and Forecast of El Salvador Propionic acid Market Revenues & Volume By Plasticizers for the Period 2021-2031
- Historical Data and Forecast of El Salvador Propionic acid Market Revenues & Volume By Food Preservatives for the Period 2021-2031
- Historical Data and Forecast of El Salvador Propionic acid Market Revenues & Volume By Others for the Period 2021-2031
- Historical Data and Forecast of El Salvador Propionic acid Market Revenues & Volume By End use Industry for the Period 2021-2031
- Historical Data and Forecast of El Salvador Propionic acid Market Revenues & Volume By Pharmaceuticals for the Period 2021-2031
- Historical Data and Forecast of El Salvador Propionic acid Market Revenues & Volume By Personal Care for the Period 2021-2031
- Historical Data and Forecast of El Salvador Propionic acid Market Revenues & Volume By Food & Beverage for the Period 2021-2031
- Historical Data and Forecast of El Salvador Propionic acid Market Revenues & Volume By Agriculture for the Period 2021-2031
- Historical Data and Forecast of El Salvador Propionic acid Market Revenues & Volume By Others for the Period 2021-2031
- El Salvador Propionic acid Import Export Trade Statistics
- Market Opportunity Assessment By Application
- Market Opportunity Assessment By End use Industry
- El Salvador Propionic acid Top Companies Market Share
- El Salvador Propionic acid Competitive Benchmarking By Technical and Operational Parameters
- El Salvador Propionic acid Company Profiles
- El Salvador Propionic acid Key Strategic Recommendations
Frequently Asked Questions About the Market Study (FAQs):
6Wresearch actively monitors the El Salvador Propionic acid Market and publishes its comprehensive annual report, highlighting emerging trends, growth drivers, revenue analysis, and forecast outlook. Our insights help businesses to make data-backed strategic decisions with ongoing market dynamics. Our analysts track relevent industries related to the El Salvador Propionic acid Market, allowing our clients with actionable intelligence and reliable forecasts tailored to emerging regional needs.
Yes, we provide customisation as per your requirements. To learn more, feel free to contact us on sales@6wresearch.com
1 Executive Summary |
2 Introduction |
2.1 Key Highlights of the Report |
2.2 Report Description |
2.3 Market Scope & Segmentation |
2.4 Research Methodology |
2.5 Assumptions |
3 El Salvador Propionic acid Market Overview |
3.1 El Salvador Country Macro Economic Indicators |
3.2 El Salvador Propionic acid Market Revenues & Volume, 2021 & 2031F |
3.3 El Salvador Propionic acid Market - Industry Life Cycle |
3.4 El Salvador Propionic acid Market - Porter's Five Forces |
3.5 El Salvador Propionic acid Market Revenues & Volume Share, By Application, 2021 & 2031F |
3.6 El Salvador Propionic acid Market Revenues & Volume Share, By End use Industry, 2021 & 2031F |
4 El Salvador Propionic acid Market Dynamics |
4.1 Impact Analysis |
4.2 Market Drivers |
4.3 Market Restraints |
5 El Salvador Propionic acid Market Trends |
6 El Salvador Propionic acid Market Segmentations |
6.1 El Salvador Propionic acid Market, By Application |
6.1.1 Overview and Analysis |
6.1.2 El Salvador Propionic acid Market Revenues & Volume, By Herbicides, 2021-2031F |
6.1.3 El Salvador Propionic acid Market Revenues & Volume, By Rubber Products, 2021-2031F |
6.1.4 El Salvador Propionic acid Market Revenues & Volume, By Plasticizers, 2021-2031F |
6.1.5 El Salvador Propionic acid Market Revenues & Volume, By Food Preservatives, 2021-2031F |
6.1.6 El Salvador Propionic acid Market Revenues & Volume, By Others, 2021-2031F |
6.2 El Salvador Propionic acid Market, By End use Industry |
6.2.1 Overview and Analysis |
6.2.2 El Salvador Propionic acid Market Revenues & Volume, By Pharmaceuticals, 2021-2031F |
6.2.3 El Salvador Propionic acid Market Revenues & Volume, By Personal Care, 2021-2031F |
6.2.4 El Salvador Propionic acid Market Revenues & Volume, By Food & Beverage, 2021-2031F |
6.2.5 El Salvador Propionic acid Market Revenues & Volume, By Agriculture, 2021-2031F |
6.2.6 El Salvador Propionic acid Market Revenues & Volume, By Others, 2021-2031F |
7 El Salvador Propionic acid Market Import-Export Trade Statistics |
7.1 El Salvador Propionic acid Market Export to Major Countries |
7.2 El Salvador Propionic acid Market Imports from Major Countries |
8 El Salvador Propionic acid Market Key Performance Indicators |
9 El Salvador Propionic acid Market - Opportunity Assessment |
9.1 El Salvador Propionic acid Market Opportunity Assessment, By Application, 2021 & 2031F |
9.2 El Salvador Propionic acid Market Opportunity Assessment, By End use Industry, 2021 & 2031F |
10 El Salvador Propionic acid Market - Competitive Landscape |
10.1 El Salvador Propionic acid Market Revenue Share, By Companies, 2024 |
10.2 El Salvador Propionic acid Market Competitive Benchmarking, By Operating and Technical Parameters |
11 Company Profiles |
12 Recommendations | 13 Disclaimer |
Global Go To Market Strategy - 2030
Export potential enables firms to identify high-growth global markets with greater confidence by combining advanced trade intelligence with a structured quantitative methodology. The framework analyzes emerging demand trends and country-level import patterns while integrating macroeconomic and trade datasets such as GDP and population forecasts, bilateral import–export flows, tariff structures, elasticity differentials between developed and developing economies, geographic distance, and import demand projections. Using weighted trade values from 2020–2024 as the base period to project country-to-country export potential for 2030, these inputs are operationalized through calculated drivers such as gravity model parameters, tariff impact factors, and projected GDP per-capita growth. Through an analysis of hidden potentials, demand hotspots, and market conditions that are most favorable to success, this method enables firms to focus on target countries, maximize returns, and global expansion with data, backed by accuracy.
By factoring in the projected importer demand gap that is currently unmet and could be potential opportunity, it identifies the potential for the Exporter (Country) among 190 countries, against the general trade analysis, which identifies the biggest importer or exporter.
To discover high-growth global markets and optimize your business strategy:
Click Here
Pricing
- Single User License$ 1,995
- Department License$ 2,400
- Site License$ 3,120
- Global License$ 3,795

Leadership Perspectives from Industry Events
Search
Thought Leadership and Analyst Meet


Our Clients
6WResearch In News
- India Export Attractiveness Tracker 2026
- India Air Conditioner Market Set for Strong Rebound in 2026 After Weather-Led Correction and GST-Driven Recovery: 6Wresearch
- ADAS in India: How Automatic Emergency Braking, Blind Spot Detection & Driver Monitoring are Transforming Road Safety
- Doha a strategic location for EV manufacturing hub: IPA Qatar
- Demand for luxury TVs surging in the GCC, says Samsung
- Empowering Growth: The Thriving Journey of Bangladesh’s Cable Industry
Latest Reports
- Nicaragua RPG Gaming Market (2026-2032)
- New Zealand RPG Gaming Market (2026-2032)
- Netherlands RPG Gaming Market (2026-2032)
- Nauru RPG Gaming Market (2026-2032)
- Namibia RPG Gaming Market (2026-2032)
- Mozambique RPG Gaming Market (2026-2032)
- Montenegro RPG Gaming Market (2026-2032)
- Mongolia RPG Gaming Market (2026-2032)
- Monaco RPG Gaming Market (2026-2032)
- Micronesia RPG Gaming Market (2026-2032)
Industry Events and Analyst Meet

EV India Expo 2026

HIMTEX 2026

India Refining Summit 2026

India EV Show 2026

EV tech India Expo 2026
Whitepaper
- Middle East & Africa Commercial Security Market Click here to view more.
- Middle East & Africa Fire Safety Systems & Equipment Market Click here to view more.
- GCC Drone Market Click here to view more.
- Middle East Lighting Fixture Market Click here to view more.
- GCC Physical & Perimeter Security Market Click here to view more.