Estonia Chimney Caps Market (2026-2032) | Share, Value, Trends, Companies, Forecast, Growth, Segmentation, Competitive Landscape, Outlook, Analysis, Industry, Size & Revenue
Market Forecast By Type (Single-Flue, Multi-Flue), By Material (Stainless Steel, Copper, Concrete, Others), By Distribution Channel (Online, Offline), By Application (Residential, Non-residential) And Competitive Landscape
| Product Code: ETC7128793 | Publication Date: Sep 2024 | Updated Date: Apr 2026 | Product Type: Market Research Report | |
| Publisher: 6Wresearch | Author: Summon Dutta | No. of Pages: 75 | No. of Figures: 35 | No. of Tables: 20 |
Estonia Chimney Caps Market Size (2020-2030)
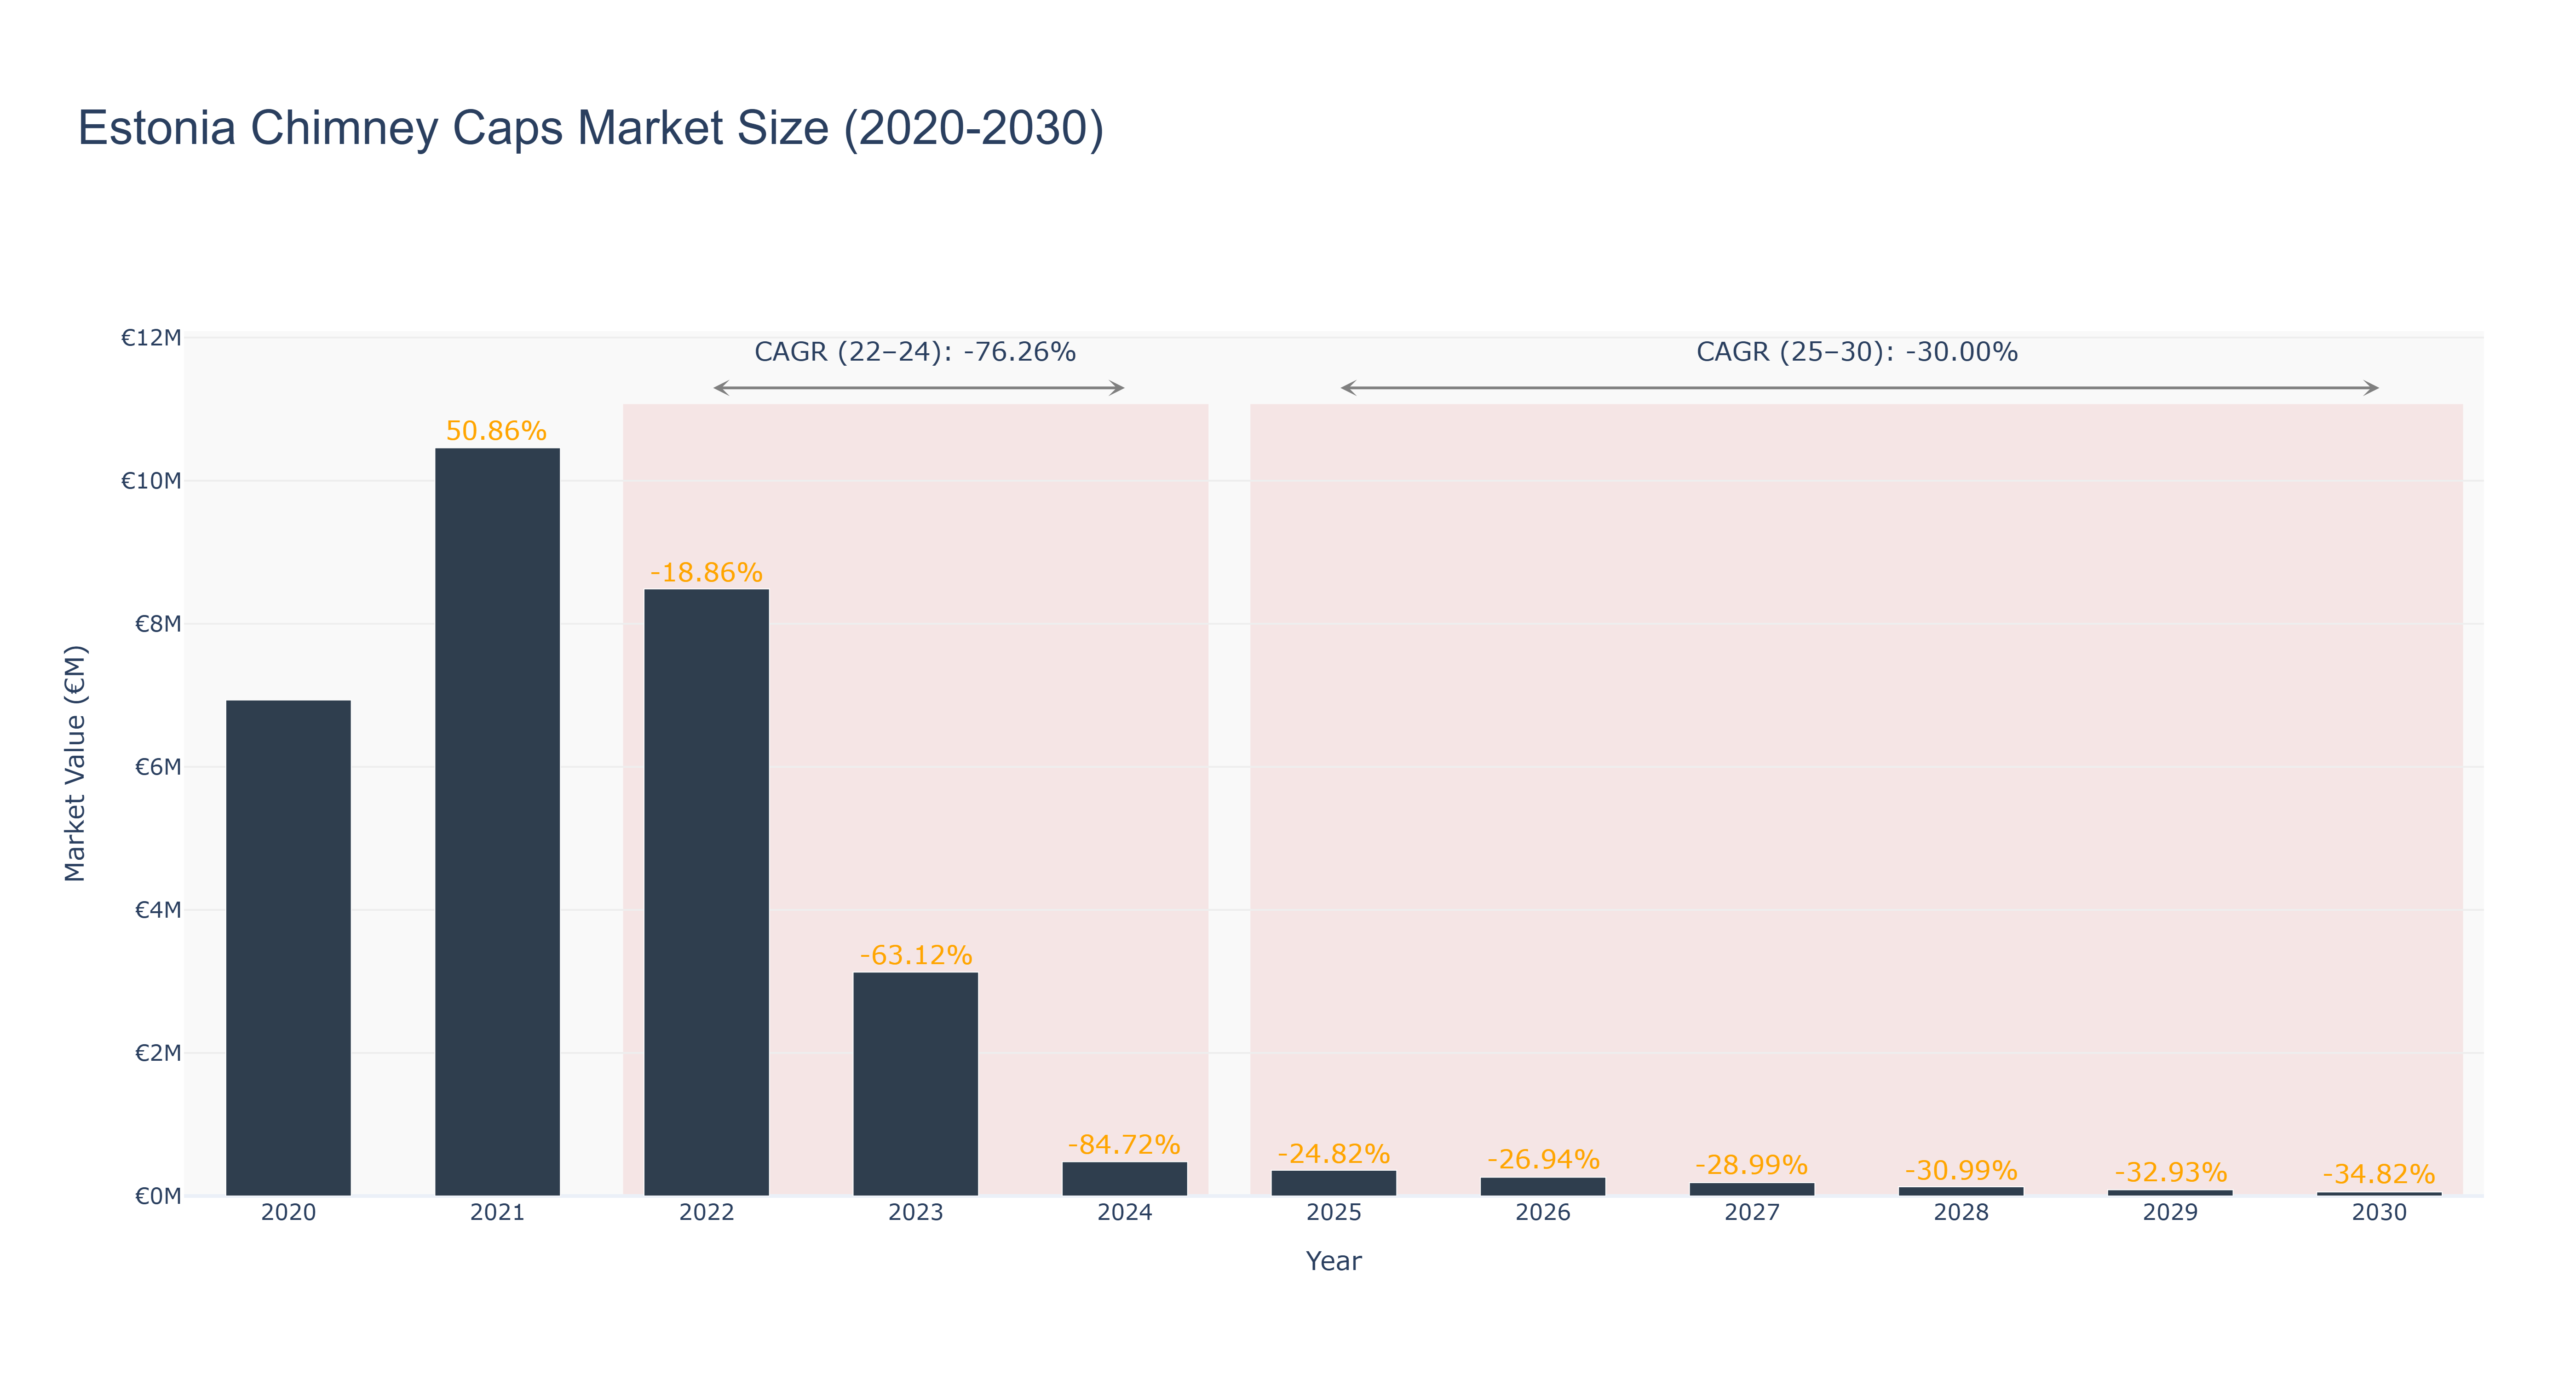
The Estonia Chimney Caps Market experienced significant fluctuations from 2020 to 2024, peaking in 2021 with a market size of €10.46 million, before declining dramatically to €478.32 thousand by 2024, reflecting a CAGR of -76.26% during this period. This downturn can be attributed to various factors, including reduced construction activity and a shift in consumer preferences towards alternative heating solutions. Looking ahead, the forecasted period from 2025 to 2030 indicates a continued contraction, with projected market sizes decreasing from €359.58 thousand in 2025 to €56.27 thousand by 2030, corresponding to a CAGR of -30.00%. The market's decline may be influenced by ongoing economic challenges and limited innovation in chimney cap technologies. As the industry adapts to changing regulations and environmental standards, there is potential for recovery if new projects are initiated that emphasize energy efficiency and sustainability in home heating solutions.
Estonia Chimney Caps Market: Production & Trade Performance (2019-2025)
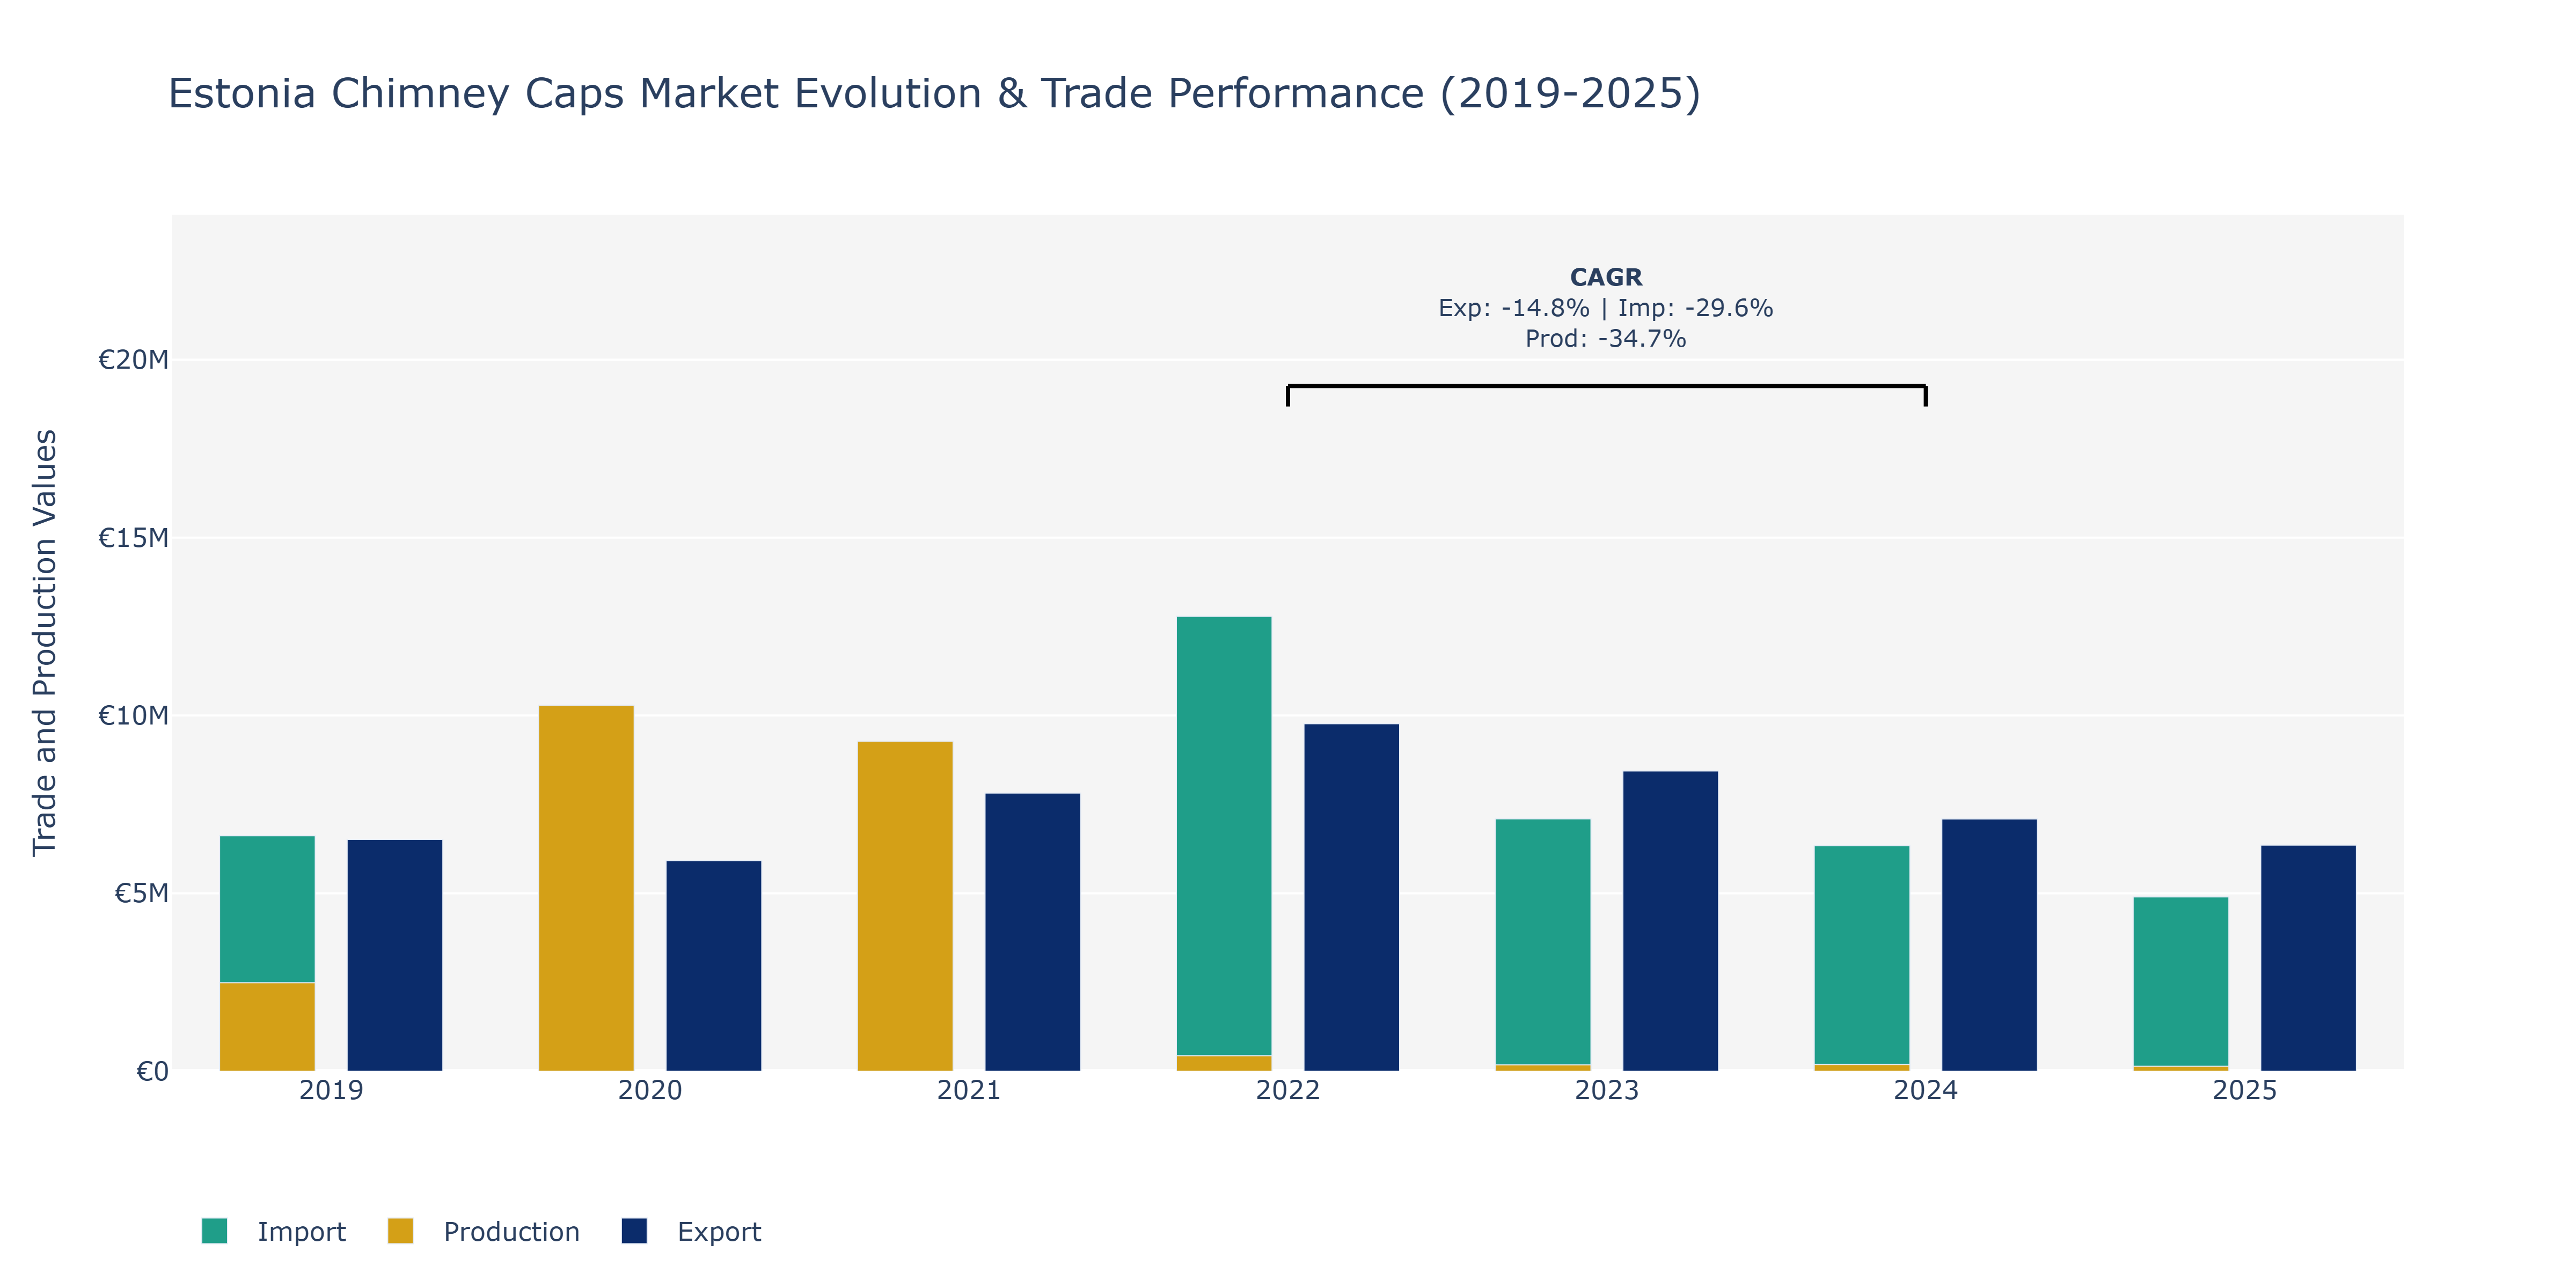
In the Estonia Chimney Caps Market, from 2019 to 2025, Exports experienced varying trends. In 2021, exports peaked at €7.82 million, showing a notable increase from the previous year. However, a decline began in 2022, with a substantial drop to €6.36 million in 2025. Imports saw fluctuations, peaking at €12.79 million in 2022 after a steady rise. Conversely, Production displayed a consistent downward trend throughout the period, reaching its lowest point in 2025 at €138.32 million. These shifts can be attributed to changes in market demand, industry regulations, and global economic conditions. The decrease in production may stem from technological advancements impacting manufacturing processes, while export fluctuations could be influenced by changes in international trade agreements and competition from other markets. Import variations might be linked to shifts in consumer preferences and supply chain disruptions. To maintain competitiveness, stakeholders could focus on innovation, quality improvement, and sustainable practices in line with industry trends.
Key Highlights of the Report:
- Estonia Chimney Caps Market Outlook
- Market Size of Estonia Chimney Caps Market, 2025
- Forecast of Estonia Chimney Caps Market, 2032
- Historical Data and Forecast of Estonia Chimney Caps Revenues & Volume for the Period 2022 - 2032
- Estonia Chimney Caps Market Trend Evolution
- Estonia Chimney Caps Market Drivers and Challenges
- Estonia Chimney Caps Price Trends
- Estonia Chimney Caps Porter's Five Forces
- Estonia Chimney Caps Industry Life Cycle
- Historical Data and Forecast of Estonia Chimney Caps Market Revenues & Volume By Type for the Period 2022 - 2032
- Historical Data and Forecast of Estonia Chimney Caps Market Revenues & Volume By Single-Flue for the Period 2022 - 2032
- Historical Data and Forecast of Estonia Chimney Caps Market Revenues & Volume By Multi-Flue for the Period 2022 - 2032
- Historical Data and Forecast of Estonia Chimney Caps Market Revenues & Volume By Material for the Period 2022 - 2032
- Historical Data and Forecast of Estonia Chimney Caps Market Revenues & Volume By Stainless Steel for the Period 2022 - 2032
- Historical Data and Forecast of Estonia Chimney Caps Market Revenues & Volume By Copper for the Period 2022 - 2032
- Historical Data and Forecast of Estonia Chimney Caps Market Revenues & Volume By Concrete for the Period 2022 - 2032
- Historical Data and Forecast of Estonia Chimney Caps Market Revenues & Volume By Others for the Period 2022 - 2032
- Historical Data and Forecast of Estonia Chimney Caps Market Revenues & Volume By Distribution Channel for the Period 2022 - 2032
- Historical Data and Forecast of Estonia Chimney Caps Market Revenues & Volume By Online for the Period 2022 - 2032
- Historical Data and Forecast of Estonia Chimney Caps Market Revenues & Volume By Offline for the Period 2022 - 2032
- Historical Data and Forecast of Estonia Chimney Caps Market Revenues & Volume By Application for the Period 2022 - 2032
- Historical Data and Forecast of Estonia Chimney Caps Market Revenues & Volume By Residential for the Period 2022 - 2032
- Historical Data and Forecast of Estonia Chimney Caps Market Revenues & Volume By Non-residential for the Period 2022 - 2032
- Estonia Chimney Caps Import Export Trade Statistics
- Market Opportunity Assessment By Type
- Market Opportunity Assessment By Material
- Market Opportunity Assessment By Distribution Channel
- Market Opportunity Assessment By Application
- Estonia Chimney Caps Top Companies Market Share
- Estonia Chimney Caps Competitive Benchmarking By Technical and Operational Parameters
- Estonia Chimney Caps Company Profiles
- Estonia Chimney Caps Key Strategic Recommendations
Frequently Asked Questions About the Market Study (FAQs):
6Wresearch actively monitors the Estonia Chimney Caps Market and publishes its comprehensive annual report, highlighting emerging trends, growth drivers, revenue analysis, and forecast outlook. Our insights help businesses to make data-backed strategic decisions with ongoing market dynamics. Our analysts track relevent industries related to the Estonia Chimney Caps Market, allowing our clients with actionable intelligence and reliable forecasts tailored to emerging regional needs.
Yes, we provide customisation as per your requirements. To learn more, feel free to contact us on sales@6wresearch.com
1 Executive Summary |
2 Introduction |
2.1 Key Highlights of the Report |
2.2 Report Description |
2.3 Market Scope & Segmentation |
2.4 Research Methodology |
2.5 Assumptions |
3 Estonia Chimney Caps Market Overview |
3.1 Estonia Country Macro Economic Indicators |
3.2 Estonia Chimney Caps Market Revenues & Volume, 2022 & 2032F |
3.3 Estonia Chimney Caps Market - Industry Life Cycle |
3.4 Estonia Chimney Caps Market - Porter's Five Forces |
3.5 Estonia Chimney Caps Market Revenues & Volume Share, By Type, 2022 & 2032F |
3.6 Estonia Chimney Caps Market Revenues & Volume Share, By Material, 2022 & 2032F |
3.7 Estonia Chimney Caps Market Revenues & Volume Share, By Distribution Channel, 2022 & 2032F |
3.8 Estonia Chimney Caps Market Revenues & Volume Share, By Application, 2022 & 2032F |
4 Estonia Chimney Caps Market Dynamics |
4.1 Impact Analysis |
4.2 Market Drivers |
4.3 Market Restraints |
5 Estonia Chimney Caps Market Trends |
6 Estonia Chimney Caps Market, By Types |
6.1 Estonia Chimney Caps Market, By Type |
6.1.1 Overview and Analysis |
6.1.2 Estonia Chimney Caps Market Revenues & Volume, By Type, 2022 - 2032F |
6.1.3 Estonia Chimney Caps Market Revenues & Volume, By Single-Flue, 2022 - 2032F |
6.1.4 Estonia Chimney Caps Market Revenues & Volume, By Multi-Flue, 2022 - 2032F |
6.2 Estonia Chimney Caps Market, By Material |
6.2.1 Overview and Analysis |
6.2.2 Estonia Chimney Caps Market Revenues & Volume, By Stainless Steel, 2022 - 2032F |
6.2.3 Estonia Chimney Caps Market Revenues & Volume, By Copper, 2022 - 2032F |
6.2.4 Estonia Chimney Caps Market Revenues & Volume, By Concrete, 2022 - 2032F |
6.2.5 Estonia Chimney Caps Market Revenues & Volume, By Others, 2022 - 2032F |
6.3 Estonia Chimney Caps Market, By Distribution Channel |
6.3.1 Overview and Analysis |
6.3.2 Estonia Chimney Caps Market Revenues & Volume, By Online, 2022 - 2032F |
6.3.3 Estonia Chimney Caps Market Revenues & Volume, By Offline, 2022 - 2032F |
6.4 Estonia Chimney Caps Market, By Application |
6.4.1 Overview and Analysis |
6.4.2 Estonia Chimney Caps Market Revenues & Volume, By Residential, 2022 - 2032F |
6.4.3 Estonia Chimney Caps Market Revenues & Volume, By Non-residential, 2022 - 2032F |
7 Estonia Chimney Caps Market Import-Export Trade Statistics |
7.1 Estonia Chimney Caps Market Export to Major Countries |
7.2 Estonia Chimney Caps Market Imports from Major Countries |
8 Estonia Chimney Caps Market Key Performance Indicators |
9 Estonia Chimney Caps Market - Opportunity Assessment |
9.1 Estonia Chimney Caps Market Opportunity Assessment, By Type, 2022 & 2032F |
9.2 Estonia Chimney Caps Market Opportunity Assessment, By Material, 2022 & 2032F |
9.3 Estonia Chimney Caps Market Opportunity Assessment, By Distribution Channel, 2022 & 2032F |
9.4 Estonia Chimney Caps Market Opportunity Assessment, By Application, 2022 & 2032F |
10 Estonia Chimney Caps Market - Competitive Landscape |
10.1 Estonia Chimney Caps Market Revenue Share, By Companies, 2025 |
10.2 Estonia Chimney Caps Market Competitive Benchmarking, By Operating and Technical Parameters |
11 Company Profiles |
12 Recommendations |
13 Disclaimer |
Global Go To Market Strategy - 2030
Export potential enables firms to identify high-growth global markets with greater confidence by combining advanced trade intelligence with a structured quantitative methodology. The framework analyzes emerging demand trends and country-level import patterns while integrating macroeconomic and trade datasets such as GDP and population forecasts, bilateral import–export flows, tariff structures, elasticity differentials between developed and developing economies, geographic distance, and import demand projections. Using weighted trade values from 2020–2024 as the base period to project country-to-country export potential for 2030, these inputs are operationalized through calculated drivers such as gravity model parameters, tariff impact factors, and projected GDP per-capita growth. Through an analysis of hidden potentials, demand hotspots, and market conditions that are most favorable to success, this method enables firms to focus on target countries, maximize returns, and global expansion with data, backed by accuracy.
By factoring in the projected importer demand gap that is currently unmet and could be potential opportunity, it identifies the potential for the Exporter (Country) among 190 countries, against the general trade analysis, which identifies the biggest importer or exporter.
To discover high-growth global markets and optimize your business strategy:
Click Here
Pricing
- Single User License$ 1,995
- Department License$ 2,400
- Site License$ 3,120
- Global License$ 3,795

Leadership Perspectives from Industry Events
Search
Thought Leadership and Analyst Meet


Our Clients
6WResearch In News
- Doha a strategic location for EV manufacturing hub: IPA Qatar
- Demand for luxury TVs surging in the GCC, says Samsung
- Empowering Growth: The Thriving Journey of Bangladesh’s Cable Industry
- Demand for luxury TVs surging in the GCC, says Samsung
- Video call with a traditional healer? Once unthinkable, it’s now common in South Africa
- Intelligent Buildings To Smooth GCC’s Path To Net Zero
Latest Reports
- Poland Fire Protection Systems Market (2026-2032)
- Cape Verde Portable Hand-Thrown Extinguisher Market (2026-2032)
- Canada Portable Hand-Thrown Extinguisher Market (2026-2032)
- Cameroon Portable Hand-Thrown Extinguisher Market (2026-2032)
- Burundi Portable Hand-Thrown Extinguisher Market (2026-2032)
- Burkina Faso Portable Hand-Thrown Extinguisher Market (2026-2032)
- Bulgaria Portable Hand-Thrown Extinguisher Market (2026-2032)
- Brunei Portable Hand-Thrown Extinguisher Market (2026-2032)
- Botswana Portable Hand-Thrown Extinguisher Market (2026-2032)
- Bosnia and Herzegovina Portable Hand-Thrown Extinguisher Market (2026-2032)
Industry Events and Analyst Meet

HIMTEX 2026

India Refining Summit 2026

India EV Show 2026

EV tech India Expo 2026

Auto Tech Asia 2026
Whitepaper
- Middle East & Africa Commercial Security Market Click here to view more.
- Middle East & Africa Fire Safety Systems & Equipment Market Click here to view more.
- GCC Drone Market Click here to view more.
- Middle East Lighting Fixture Market Click here to view more.
- GCC Physical & Perimeter Security Market Click here to view more.