Estonia Citric Acid Market (2025-2031) | Share, Value, Companies, Size, Analysis, Industry, Growth, Trends, Revenue, Segmentation, Outlook & Forecast
Market Forecast By Form (Liquid, Powder), By Application (Pharmaceutical, Food & beverages, Others) And Competitive Landscape
| Product Code: ETC4665805 | Publication Date: Nov 2023 | Updated Date: Apr 2026 | Product Type: Market Research Report | |
| Publisher: 6Wresearch | Author: Shubham Deep | No. of Pages: 60 | No. of Figures: 30 | No. of Tables: 5 |
Estonia Citric Acid Market Size (2020-2030)
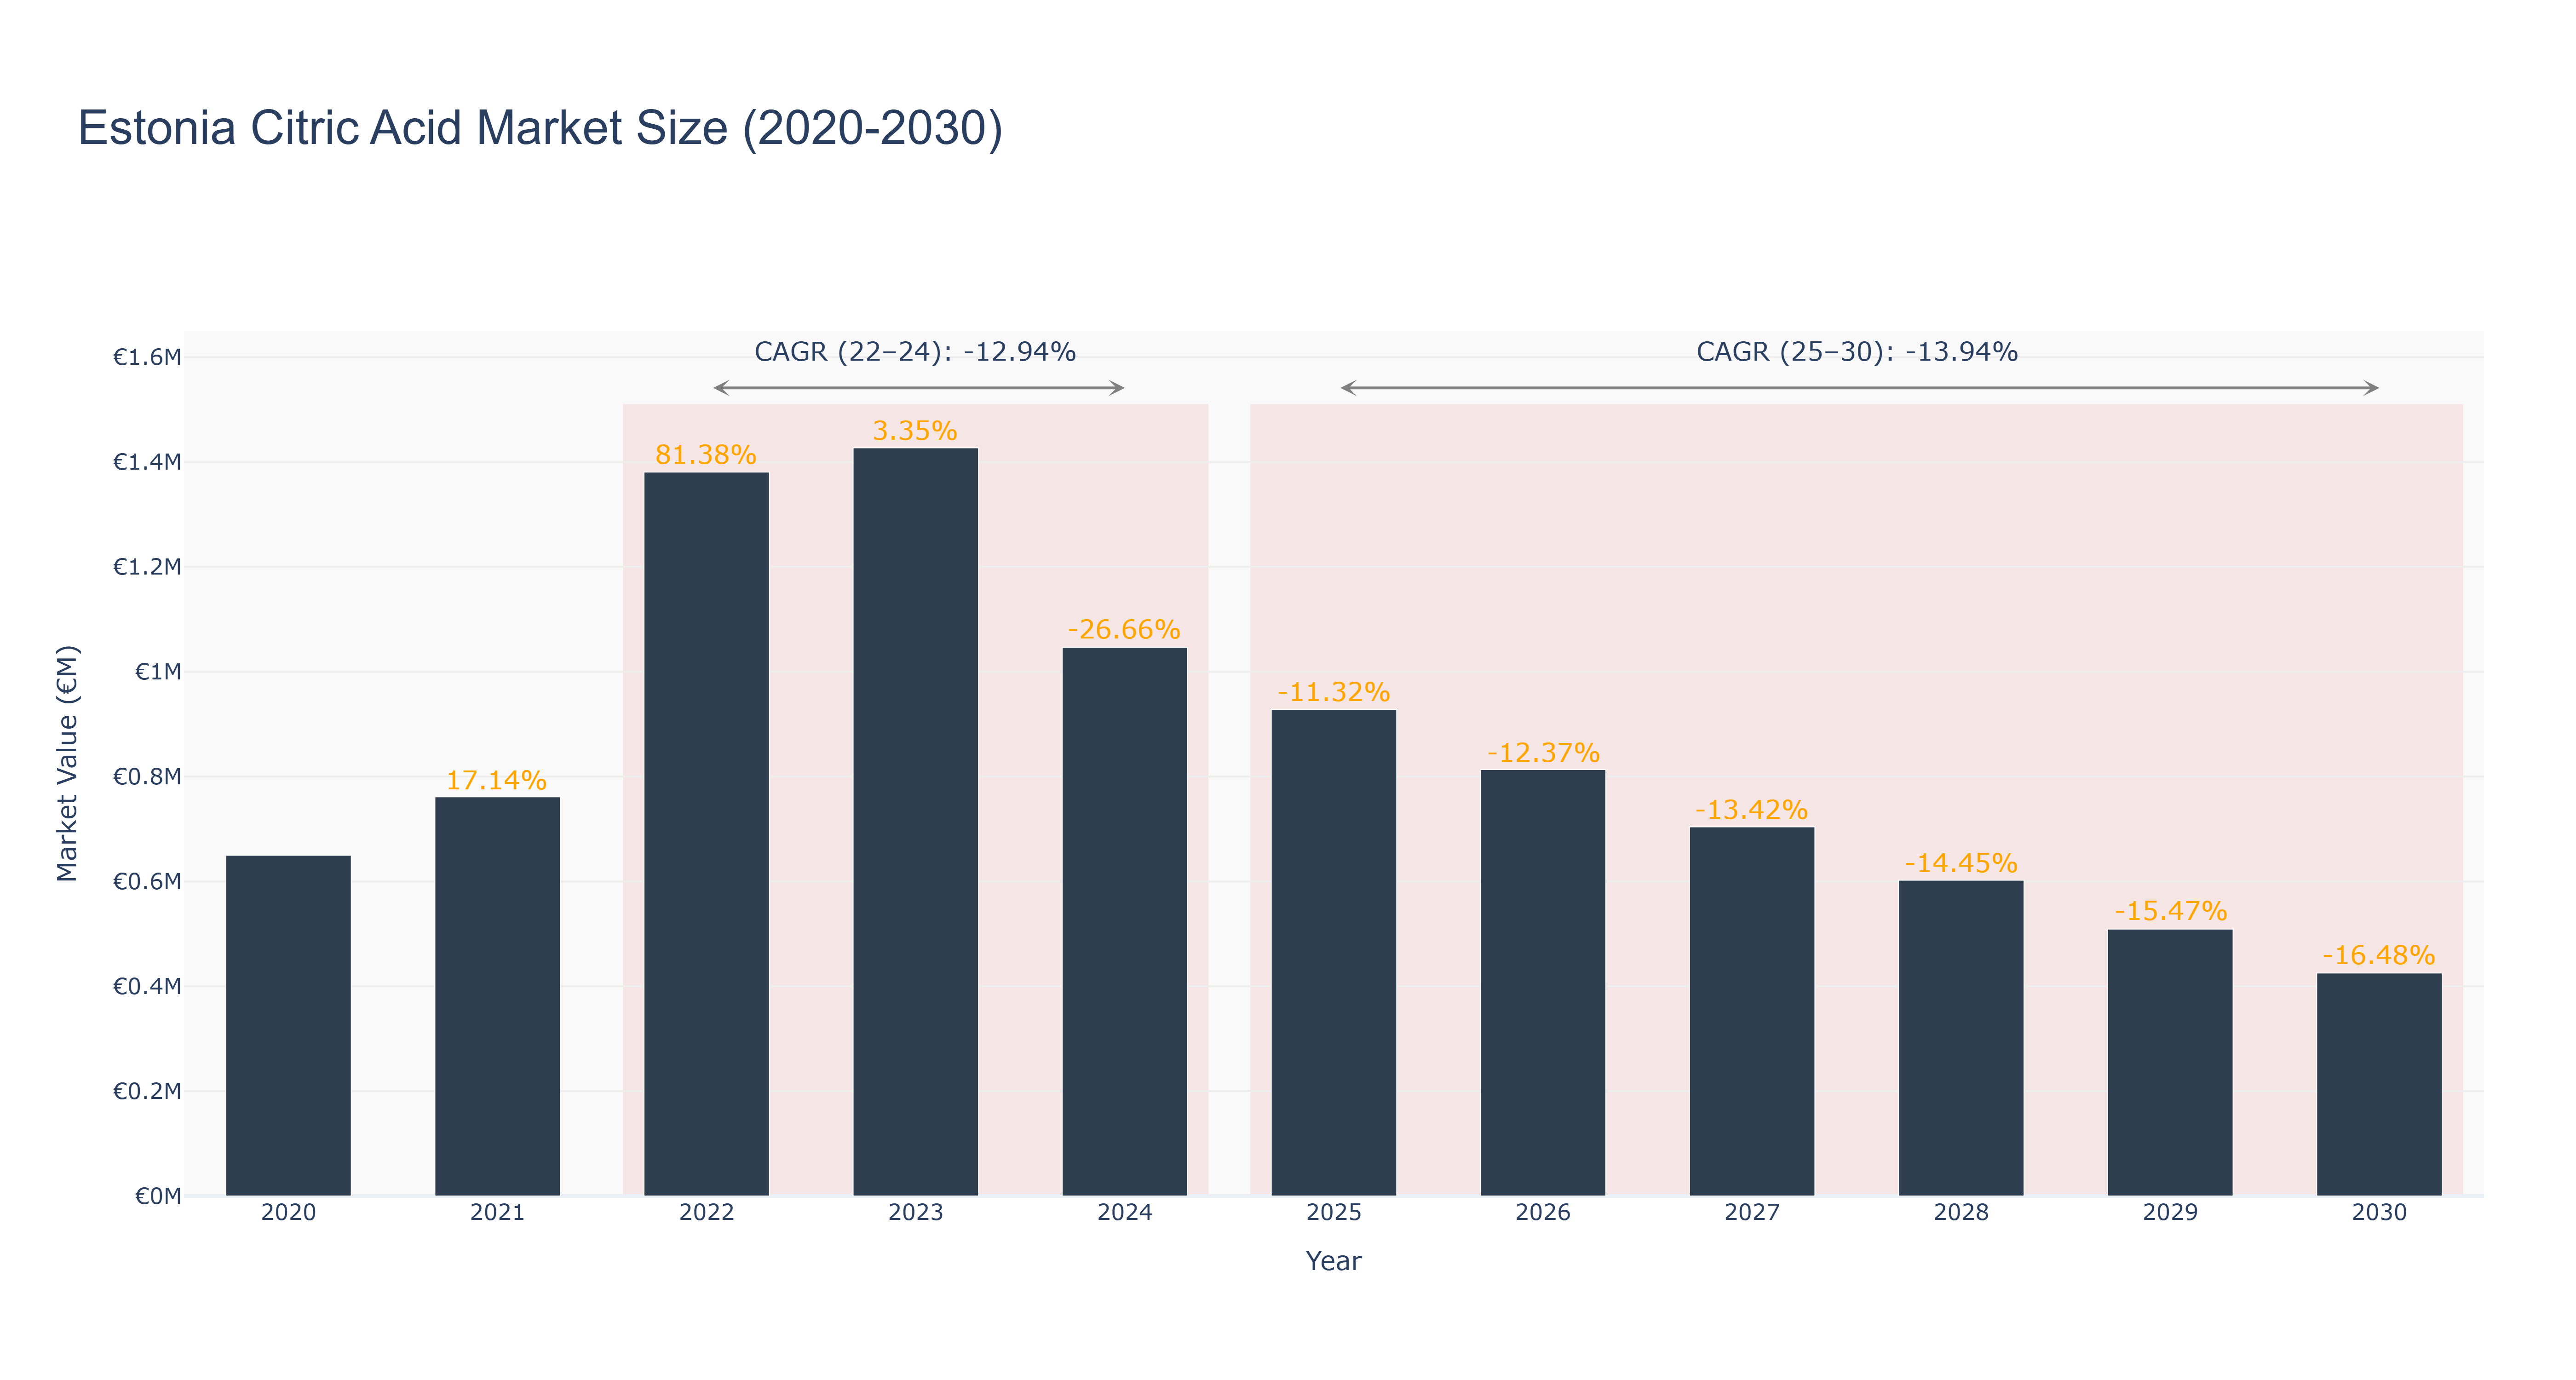
The Estonia Citric Acid Market has seen fluctuations in market size over the years. The peak market size was €1.43 million in 2023, followed by a decline to €0.93 million in 2025. The market is forecasted to further decrease to €0.43 million by 2030, with a CAGR of -13.94% from 2025 to 2030. The recent downward trend can be attributed to various factors such as changing consumer preferences, global economic conditions, and increased competition. Despite the current challenges, the market is expected to witness new developments in sustainable production practices and innovative product offerings in the coming years. These initiatives aim to drive market growth and enhance competitiveness in the industry. Overall, the Estonia Citric Acid Market is poised for transformation and adaptation to meet evolving market demands.
Estonia Citric Acid Market: Production & Trade Performance (2019-2025)
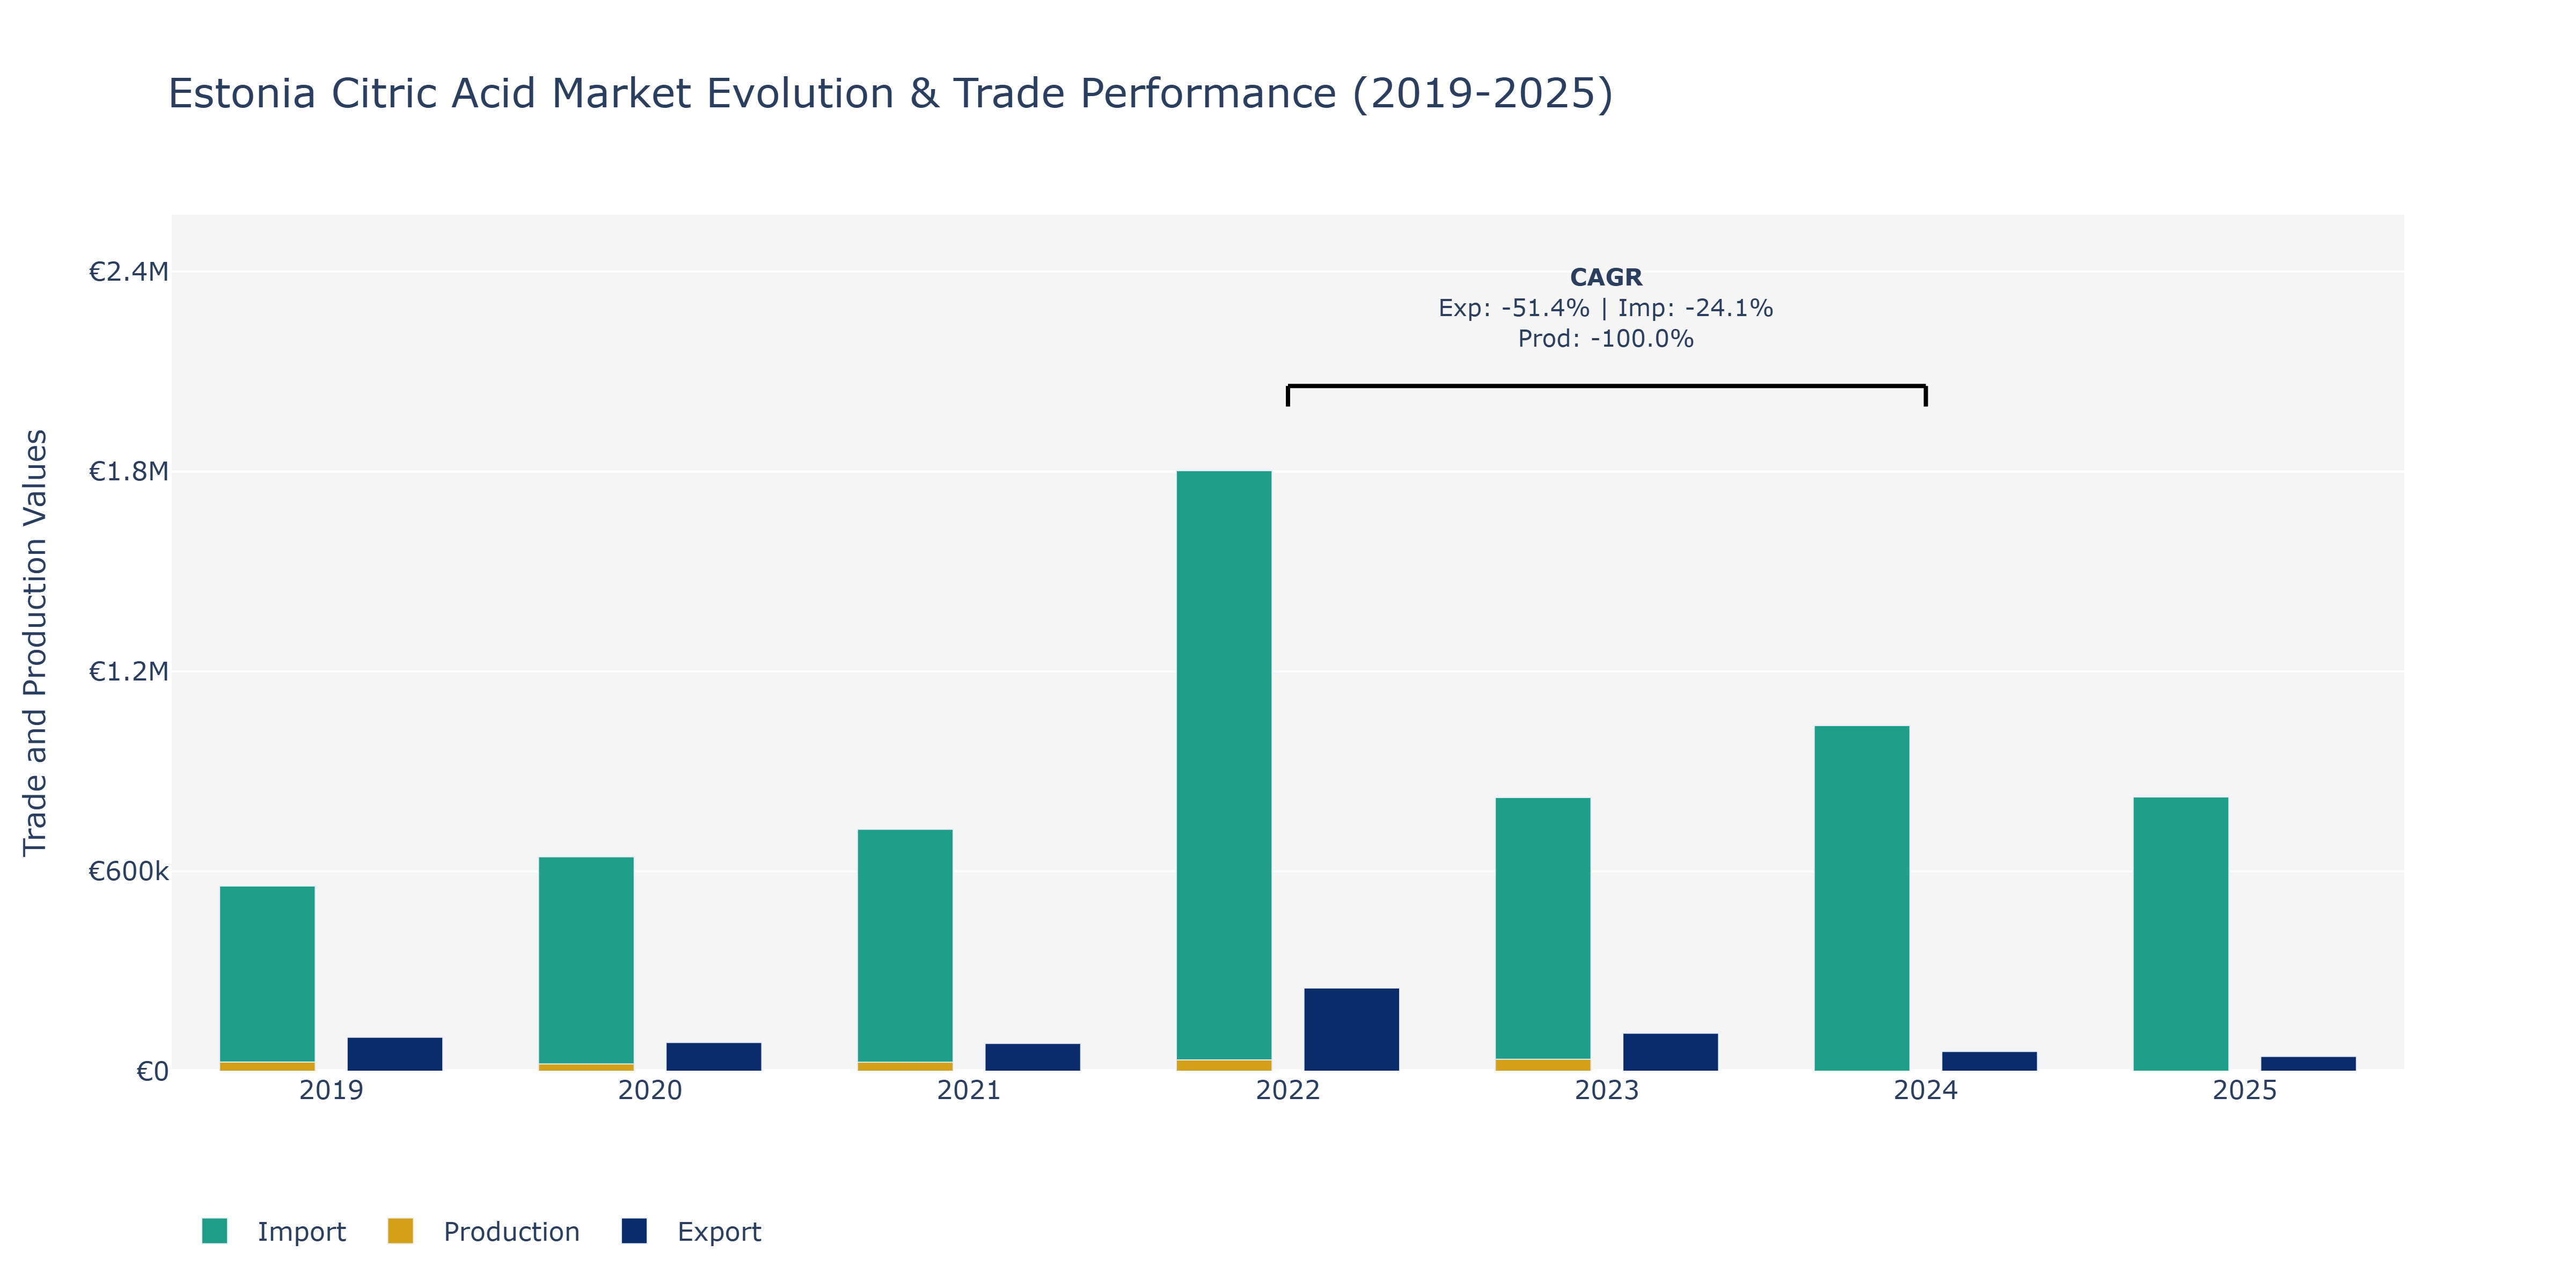
Between 2019 and 2025, the Estonia Citric Acid Market witnessed varied performances in Exports, Imports, and Production. Exports experienced a fluctuating trend, peaking at €249.83 thousand in 2022, followed by a sharp decline to €44.44 thousand in 2025. This decline may be attributed to changing demand dynamics in the global market due to factors such as shifting consumer preferences towards healthier alternatives or fluctuations in international trade policies impacting export volumes. Imports, on the other hand, steadily increased from €555.62 thousand in 2019 to €822.96 thousand in 2025, indicating a consistent upward trajectory possibly driven by increased demand for citric acid within Estonia or a rise in industrial applications requiring imports. Production remained stable until 2022 at €27.56 million before dropping to €21.59 thousand in 2020 and then recovering slightly to €27 thousand in 2021. To maintain market competitiveness, stakeholders may need to explore diversification strategies or enhance production capabilities to align with evolving industry demands and global market dynamics.
Estonia Citric Acid Market Overview
Used in food and beverage industries, citric acid is widely utilized in Estonia for its preservative qualities. The market benefits from the growing demand for processed foods and beverages, particularly as consumers seek out preservative-free and natural additives.
Drivers of the market
The Estonian citric acid market is growing due to its widespread use in food and beverage industries as a preservative, flavor enhancer, and acidulant. Additionally, the increasing use of citric acid in pharmaceutical and cosmetic products supports market expansion.
Challenges of the market
The citric acid market in Estonia faces challenges related to raw material costs, competition from substitutes, and environmental concerns. Citric acid is used in a variety of industries, including food and beverages, pharmaceuticals, and cleaning products. However, the cost of producing citric acid can fluctuate due to the price volatility of raw materials, such as corn and citrus fruits. Additionally, as consumers increasingly demand natural and organic products, the market faces competition from alternative acids and preservatives. Environmental concerns regarding the production process, which involves the fermentation of sugars, also push manufacturers to adopt more sustainable practices.
Government Policy of the market
Estonias policies for the citric acid market are in line with its goals to support sustainable manufacturing practices. Citric acid, used in food and beverage products, pharmaceuticals, and cleaning agents, is encouraged as a natural and biodegradable alternative to chemical additives. The government provides support for the development of sustainable production processes, particularly those that minimize waste and reduce energy consumption.
Key Highlights of the Report:
- Estonia Citric Acid Market Outlook
- Market Size of Estonia Citric Acid Market, 2024
- Forecast of Estonia Citric Acid Market, 2031
- Historical Data and Forecast of Estonia Citric Acid Revenues & Volume for the Period 2021-2031
- Estonia Citric Acid Market Trend Evolution
- Estonia Citric Acid Market Drivers and Challenges
- Estonia Citric Acid Price Trends
- Estonia Citric Acid Porter`s Five Forces
- Estonia Citric Acid Industry Life Cycle
- Historical Data and Forecast of Estonia Citric Acid Market Revenues & Volume By Form for the Period 2021-2031
- Historical Data and Forecast of Estonia Citric Acid Market Revenues & Volume By Liquid for the Period 2021-2031
- Historical Data and Forecast of Estonia Citric Acid Market Revenues & Volume By Powder for the Period 2021-2031
- Historical Data and Forecast of Estonia Citric Acid Market Revenues & Volume By Application for the Period 2021-2031
- Historical Data and Forecast of Estonia Citric Acid Market Revenues & Volume By Pharmaceutical for the Period 2021-2031
- Historical Data and Forecast of Estonia Citric Acid Market Revenues & Volume By Food & beverages for the Period 2021-2031
- Historical Data and Forecast of Estonia Citric Acid Market Revenues & Volume By Others for the Period 2021-2031
- Estonia Citric Acid Import Export Trade Statistics
- Market Opportunity Assessment By Form
- Market Opportunity Assessment By Application
- Estonia Citric Acid Top Companies Market Share
- Estonia Citric Acid Competitive Benchmarking By Technical and Operational Parameters
- Estonia Citric Acid Company Profiles
- Estonia Citric Acid Key Strategic Recommendations
Frequently Asked Questions About the Market Study (FAQs):
6Wresearch actively monitors the Estonia Citric Acid Market and publishes its comprehensive annual report, highlighting emerging trends, growth drivers, revenue analysis, and forecast outlook. Our insights help businesses to make data-backed strategic decisions with ongoing market dynamics. Our analysts track relevent industries related to the Estonia Citric Acid Market, allowing our clients with actionable intelligence and reliable forecasts tailored to emerging regional needs.
Yes, we provide customisation as per your requirements. To learn more, feel free to contact us on sales@6wresearch.com
1 Executive Summary |
2 Introduction |
2.1 Key Highlights of the Report |
2.2 Report Description |
2.3 Market Scope & Segmentation |
2.4 Research Methodology |
2.5 Assumptions |
3 Estonia Citric Acid Market Overview |
3.1 Estonia Country Macro Economic Indicators |
3.2 Estonia Citric Acid Market Revenues & Volume, 2021 & 2031F |
3.3 Estonia Citric Acid Market - Industry Life Cycle |
3.4 Estonia Citric Acid Market - Porter's Five Forces |
3.5 Estonia Citric Acid Market Revenues & Volume Share, By Form, 2021 & 2031F |
3.6 Estonia Citric Acid Market Revenues & Volume Share, By Application, 2021 & 2031F |
4 Estonia Citric Acid Market Dynamics |
4.1 Impact Analysis |
4.2 Market Drivers |
4.3 Market Restraints |
5 Estonia Citric Acid Market Trends |
6 Estonia Citric Acid Market Segmentations |
6.1 Estonia Citric Acid Market, By Form |
6.1.1 Overview and Analysis |
6.1.2 Estonia Citric Acid Market Revenues & Volume, By Liquid, 2021-2031F |
6.1.3 Estonia Citric Acid Market Revenues & Volume, By Powder, 2021-2031F |
6.2 Estonia Citric Acid Market, By Application |
6.2.1 Overview and Analysis |
6.2.2 Estonia Citric Acid Market Revenues & Volume, By Pharmaceutical, 2021-2031F |
6.2.3 Estonia Citric Acid Market Revenues & Volume, By Food & beverages, 2021-2031F |
6.2.4 Estonia Citric Acid Market Revenues & Volume, By Others, 2021-2031F |
7 Estonia Citric Acid Market Import-Export Trade Statistics |
7.1 Estonia Citric Acid Market Export to Major Countries |
7.2 Estonia Citric Acid Market Imports from Major Countries |
8 Estonia Citric Acid Market Key Performance Indicators |
9 Estonia Citric Acid Market - Opportunity Assessment |
9.1 Estonia Citric Acid Market Opportunity Assessment, By Form, 2021 & 2031F |
9.2 Estonia Citric Acid Market Opportunity Assessment, By Application, 2021 & 2031F |
10 Estonia Citric Acid Market - Competitive Landscape |
10.1 Estonia Citric Acid Market Revenue Share, By Companies, 2024 |
10.2 Estonia Citric Acid Market Competitive Benchmarking, By Operating and Technical Parameters |
11 Company Profiles |
12 Recommendations | 13 Disclaimer |
Global Go To Market Strategy - 2030
Export potential enables firms to identify high-growth global markets with greater confidence by combining advanced trade intelligence with a structured quantitative methodology. The framework analyzes emerging demand trends and country-level import patterns while integrating macroeconomic and trade datasets such as GDP and population forecasts, bilateral import–export flows, tariff structures, elasticity differentials between developed and developing economies, geographic distance, and import demand projections. Using weighted trade values from 2020–2024 as the base period to project country-to-country export potential for 2030, these inputs are operationalized through calculated drivers such as gravity model parameters, tariff impact factors, and projected GDP per-capita growth. Through an analysis of hidden potentials, demand hotspots, and market conditions that are most favorable to success, this method enables firms to focus on target countries, maximize returns, and global expansion with data, backed by accuracy.
By factoring in the projected importer demand gap that is currently unmet and could be potential opportunity, it identifies the potential for the Exporter (Country) among 190 countries, against the general trade analysis, which identifies the biggest importer or exporter.
To discover high-growth global markets and optimize your business strategy:
Click Here
Pricing
- Single User License$ 1,995
- Department License$ 2,400
- Site License$ 3,120
- Global License$ 3,795

Leadership Perspectives from Industry Events
Search
Thought Leadership and Analyst Meet


Our Clients
6WResearch In News
- India Export Attractiveness Tracker 2026
- India Air Conditioner Market Set for Strong Rebound in 2026 After Weather-Led Correction and GST-Driven Recovery: 6Wresearch
- ADAS in India: How Automatic Emergency Braking, Blind Spot Detection & Driver Monitoring are Transforming Road Safety
- Doha a strategic location for EV manufacturing hub: IPA Qatar
- Demand for luxury TVs surging in the GCC, says Samsung
- Empowering Growth: The Thriving Journey of Bangladesh’s Cable Industry
Latest Reports
- Nicaragua RPG Gaming Market (2026-2032)
- New Zealand RPG Gaming Market (2026-2032)
- Netherlands RPG Gaming Market (2026-2032)
- Nauru RPG Gaming Market (2026-2032)
- Namibia RPG Gaming Market (2026-2032)
- Mozambique RPG Gaming Market (2026-2032)
- Montenegro RPG Gaming Market (2026-2032)
- Mongolia RPG Gaming Market (2026-2032)
- Monaco RPG Gaming Market (2026-2032)
- Micronesia RPG Gaming Market (2026-2032)
Industry Events and Analyst Meet

EV India Expo 2026

HIMTEX 2026

India Refining Summit 2026

India EV Show 2026

EV tech India Expo 2026
Whitepaper
- Middle East & Africa Commercial Security Market Click here to view more.
- Middle East & Africa Fire Safety Systems & Equipment Market Click here to view more.
- GCC Drone Market Click here to view more.
- Middle East Lighting Fixture Market Click here to view more.
- GCC Physical & Perimeter Security Market Click here to view more.