Estonia Insulated Cooler Market (2026-2032) | Companies, Segmentation, Outlook, Forecast, Competitive Landscape, Analysis, Size & Revenue, Growth, Industry, Share, Trends, Value
Market Forecast By Capacity (Below 25 Quart, 26-75 Quart, 76-150 Quart, Above 150 Quart), By Product (Hard Coolers, Soft Coolers), By Carrying Method (Side Handles, Lid Handle, Shoulder Strap, Wheel), By Material Type (Plastic, Metal, Fabrics, Rubber) And Competitive Landscape
| Product Code: ETC7134755 | Publication Date: Sep 2024 | Updated Date: Apr 2026 | Product Type: Market Research Report | |
| Publisher: 6Wresearch | Author: Vasudha | No. of Pages: 75 | No. of Figures: 35 | No. of Tables: 20 |
Estonia Insulated Cooler Market Size (2020-2030)
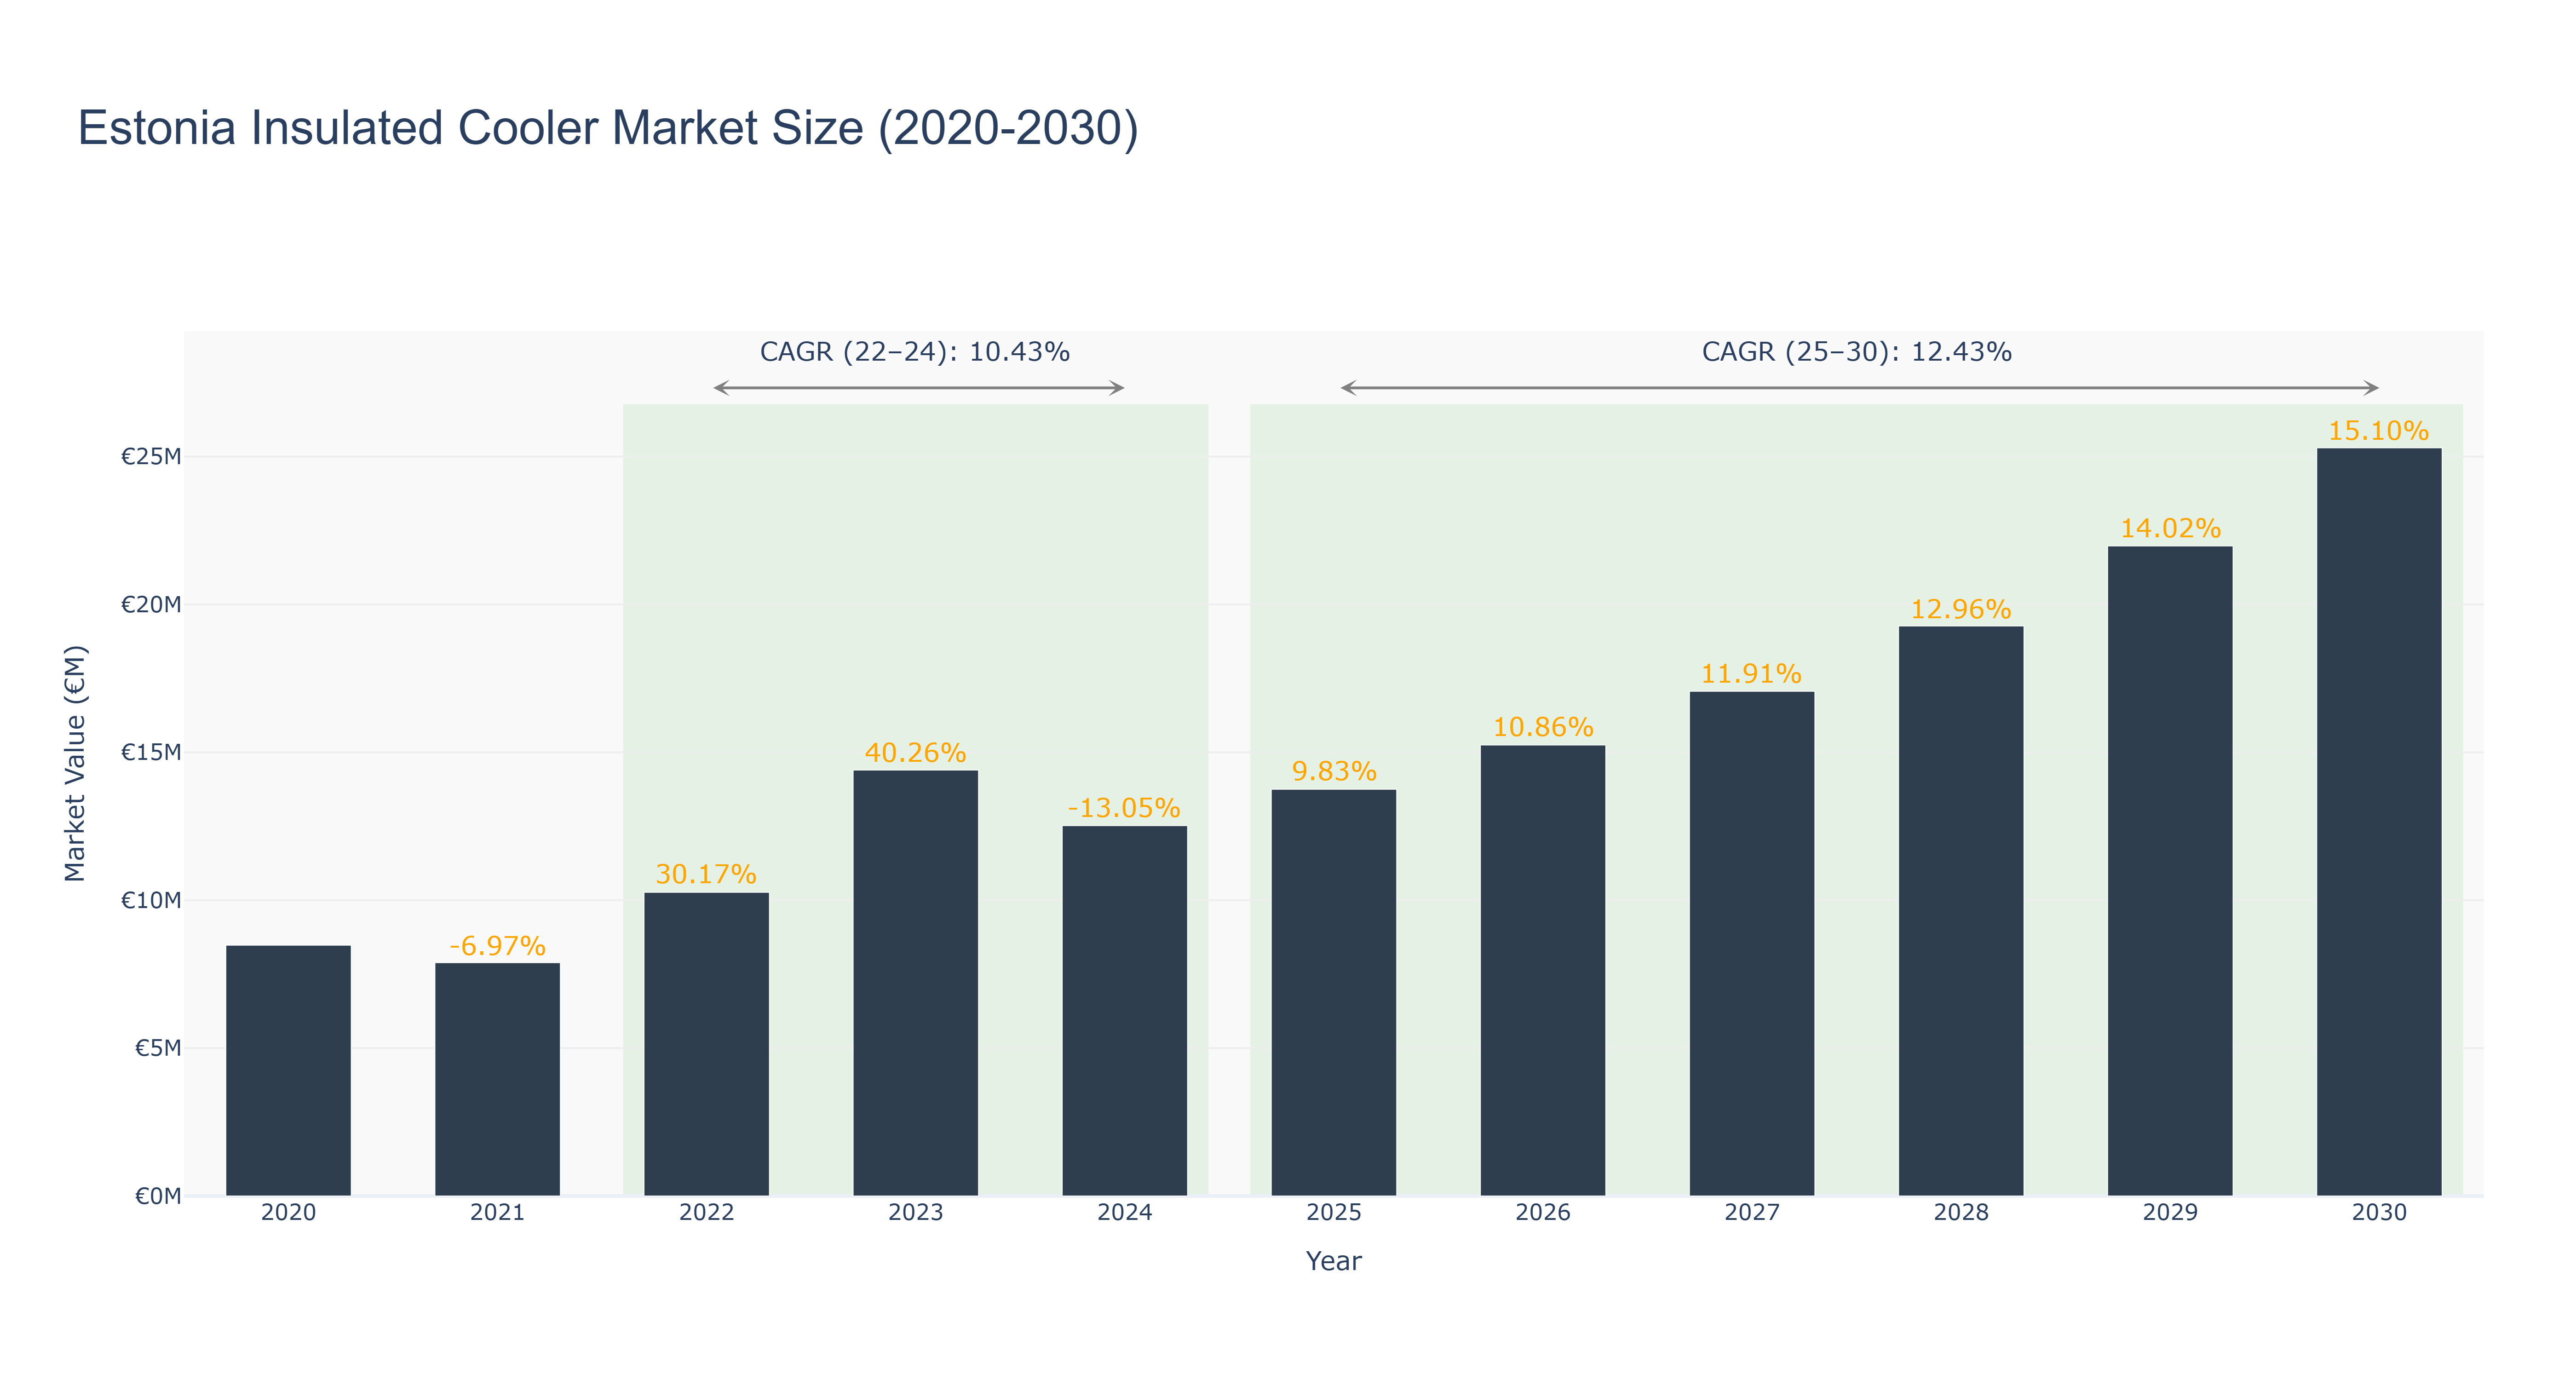
The Estonia Insulated Cooler Market has shown a fluctuating trend over the years. The peak market size was €25.30 million in 2030, with steady growth observed from 2020 to 2024, despite a slight decline in 2024. The forecasted market size from 2025 to 2030 is expected to continue growing at a Compound Annual Growth Rate (CAGR) of 12.43%, building on the momentum of the previous years. The market experienced a significant growth spurt in 2023, attributed to increased consumer demand for eco-friendly and energy-efficient cooling solutions. Looking ahead, the industry drivers for this market include a rising focus on sustainability and innovation in cooler technologies. In the near future, Estonia is set to launch a national initiative promoting the adoption of green cooling practices, further propelling the growth of the insulated cooler market.
Estonia Insulated Cooler Market: Production & Trade Performance (2019-2025)
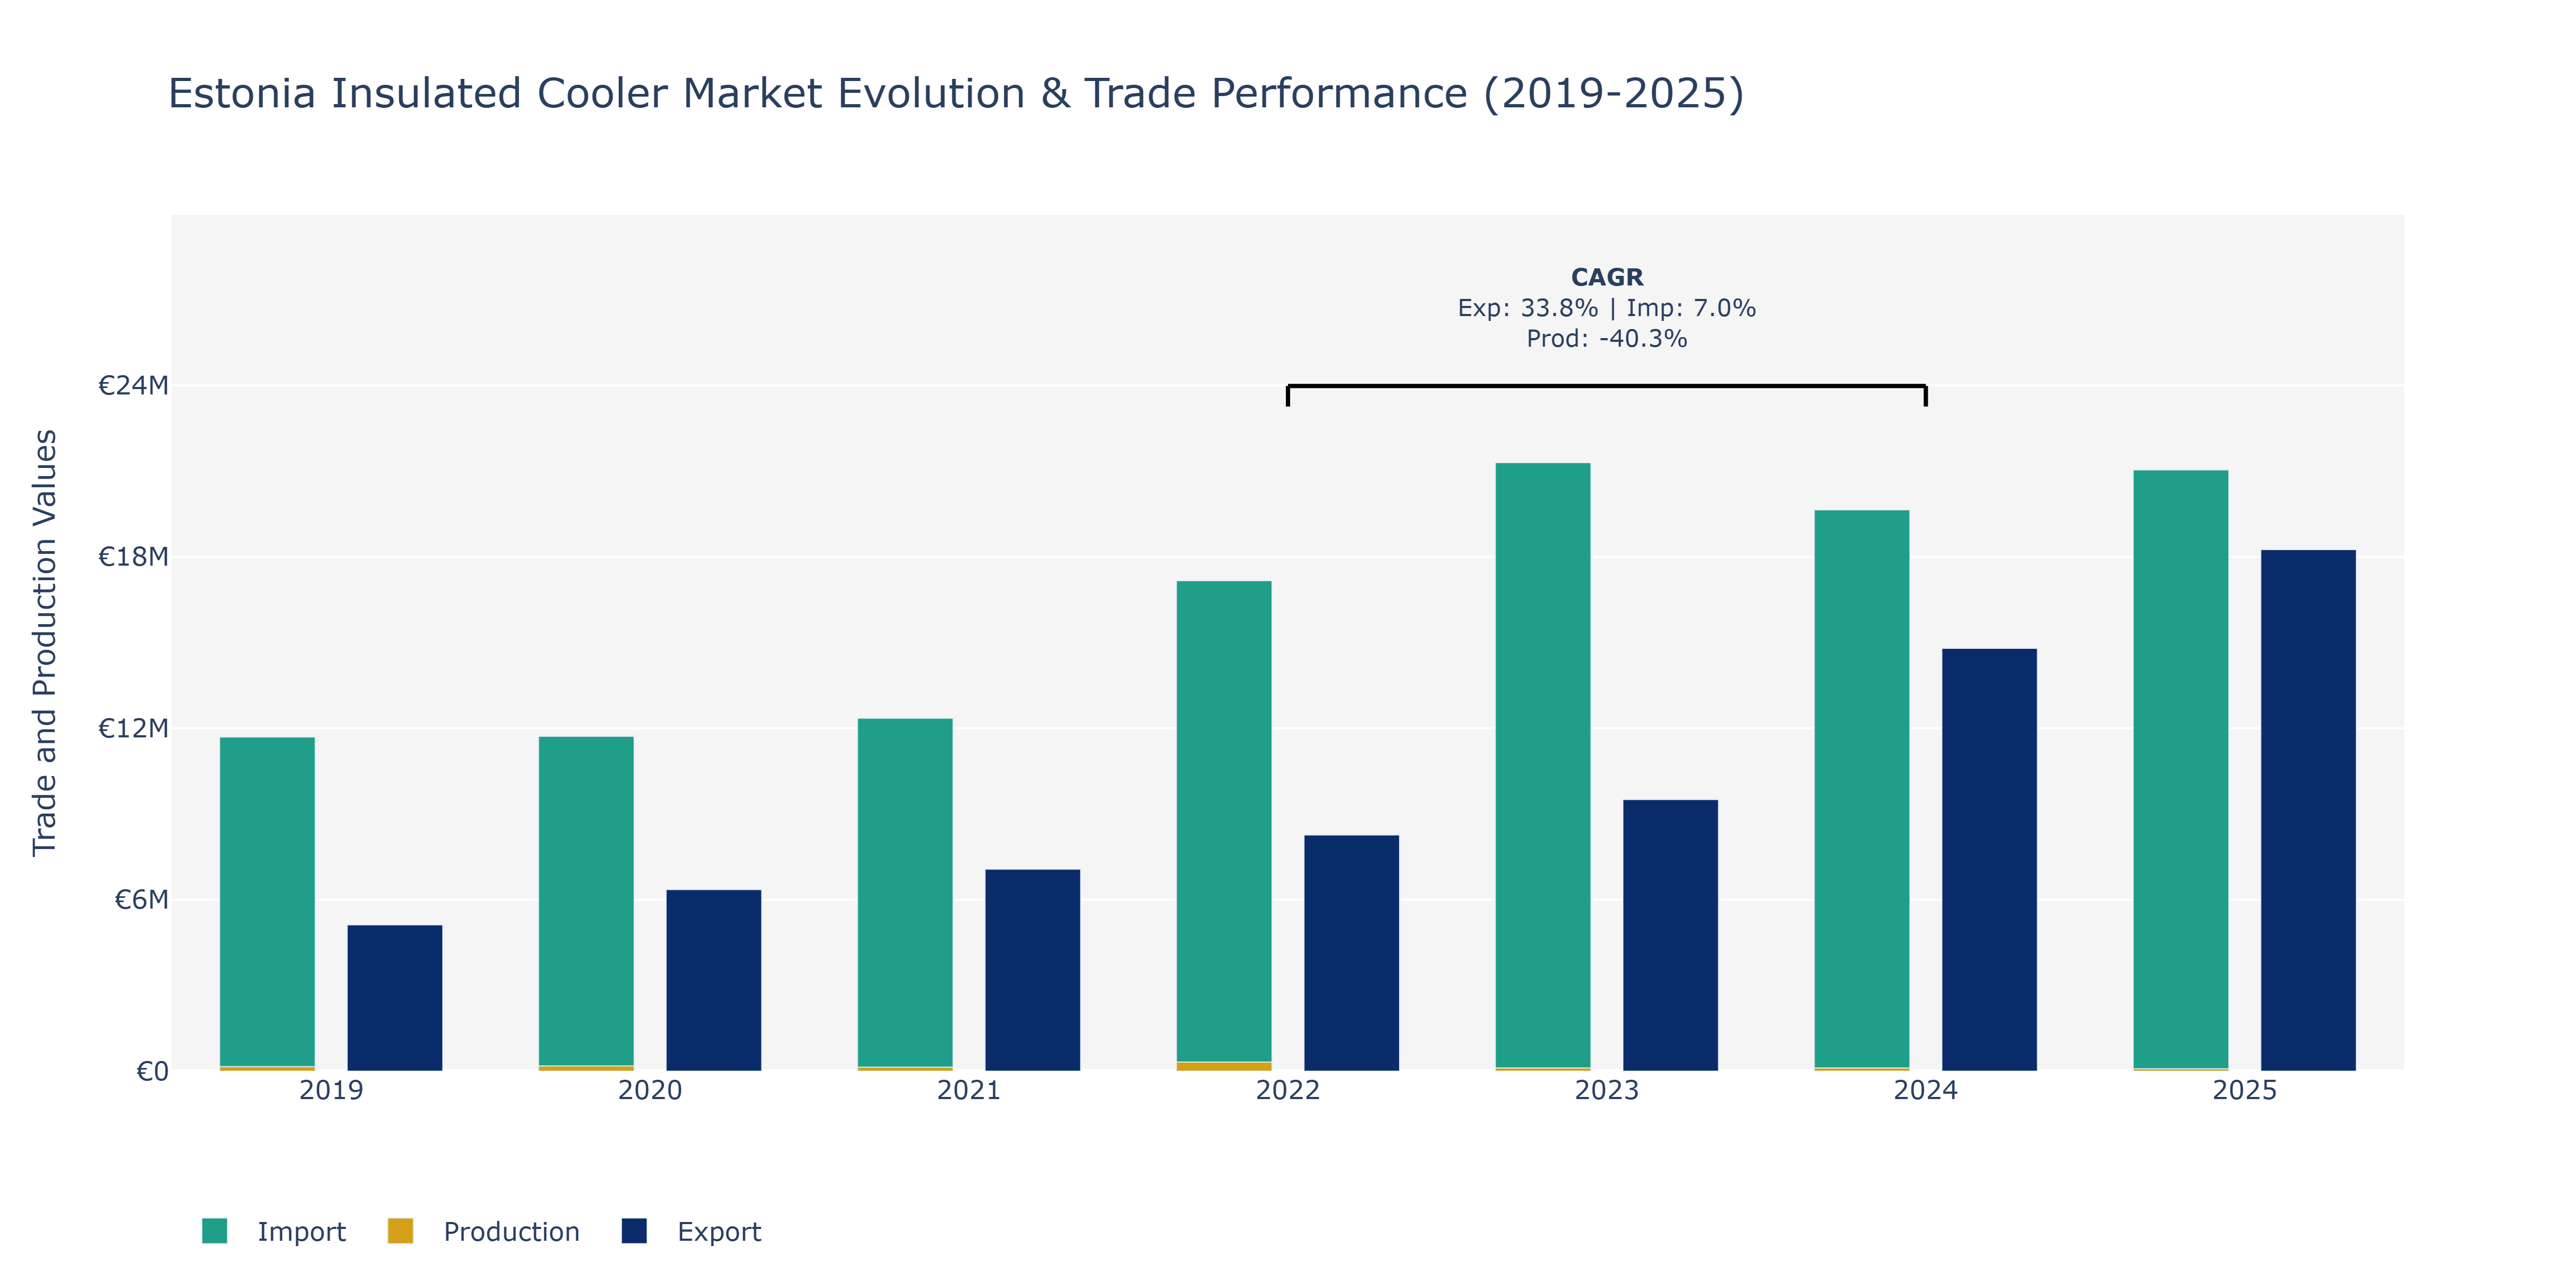
Between 2019 and 2025, the Estonia Insulated Cooler Market displayed notable fluctuations in Exports, Imports, and Production. Exports showed a steady upward trajectory, starting at €5.12 million in 2019 and reaching €18.25 million in 2025. Imports also saw consistent growth, with a peak of €21.30 million in 2023 before slightly decreasing to €21.04 million in 2025. Production, however, experienced significant variability, declining sharply from €161.55 million in 2019 to a low of €85.70 million in 2025. The remarkable surge in Exports can be attributed to the increasing global demand for insulated coolers, driven by trends like outdoor activities, picnics, and leisure travel. The fluctuating Production levels may reflect market saturation or shifts in consumer preferences towards alternative products. Import fluctuations could be influenced by changes in raw material costs or variations in international trade agreements impacting market dynamics. These trends underline the importance of staying agile in a competitive market landscape for Estonia's insulated cooler industry.
Key Highlights of the Report:
- Estonia Insulated Cooler Market Outlook
- Market Size of Estonia Insulated Cooler Market, 2025
- Forecast of Estonia Insulated Cooler Market, 2032
- Historical Data and Forecast of Estonia Insulated Cooler Revenues & Volume for the Period 2022 - 2032
- Estonia Insulated Cooler Market Trend Evolution
- Estonia Insulated Cooler Market Drivers and Challenges
- Estonia Insulated Cooler Price Trends
- Estonia Insulated Cooler Porter's Five Forces
- Estonia Insulated Cooler Industry Life Cycle
- Historical Data and Forecast of Estonia Insulated Cooler Market Revenues & Volume By Capacity for the Period 2022 - 2032
- Historical Data and Forecast of Estonia Insulated Cooler Market Revenues & Volume By Below 25 Quart for the Period 2022 - 2032
- Historical Data and Forecast of Estonia Insulated Cooler Market Revenues & Volume By 26-75 Quart for the Period 2022 - 2032
- Historical Data and Forecast of Estonia Insulated Cooler Market Revenues & Volume By 76-150 Quart for the Period 2022 - 2032
- Historical Data and Forecast of Estonia Insulated Cooler Market Revenues & Volume By Above 150 Quart for the Period 2022 - 2032
- Historical Data and Forecast of Estonia Insulated Cooler Market Revenues & Volume By Product for the Period 2022 - 2032
- Historical Data and Forecast of Estonia Insulated Cooler Market Revenues & Volume By Hard Coolers for the Period 2022 - 2032
- Historical Data and Forecast of Estonia Insulated Cooler Market Revenues & Volume By Soft Coolers for the Period 2022 - 2032
- Historical Data and Forecast of Estonia Insulated Cooler Market Revenues & Volume By Carrying Method for the Period 2022 - 2032
- Historical Data and Forecast of Estonia Insulated Cooler Market Revenues & Volume By Side Handles for the Period 2022 - 2032
- Historical Data and Forecast of Estonia Insulated Cooler Market Revenues & Volume By Lid Handle for the Period 2022 - 2032
- Historical Data and Forecast of Estonia Insulated Cooler Market Revenues & Volume By Shoulder Strap for the Period 2022 - 2032
- Historical Data and Forecast of Estonia Insulated Cooler Market Revenues & Volume By Wheel for the Period 2022 - 2032
- Historical Data and Forecast of Estonia Insulated Cooler Market Revenues & Volume By Material Type for the Period 2022 - 2032
- Historical Data and Forecast of Estonia Insulated Cooler Market Revenues & Volume By Plastic for the Period 2022 - 2032
- Historical Data and Forecast of Estonia Insulated Cooler Market Revenues & Volume By Metal for the Period 2022 - 2032
- Historical Data and Forecast of Estonia Insulated Cooler Market Revenues & Volume By Fabrics for the Period 2022 - 2032
- Historical Data and Forecast of Estonia Insulated Cooler Market Revenues & Volume By Rubber for the Period 2022 - 2032
- Estonia Insulated Cooler Import Export Trade Statistics
- Market Opportunity Assessment By Capacity
- Market Opportunity Assessment By Product
- Market Opportunity Assessment By Carrying Method
- Market Opportunity Assessment By Material Type
- Estonia Insulated Cooler Top Companies Market Share
- Estonia Insulated Cooler Competitive Benchmarking By Technical and Operational Parameters
- Estonia Insulated Cooler Company Profiles
- Estonia Insulated Cooler Key Strategic Recommendations
Frequently Asked Questions About the Market Study (FAQs):
6Wresearch actively monitors the Estonia Insulated Cooler Market and publishes its comprehensive annual report, highlighting emerging trends, growth drivers, revenue analysis, and forecast outlook. Our insights help businesses to make data-backed strategic decisions with ongoing market dynamics. Our analysts track relevent industries related to the Estonia Insulated Cooler Market, allowing our clients with actionable intelligence and reliable forecasts tailored to emerging regional needs.
Yes, we provide customisation as per your requirements. To learn more, feel free to contact us on sales@6wresearch.com
1 Executive Summary |
2 Introduction |
2.1 Key Highlights of the Report |
2.2 Report Description |
2.3 Market Scope & Segmentation |
2.4 Research Methodology |
2.5 Assumptions |
3 Estonia Insulated Cooler Market Overview |
3.1 Estonia Country Macro Economic Indicators |
3.2 Estonia Insulated Cooler Market Revenues & Volume, 2022 & 2032F |
3.3 Estonia Insulated Cooler Market - Industry Life Cycle |
3.4 Estonia Insulated Cooler Market - Porter's Five Forces |
3.5 Estonia Insulated Cooler Market Revenues & Volume Share, By Capacity, 2022 & 2032F |
3.6 Estonia Insulated Cooler Market Revenues & Volume Share, By Product, 2022 & 2032F |
3.7 Estonia Insulated Cooler Market Revenues & Volume Share, By Carrying Method, 2022 & 2032F |
3.8 Estonia Insulated Cooler Market Revenues & Volume Share, By Material Type, 2022 & 2032F |
4 Estonia Insulated Cooler Market Dynamics |
4.1 Impact Analysis |
4.2 Market Drivers |
4.3 Market Restraints |
5 Estonia Insulated Cooler Market Trends |
6 Estonia Insulated Cooler Market, By Types |
6.1 Estonia Insulated Cooler Market, By Capacity |
6.1.1 Overview and Analysis |
6.1.2 Estonia Insulated Cooler Market Revenues & Volume, By Capacity, 2022 - 2032F |
6.1.3 Estonia Insulated Cooler Market Revenues & Volume, By Below 25 Quart, 2022 - 2032F |
6.1.4 Estonia Insulated Cooler Market Revenues & Volume, By 26-75 Quart, 2022 - 2032F |
6.1.5 Estonia Insulated Cooler Market Revenues & Volume, By 76-150 Quart, 2022 - 2032F |
6.1.6 Estonia Insulated Cooler Market Revenues & Volume, By Above 150 Quart, 2022 - 2032F |
6.2 Estonia Insulated Cooler Market, By Product |
6.2.1 Overview and Analysis |
6.2.2 Estonia Insulated Cooler Market Revenues & Volume, By Hard Coolers, 2022 - 2032F |
6.2.3 Estonia Insulated Cooler Market Revenues & Volume, By Soft Coolers, 2022 - 2032F |
6.3 Estonia Insulated Cooler Market, By Carrying Method |
6.3.1 Overview and Analysis |
6.3.2 Estonia Insulated Cooler Market Revenues & Volume, By Side Handles, 2022 - 2032F |
6.3.3 Estonia Insulated Cooler Market Revenues & Volume, By Lid Handle, 2022 - 2032F |
6.3.4 Estonia Insulated Cooler Market Revenues & Volume, By Shoulder Strap, 2022 - 2032F |
6.3.5 Estonia Insulated Cooler Market Revenues & Volume, By Wheel, 2022 - 2032F |
6.4 Estonia Insulated Cooler Market, By Material Type |
6.4.1 Overview and Analysis |
6.4.2 Estonia Insulated Cooler Market Revenues & Volume, By Plastic, 2022 - 2032F |
6.4.3 Estonia Insulated Cooler Market Revenues & Volume, By Metal, 2022 - 2032F |
6.4.4 Estonia Insulated Cooler Market Revenues & Volume, By Fabrics, 2022 - 2032F |
6.4.5 Estonia Insulated Cooler Market Revenues & Volume, By Rubber, 2022 - 2032F |
7 Estonia Insulated Cooler Market Import-Export Trade Statistics |
7.1 Estonia Insulated Cooler Market Export to Major Countries |
7.2 Estonia Insulated Cooler Market Imports from Major Countries |
8 Estonia Insulated Cooler Market Key Performance Indicators |
9 Estonia Insulated Cooler Market - Opportunity Assessment |
9.1 Estonia Insulated Cooler Market Opportunity Assessment, By Capacity, 2022 & 2032F |
9.2 Estonia Insulated Cooler Market Opportunity Assessment, By Product, 2022 & 2032F |
9.3 Estonia Insulated Cooler Market Opportunity Assessment, By Carrying Method, 2022 & 2032F |
9.4 Estonia Insulated Cooler Market Opportunity Assessment, By Material Type, 2022 & 2032F |
10 Estonia Insulated Cooler Market - Competitive Landscape |
10.1 Estonia Insulated Cooler Market Revenue Share, By Companies, 2025 |
10.2 Estonia Insulated Cooler Market Competitive Benchmarking, By Operating and Technical Parameters |
11 Company Profiles |
12 Recommendations |
13 Disclaimer |
Global Go To Market Strategy - 2030
Export potential enables firms to identify high-growth global markets with greater confidence by combining advanced trade intelligence with a structured quantitative methodology. The framework analyzes emerging demand trends and country-level import patterns while integrating macroeconomic and trade datasets such as GDP and population forecasts, bilateral import–export flows, tariff structures, elasticity differentials between developed and developing economies, geographic distance, and import demand projections. Using weighted trade values from 2020–2024 as the base period to project country-to-country export potential for 2030, these inputs are operationalized through calculated drivers such as gravity model parameters, tariff impact factors, and projected GDP per-capita growth. Through an analysis of hidden potentials, demand hotspots, and market conditions that are most favorable to success, this method enables firms to focus on target countries, maximize returns, and global expansion with data, backed by accuracy.
By factoring in the projected importer demand gap that is currently unmet and could be potential opportunity, it identifies the potential for the Exporter (Country) among 190 countries, against the general trade analysis, which identifies the biggest importer or exporter.
To discover high-growth global markets and optimize your business strategy:
Click Here
Pricing
- Single User License$ 1,995
- Department License$ 2,400
- Site License$ 3,120
- Global License$ 3,795

Leadership Perspectives from Industry Events
Search
Thought Leadership and Analyst Meet


Our Clients
6WResearch In News
- India Export Attractiveness Tracker 2026
- India Air Conditioner Market Set for Strong Rebound in 2026 After Weather-Led Correction and GST-Driven Recovery: 6Wresearch
- ADAS in India: How Automatic Emergency Braking, Blind Spot Detection & Driver Monitoring are Transforming Road Safety
- Doha a strategic location for EV manufacturing hub: IPA Qatar
- Demand for luxury TVs surging in the GCC, says Samsung
- Empowering Growth: The Thriving Journey of Bangladesh’s Cable Industry
Latest Reports
- Nicaragua RPG Gaming Market (2026-2032)
- New Zealand RPG Gaming Market (2026-2032)
- Netherlands RPG Gaming Market (2026-2032)
- Nauru RPG Gaming Market (2026-2032)
- Namibia RPG Gaming Market (2026-2032)
- Mozambique RPG Gaming Market (2026-2032)
- Montenegro RPG Gaming Market (2026-2032)
- Mongolia RPG Gaming Market (2026-2032)
- Monaco RPG Gaming Market (2026-2032)
- Micronesia RPG Gaming Market (2026-2032)
Industry Events and Analyst Meet

EV India Expo 2026

HIMTEX 2026

India Refining Summit 2026

India EV Show 2026

EV tech India Expo 2026
Whitepaper
- Middle East & Africa Commercial Security Market Click here to view more.
- Middle East & Africa Fire Safety Systems & Equipment Market Click here to view more.
- GCC Drone Market Click here to view more.
- Middle East Lighting Fixture Market Click here to view more.
- GCC Physical & Perimeter Security Market Click here to view more.