Estonia Malic Acid Downstream Potential Market (2026-2032) | Trends, Investment Trends, Size, Strategic Insights, Supply, Companies, Segmentation, Outlook, Competition, Consumer Insights, Competitive, Forecast, Revenue, Segments, Industry, Restraints, Opportunities, Drivers, Share, Strategy, Demand, Growth, Analysis, Pricing Analysis, Value, Challenges
Market Forecast By Type (Food Grade, Industrial Grade, Pharma Grade), By Application (Acidulant in Beverages, Plasticizers, pH Regulator), By End User (Food Industry, Polymer Industry, Pharmaceuticals), By Distribution Channel (Direct Sales, Online Sales, Distributors) And Competitive Landscape
| Product Code: ETC12903135 | Publication Date: Apr 2025 | Updated Date: Apr 2026 | Product Type: Market Research Report | |
| Publisher: 6Wresearch | Author: Sachin Kumar Rai | No. of Pages: 65 | No. of Figures: 34 | No. of Tables: 19 |
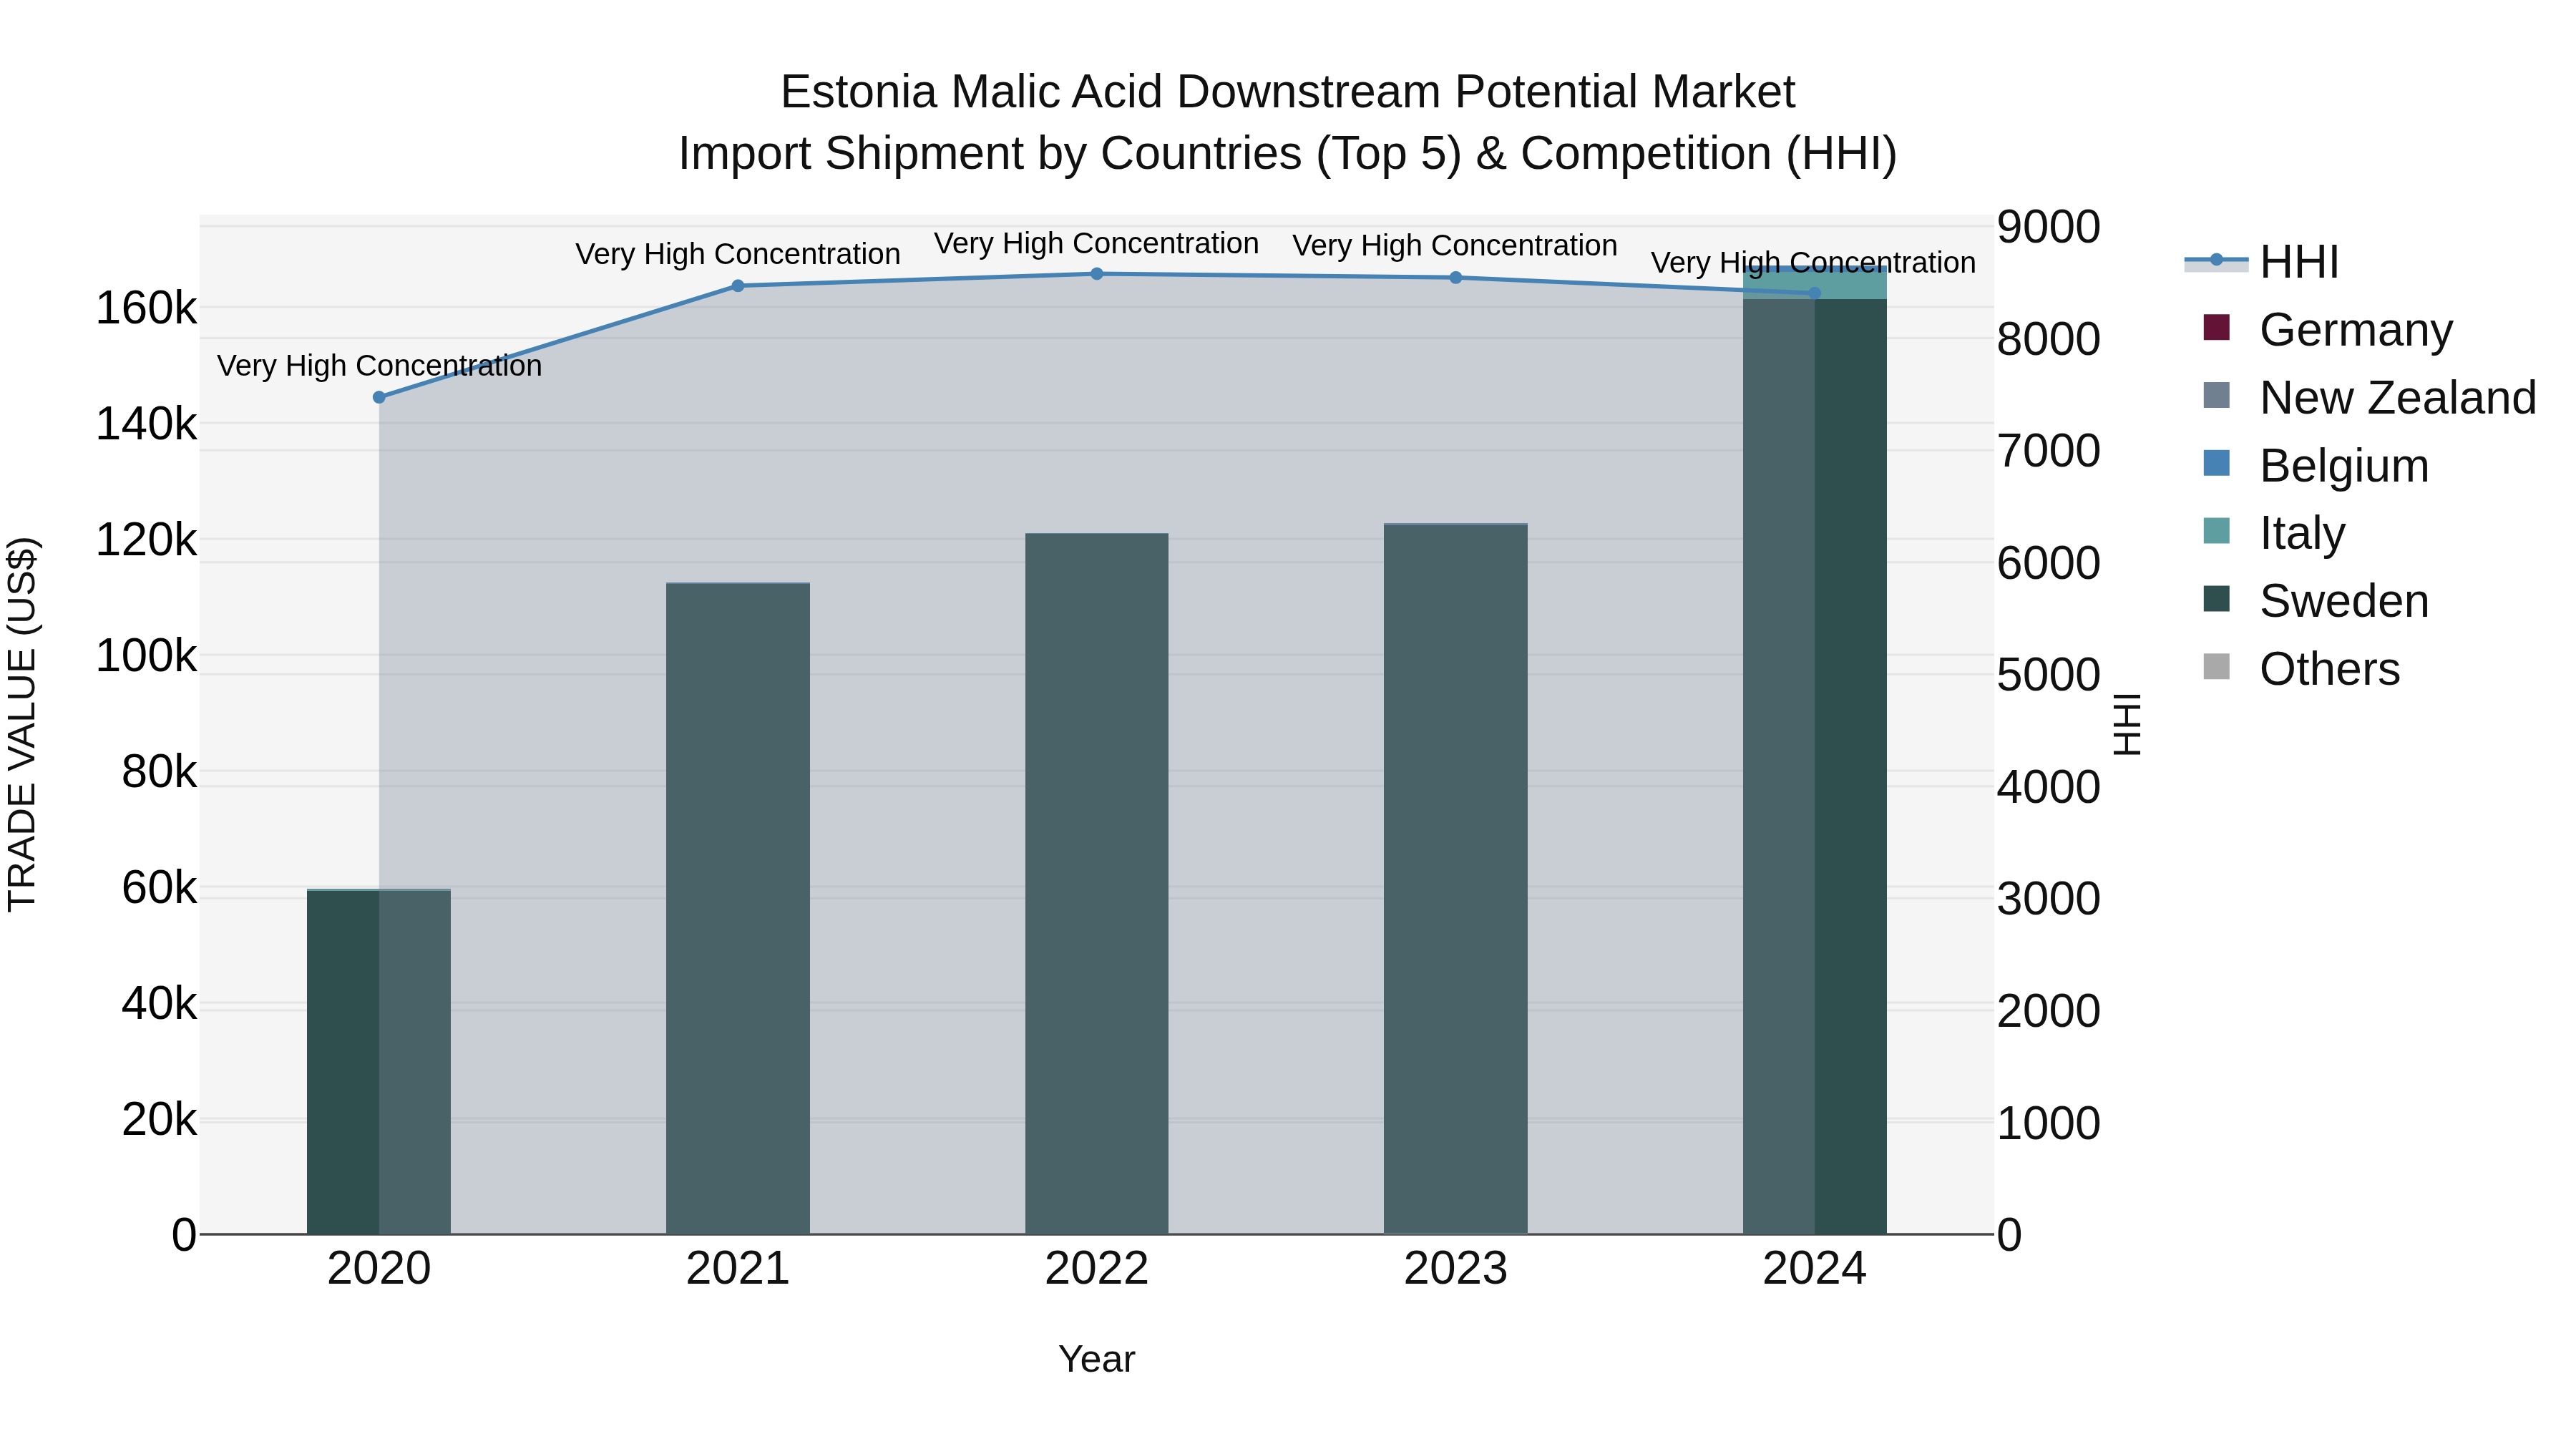
Estonia Malic Acid Downstream Potential Market Top 5 Importing Countries and Market Competition (HHI) Analysis
Estonia continues to show strong potential in importing malic acid, with notable growth rates in recent years. The top exporting countries to Estonia in 2024 include Sweden, Italy, Belgium, New Zealand, and Germany, indicating a diverse range of sources. The high Herfindahl-Hirschman Index (HHI) concentration suggests the market is still dominated by a few key players. With a high compound annual growth rate (CAGR) of 29.37% from 2020 to 2024 and a rapid growth rate of 36.16% in 2023-24, Estonia`s malic acid market is poised for further expansion and development.
Key Highlights of the Report:
- Estonia Malic Acid Downstream Potential Market Outlook
- Market Size of Estonia Malic Acid Downstream Potential Market, 2025
- Forecast of Estonia Malic Acid Downstream Potential Market, 2032
- Historical Data and Forecast of Estonia Malic Acid Downstream Potential Revenues & Volume for the Period 2022 - 2032F
- Estonia Malic Acid Downstream Potential Market Trend Evolution
- Estonia Malic Acid Downstream Potential Market Drivers and Challenges
- Estonia Malic Acid Downstream Potential Price Trends
- Estonia Malic Acid Downstream Potential Porter's Five Forces
- Estonia Malic Acid Downstream Potential Industry Life Cycle
- Historical Data and Forecast of Estonia Malic Acid Downstream Potential Market Revenues & Volume By Type for the Period 2022 - 2032F
- Historical Data and Forecast of Estonia Malic Acid Downstream Potential Market Revenues & Volume By Food Grade for the Period 2022 - 2032F
- Historical Data and Forecast of Estonia Malic Acid Downstream Potential Market Revenues & Volume By Industrial Grade for the Period 2022 - 2032F
- Historical Data and Forecast of Estonia Malic Acid Downstream Potential Market Revenues & Volume By Pharma Grade for the Period 2022 - 2032F
- Historical Data and Forecast of Estonia Malic Acid Downstream Potential Market Revenues & Volume By Application for the Period 2022 - 2032F
- Historical Data and Forecast of Estonia Malic Acid Downstream Potential Market Revenues & Volume By Acidulant in Beverages for the Period 2022 - 2032F
- Historical Data and Forecast of Estonia Malic Acid Downstream Potential Market Revenues & Volume By Plasticizers for the Period 2022 - 2032F
- Historical Data and Forecast of Estonia Malic Acid Downstream Potential Market Revenues & Volume By pH Regulator for the Period 2022 - 2032F
- Historical Data and Forecast of Estonia Malic Acid Downstream Potential Market Revenues & Volume By End User for the Period 2022 - 2032F
- Historical Data and Forecast of Estonia Malic Acid Downstream Potential Market Revenues & Volume By Food Industry for the Period 2022 - 2032F
- Historical Data and Forecast of Estonia Malic Acid Downstream Potential Market Revenues & Volume By Polymer Industry for the Period 2022 - 2032F
- Historical Data and Forecast of Estonia Malic Acid Downstream Potential Market Revenues & Volume By Pharmaceuticals for the Period 2022 - 2032F
- Historical Data and Forecast of Estonia Malic Acid Downstream Potential Market Revenues & Volume By Distribution Channel for the Period 2022 - 2032F
- Historical Data and Forecast of Estonia Malic Acid Downstream Potential Market Revenues & Volume By Direct Sales for the Period 2022 - 2032F
- Historical Data and Forecast of Estonia Malic Acid Downstream Potential Market Revenues & Volume By Online Sales for the Period 2022 - 2032F
- Historical Data and Forecast of Estonia Malic Acid Downstream Potential Market Revenues & Volume By Distributors for the Period 2022 - 2032F
- Estonia Malic Acid Downstream Potential Import Export Trade Statistics
- Market Opportunity Assessment By Type
- Market Opportunity Assessment By Application
- Market Opportunity Assessment By End User
- Market Opportunity Assessment By Distribution Channel
- Estonia Malic Acid Downstream Potential Top Companies Market Share
- Estonia Malic Acid Downstream Potential Competitive Benchmarking By Technical and Operational Parameters
- Estonia Malic Acid Downstream Potential Company Profiles
- Estonia Malic Acid Downstream Potential Key Strategic Recommendations
Frequently Asked Questions About the Market Study (FAQs):
6Wresearch actively monitors the Estonia Malic Acid Downstream Potential Market and publishes its comprehensive annual report, highlighting emerging trends, growth drivers, revenue analysis, and forecast outlook. Our insights help businesses to make data-backed strategic decisions with ongoing market dynamics. Our analysts track relevent industries related to the Estonia Malic Acid Downstream Potential Market, allowing our clients with actionable intelligence and reliable forecasts tailored to emerging regional needs.
Yes, we provide customisation as per your requirements. To learn more, feel free to contact us on sales@6wresearch.com
1 Executive Summary |
2 Introduction |
2.1 Key Highlights of the Report |
2.2 Report Description |
2.3 Market Scope & Segmentation |
2.4 Research Methodology |
2.5 Assumptions |
3 Estonia Malic Acid Downstream Potential Market Overview |
3.1 Estonia Country Macro Economic Indicators |
3.2 Estonia Malic Acid Downstream Potential Market Revenues & Volume, 2022 & 2032F |
3.3 Estonia Malic Acid Downstream Potential Market - Industry Life Cycle |
3.4 Estonia Malic Acid Downstream Potential Market - Porter's Five Forces |
3.5 Estonia Malic Acid Downstream Potential Market Revenues & Volume Share, By Type, 2022 & 2032F |
3.6 Estonia Malic Acid Downstream Potential Market Revenues & Volume Share, By Application, 2022 & 2032F |
3.7 Estonia Malic Acid Downstream Potential Market Revenues & Volume Share, By End User, 2022 & 2032F |
3.8 Estonia Malic Acid Downstream Potential Market Revenues & Volume Share, By Distribution Channel, 2022 & 2032F |
4 Estonia Malic Acid Downstream Potential Market Dynamics |
4.1 Impact Analysis |
4.2 Market Drivers |
4.2.1 Increasing demand for natural and organic food and beverages |
4.2.2 Growing awareness about health benefits of malic acid |
4.2.3 Rising trend of clean label products in the food industry |
4.3 Market Restraints |
4.3.1 Fluctuating prices of raw materials |
4.3.2 Stringent regulations related to food additives |
4.3.3 Competition from alternative food acids |
5 Estonia Malic Acid Downstream Potential Market Trends |
6 Estonia Malic Acid Downstream Potential Market, By Types |
6.1 Estonia Malic Acid Downstream Potential Market, By Type |
6.1.1 Overview and Analysis |
6.1.2 Estonia Malic Acid Downstream Potential Market Revenues & Volume, By Type, 2022 - 2032F |
6.1.3 Estonia Malic Acid Downstream Potential Market Revenues & Volume, By Food Grade, 2022 - 2032F |
6.1.4 Estonia Malic Acid Downstream Potential Market Revenues & Volume, By Industrial Grade, 2022 - 2032F |
6.1.5 Estonia Malic Acid Downstream Potential Market Revenues & Volume, By Pharma Grade, 2022 - 2032F |
6.2 Estonia Malic Acid Downstream Potential Market, By Application |
6.2.1 Overview and Analysis |
6.2.2 Estonia Malic Acid Downstream Potential Market Revenues & Volume, By Acidulant in Beverages, 2022 - 2032F |
6.2.3 Estonia Malic Acid Downstream Potential Market Revenues & Volume, By Plasticizers, 2022 - 2032F |
6.2.4 Estonia Malic Acid Downstream Potential Market Revenues & Volume, By pH Regulator, 2022 - 2032F |
6.3 Estonia Malic Acid Downstream Potential Market, By End User |
6.3.1 Overview and Analysis |
6.3.2 Estonia Malic Acid Downstream Potential Market Revenues & Volume, By Food Industry, 2022 - 2032F |
6.3.3 Estonia Malic Acid Downstream Potential Market Revenues & Volume, By Polymer Industry, 2022 - 2032F |
6.3.4 Estonia Malic Acid Downstream Potential Market Revenues & Volume, By Pharmaceuticals, 2022 - 2032F |
6.4 Estonia Malic Acid Downstream Potential Market, By Distribution Channel |
6.4.1 Overview and Analysis |
6.4.2 Estonia Malic Acid Downstream Potential Market Revenues & Volume, By Direct Sales, 2022 - 2032F |
6.4.3 Estonia Malic Acid Downstream Potential Market Revenues & Volume, By Online Sales, 2022 - 2032F |
6.4.4 Estonia Malic Acid Downstream Potential Market Revenues & Volume, By Distributors, 2022 - 2032F |
7 Estonia Malic Acid Downstream Potential Market Import-Export Trade Statistics |
7.1 Estonia Malic Acid Downstream Potential Market Export to Major Countries |
7.2 Estonia Malic Acid Downstream Potential Market Imports from Major Countries |
8 Estonia Malic Acid Downstream Potential Market Key Performance Indicators |
8.1 Percentage of food and beverage manufacturers using malic acid in Estonia |
8.2 Number of new product launches containing malic acid |
8.3 Growth rate of the natural food additives market in Estonia |
8.4 Percentage of consumers willing to pay a premium for products made with malic acid |
8.5 Number of research studies highlighting the benefits of malic acid |
9 Estonia Malic Acid Downstream Potential Market - Opportunity Assessment |
9.1 Estonia Malic Acid Downstream Potential Market Opportunity Assessment, By Type, 2022 & 2032F |
9.2 Estonia Malic Acid Downstream Potential Market Opportunity Assessment, By Application, 2022 & 2032F |
9.3 Estonia Malic Acid Downstream Potential Market Opportunity Assessment, By End User, 2022 & 2032F |
9.4 Estonia Malic Acid Downstream Potential Market Opportunity Assessment, By Distribution Channel, 2022 & 2032F |
10 Estonia Malic Acid Downstream Potential Market - Competitive Landscape |
10.1 Estonia Malic Acid Downstream Potential Market Revenue Share, By Companies, 2025 |
10.2 Estonia Malic Acid Downstream Potential Market Competitive Benchmarking, By Operating and Technical Parameters |
11 Company Profiles |
12 Recommendations |
13 Disclaimer |
Global Go To Market Strategy - 2030
Export potential enables firms to identify high-growth global markets with greater confidence by combining advanced trade intelligence with a structured quantitative methodology. The framework analyzes emerging demand trends and country-level import patterns while integrating macroeconomic and trade datasets such as GDP and population forecasts, bilateral import–export flows, tariff structures, elasticity differentials between developed and developing economies, geographic distance, and import demand projections. Using weighted trade values from 2020–2024 as the base period to project country-to-country export potential for 2030, these inputs are operationalized through calculated drivers such as gravity model parameters, tariff impact factors, and projected GDP per-capita growth. Through an analysis of hidden potentials, demand hotspots, and market conditions that are most favorable to success, this method enables firms to focus on target countries, maximize returns, and global expansion with data, backed by accuracy.
By factoring in the projected importer demand gap that is currently unmet and could be potential opportunity, it identifies the potential for the Exporter (Country) among 190 countries, against the general trade analysis, which identifies the biggest importer or exporter.
To discover high-growth global markets and optimize your business strategy:
Click Here
Pricing
- Single User License$ 1,995
- Department License$ 2,400
- Site License$ 3,120
- Global License$ 3,795

Leadership Perspectives from Industry Events
Search
Thought Leadership and Analyst Meet


Our Clients
6WResearch In News
- Doha a strategic location for EV manufacturing hub: IPA Qatar
- Demand for luxury TVs surging in the GCC, says Samsung
- Empowering Growth: The Thriving Journey of Bangladesh’s Cable Industry
- Demand for luxury TVs surging in the GCC, says Samsung
- Video call with a traditional healer? Once unthinkable, it’s now common in South Africa
- Intelligent Buildings To Smooth GCC’s Path To Net Zero
Latest Reports
- Cape Verde Portable Hand-Thrown Extinguisher Market (2026-2032)
- Canada Portable Hand-Thrown Extinguisher Market (2026-2032)
- Cameroon Portable Hand-Thrown Extinguisher Market (2026-2032)
- Burundi Portable Hand-Thrown Extinguisher Market (2026-2032)
- Burkina Faso Portable Hand-Thrown Extinguisher Market (2026-2032)
- Bulgaria Portable Hand-Thrown Extinguisher Market (2026-2032)
- Brunei Portable Hand-Thrown Extinguisher Market (2026-2032)
- Botswana Portable Hand-Thrown Extinguisher Market (2026-2032)
- Bosnia and Herzegovina Portable Hand-Thrown Extinguisher Market (2026-2032)
- Bolivia Portable Hand-Thrown Extinguisher Market (2026-2032)
Industry Events and Analyst Meet

HIMTEX 2026

India Refining Summit 2026

India EV Show 2026

EV tech India Expo 2026

Auto Tech Asia 2026
Whitepaper
- Middle East & Africa Commercial Security Market Click here to view more.
- Middle East & Africa Fire Safety Systems & Equipment Market Click here to view more.
- GCC Drone Market Click here to view more.
- Middle East Lighting Fixture Market Click here to view more.
- GCC Physical & Perimeter Security Market Click here to view more.