Estonia Operating Table Market (2026-2032) | Consumer Insights, Size, Segments, Growth, Restraints, Demand, Investment Trends, Forecast, Companies, Pricing Analysis, Trends, Supply, Competition, Strategic Insights, Strategy, Segmentation, Drivers, Opportunities, Competitive, Value, Share, Revenue, Industry, Analysis, Challenges, Outlook
Market Forecast By Type (Electric, Hydraulic, Manual, Adjustable), By Material (Stainless Steel, Aluminum, Carbon Fiber, Plastic), By Adjustment Mechanism (Manual, Motorized, Pneumatic, Hydraulic), By Functionality (Surgical, Orthopedic, ICU, Examination), By Weight Capacity (300kg, 500kg, 700kg, 800kg) And Competitive Landscape
| Product Code: ETC10705887 | Publication Date: Apr 2025 | Updated Date: Apr 2026 | Product Type: Market Research Report | |
| Publisher: 6Wresearch | No. of Pages: 65 | No. of Figures: 34 | No. of Tables: 19 | |
Estonia Operating Table Market Size (2020-2030)
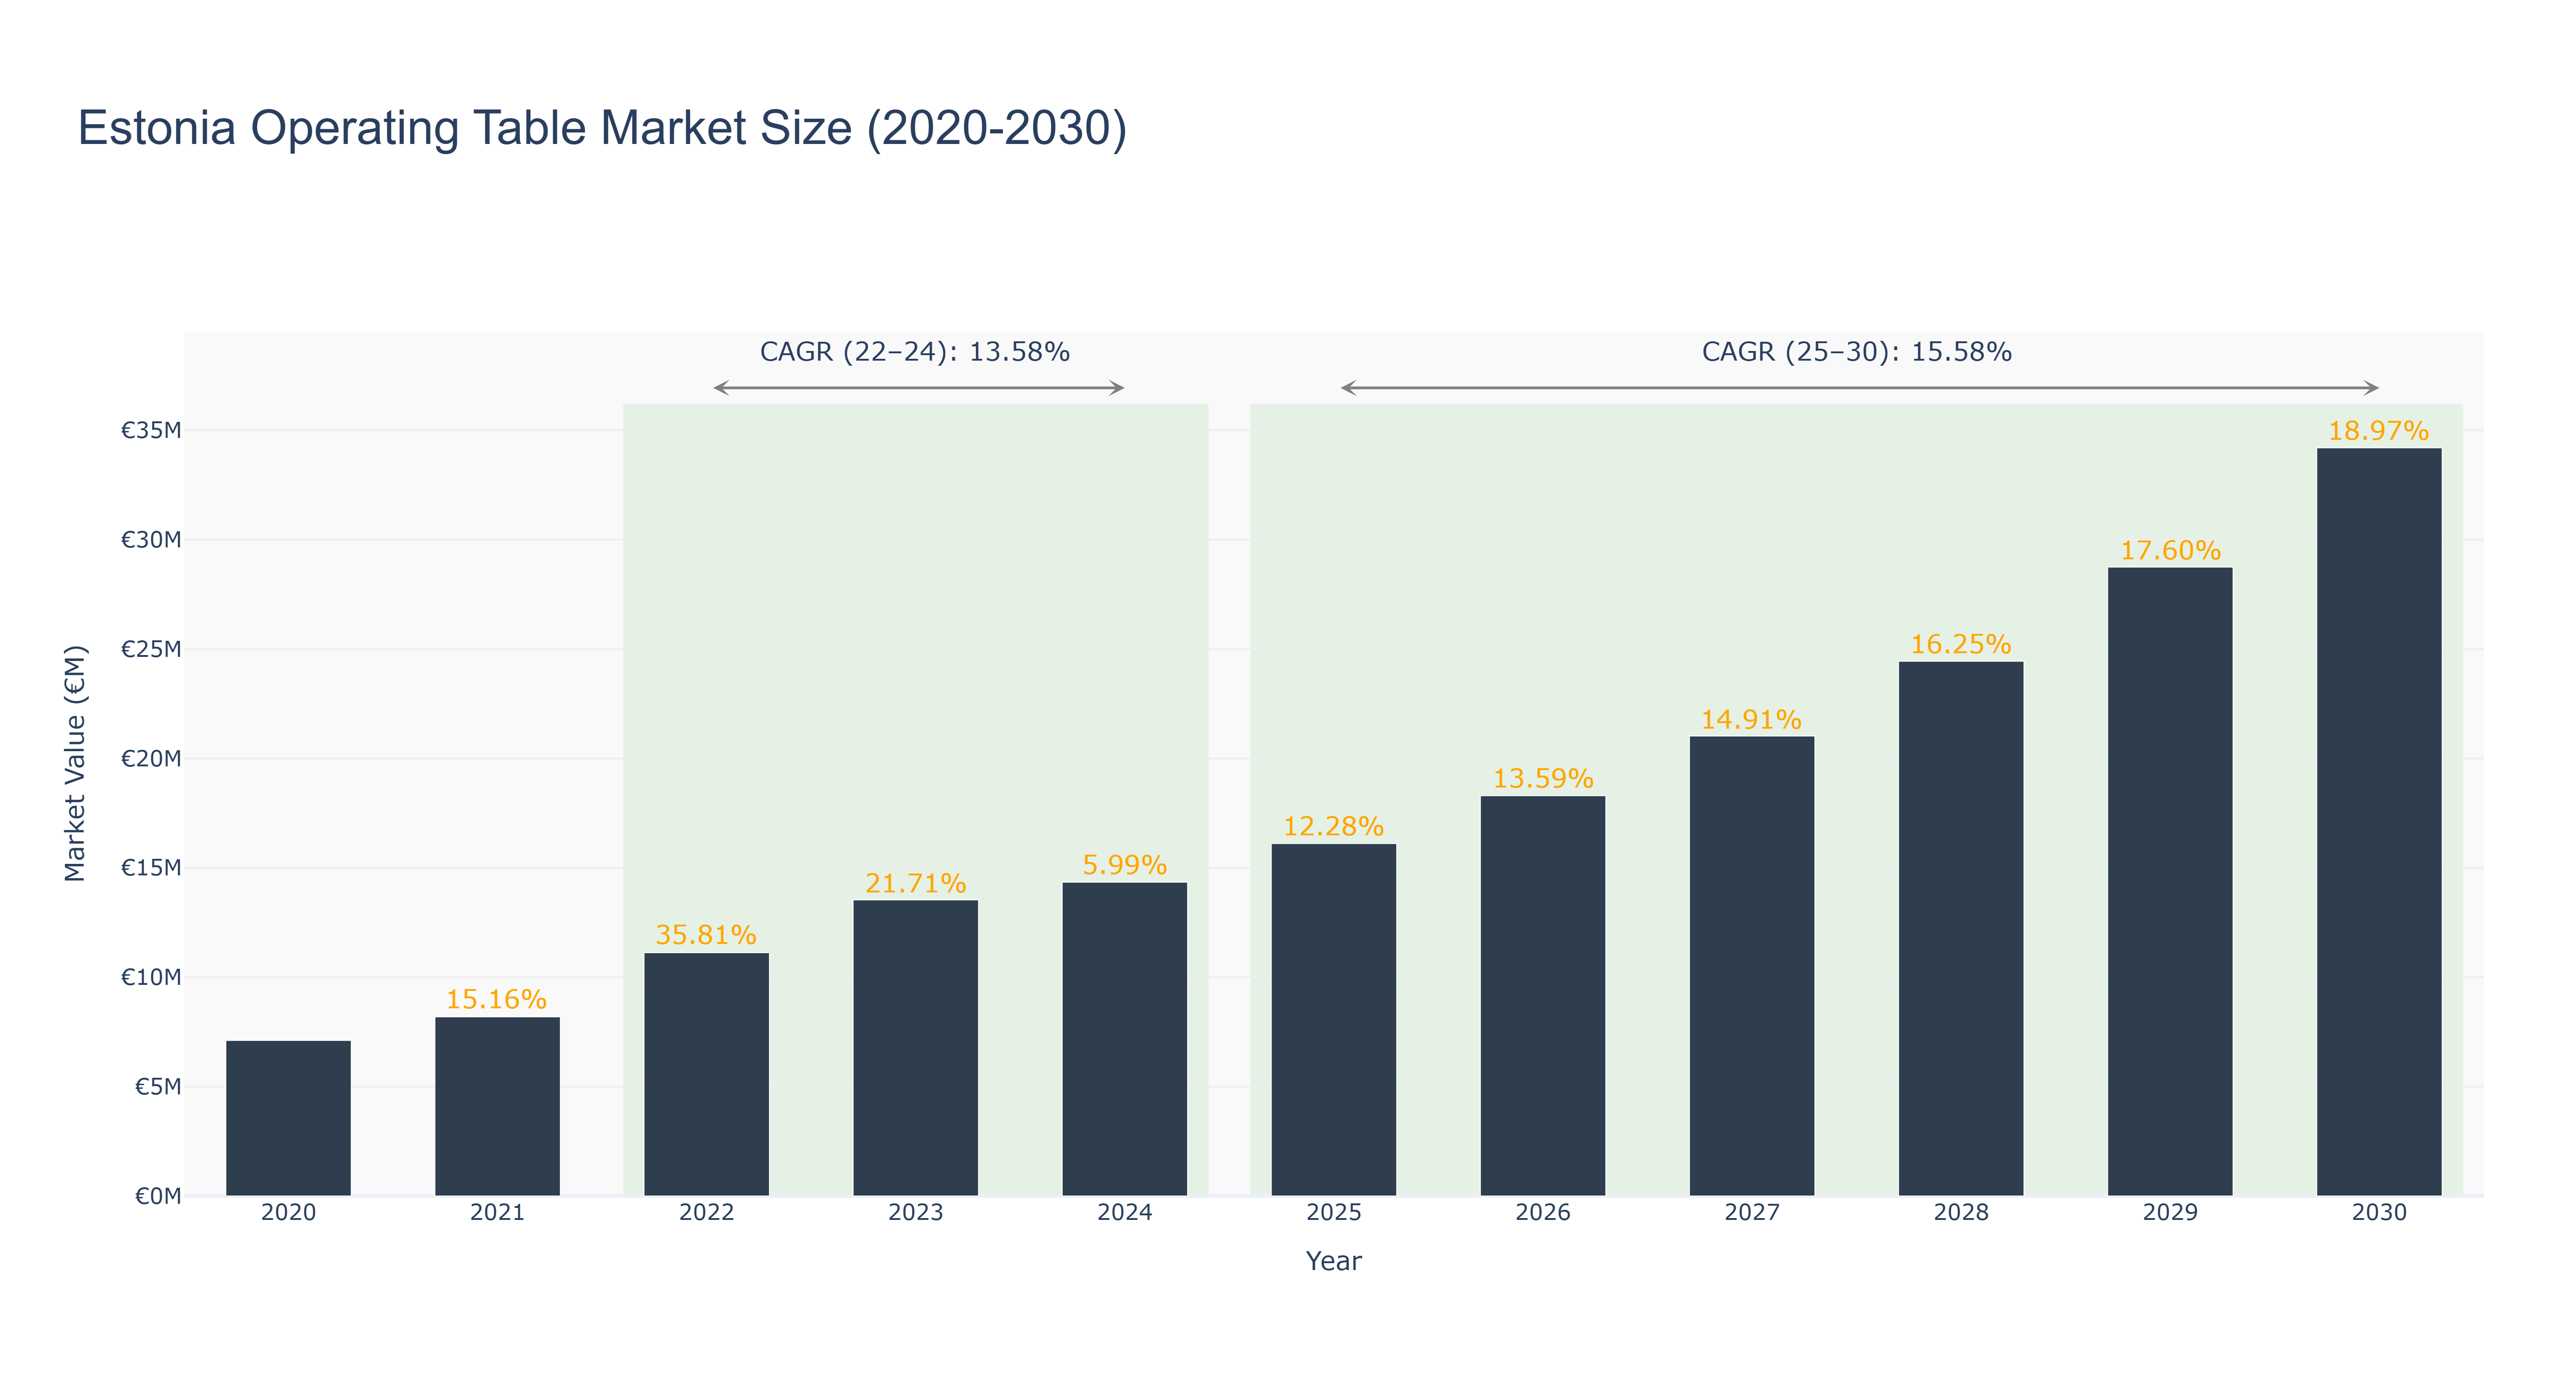
The Estonia Operating Table Market has shown a steady growth trajectory over the years. The peak market size of €34.20 million is forecasted for 2030, reflecting a robust upward trend. The actual market size has seen consistent increases from €7.11 million in 2020 to €14.35 million in 2024, with notable growth rates each year. The CAGR for the period 2022-24 is 13.58%, while for 2025-30, it is projected at 15.58%. Industry drivers such as advancements in healthcare technology and an increasing focus on surgical precision have contributed to this market's expansion. Looking ahead, Estonia is set to witness the introduction of state-of-the-art operating table equipment, aimed at enhancing patient care and surgical outcomes, further fueling market growth.
Estonia Operating Table Market: Production & Trade Performance (2019-2025)
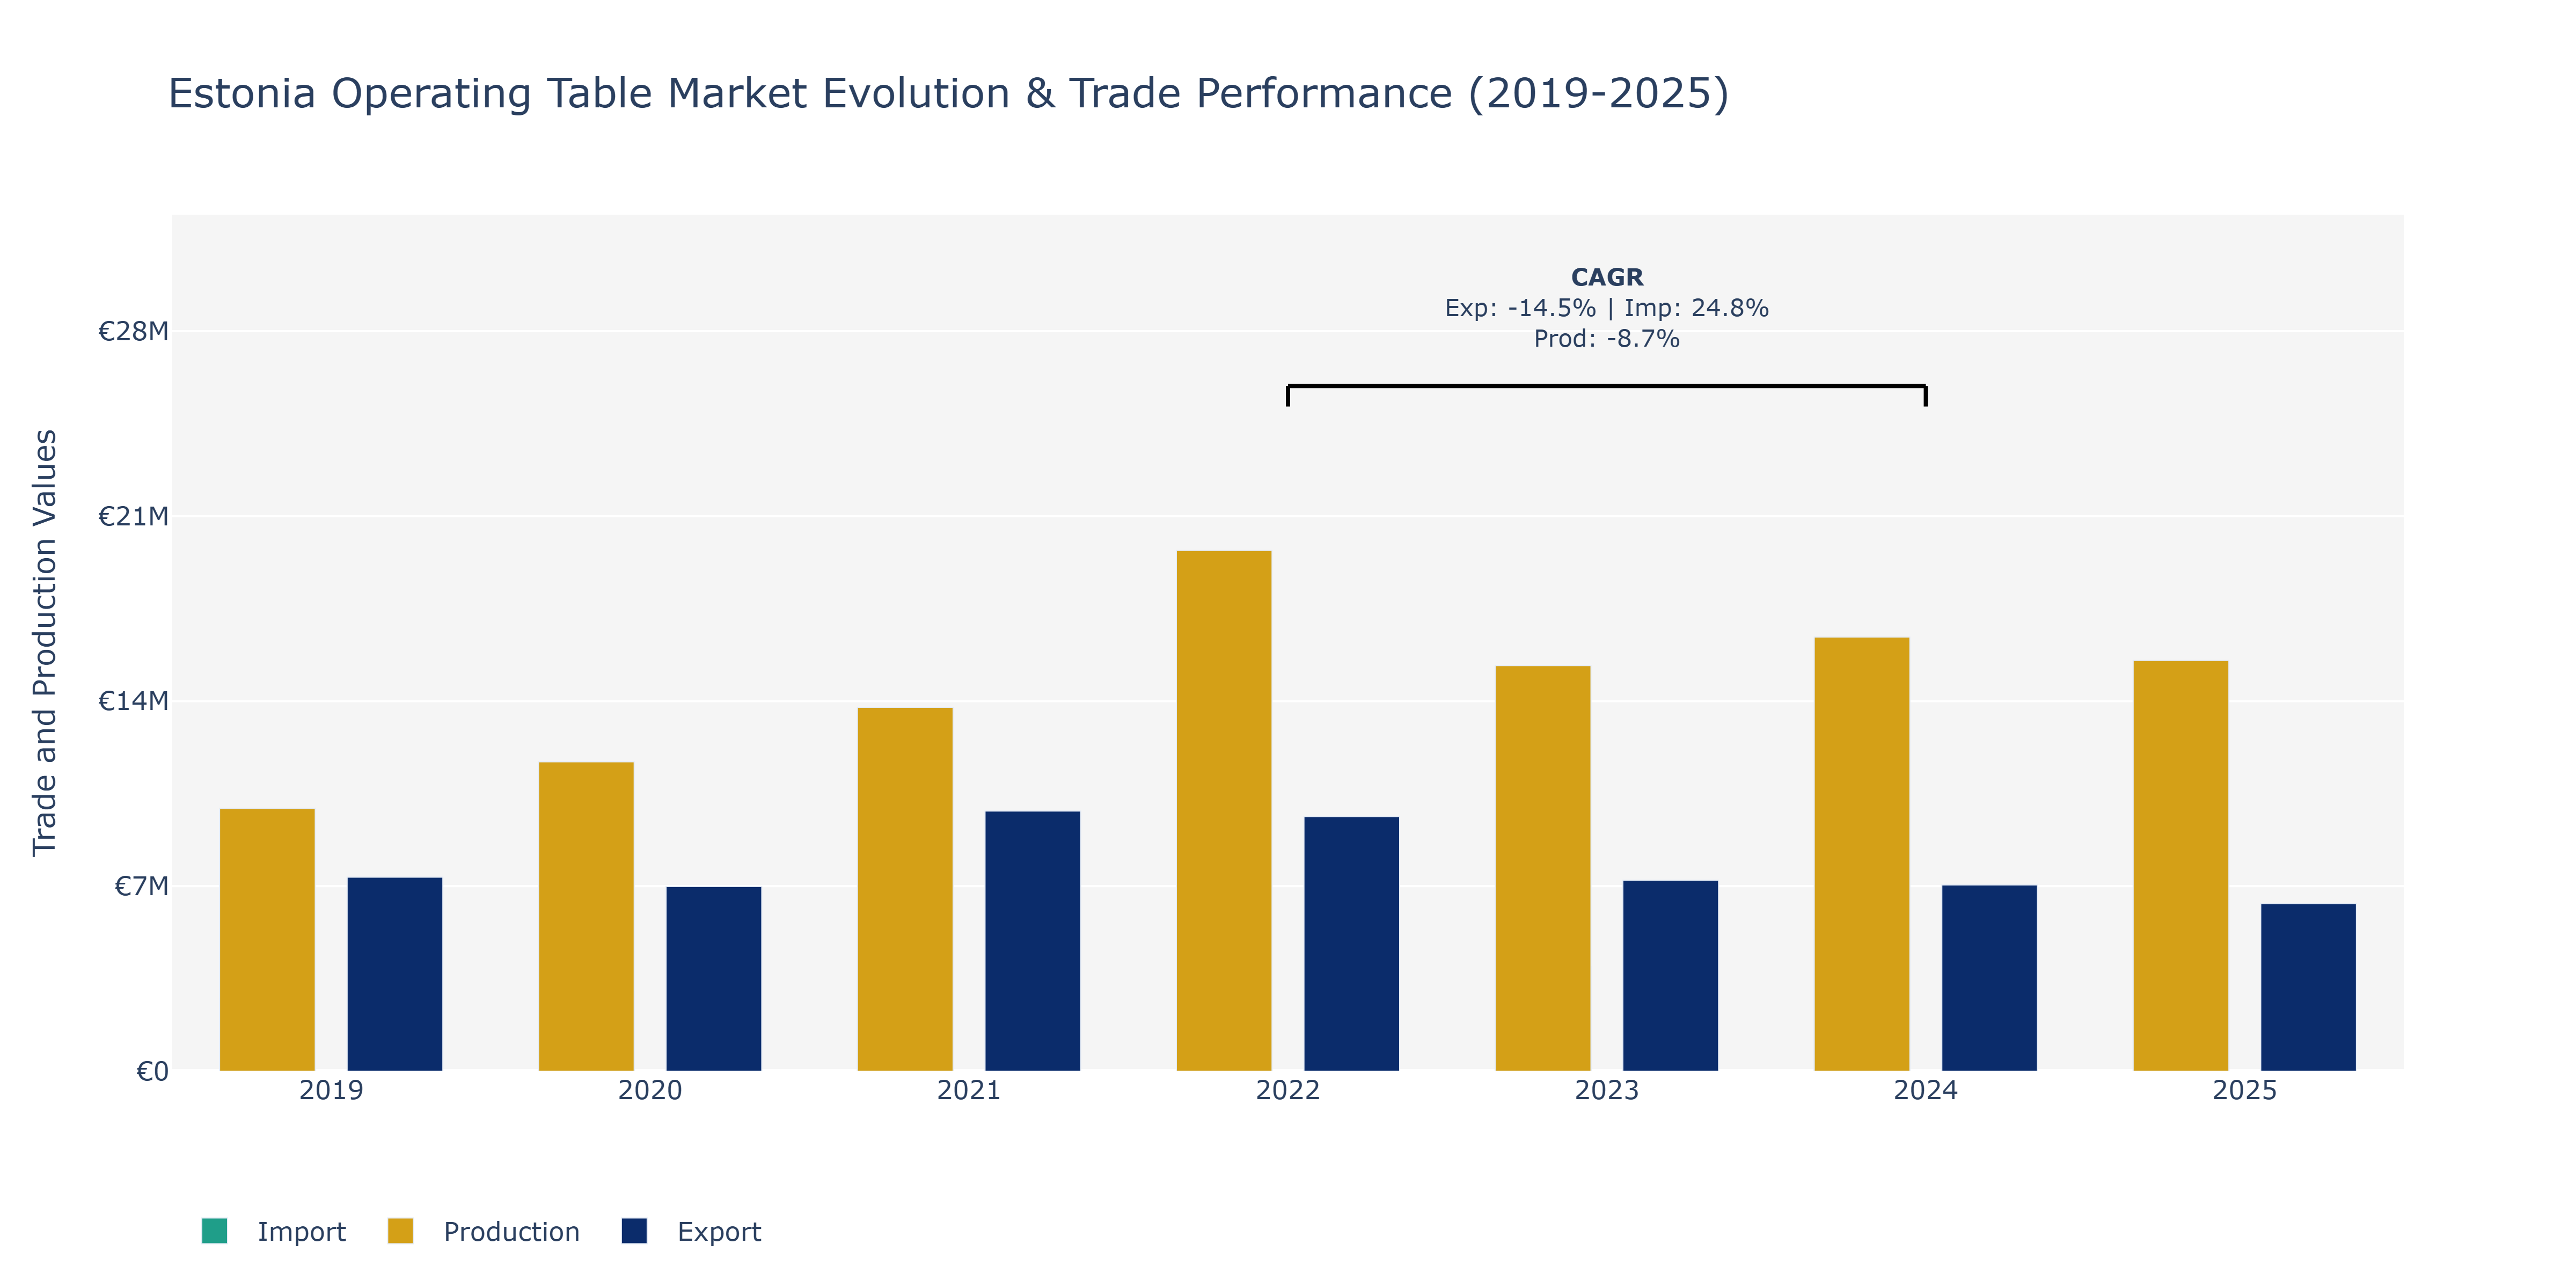
In the Estonia Operating Table Market, from 2019 to 2025, exports saw a downward trend from €7.34 million to €6.34 million. The peak in exports was observed in 2021 at €9.84 million. Imports, on the other hand, increased consistently from €2.73 million in 2019 to €6.5 million in 2025. Notably, there was a substantial spike in imports in 2024 compared to previous years. Production fluctuated over the years, reaching its highest point in 2022 at €19.70 million and decreasing to €15.54 million by 2025. These fluctuations can be attributed to various factors such as changes in demand for medical equipment, technological advancements, and global economic conditions affecting trade patterns. Estonia's strategic geographical location and its focus on healthcare infrastructure development could have influenced the market dynamics during this period.
Key Highlights of the Report:
- Estonia Operating Table Market Outlook
- Market Size of Estonia Operating Table Market, 2025
- Forecast of Estonia Operating Table Market, 2032
- Historical Data and Forecast of Estonia Operating Table Revenues & Volume for the Period 2022 - 2032F
- Estonia Operating Table Market Trend Evolution
- Estonia Operating Table Market Drivers and Challenges
- Estonia Operating Table Price Trends
- Estonia Operating Table Porter's Five Forces
- Estonia Operating Table Industry Life Cycle
- Historical Data and Forecast of Estonia Operating Table Market Revenues & Volume By Type for the Period 2022 - 2032F
- Historical Data and Forecast of Estonia Operating Table Market Revenues & Volume By Electric for the Period 2022 - 2032F
- Historical Data and Forecast of Estonia Operating Table Market Revenues & Volume By Hydraulic for the Period 2022 - 2032F
- Historical Data and Forecast of Estonia Operating Table Market Revenues & Volume By Manual for the Period 2022 - 2032F
- Historical Data and Forecast of Estonia Operating Table Market Revenues & Volume By Adjustable for the Period 2022 - 2032F
- Historical Data and Forecast of Estonia Operating Table Market Revenues & Volume By Material for the Period 2022 - 2032F
- Historical Data and Forecast of Estonia Operating Table Market Revenues & Volume By Stainless Steel for the Period 2022 - 2032F
- Historical Data and Forecast of Estonia Operating Table Market Revenues & Volume By Aluminum for the Period 2022 - 2032F
- Historical Data and Forecast of Estonia Operating Table Market Revenues & Volume By Carbon Fiber for the Period 2022 - 2032F
- Historical Data and Forecast of Estonia Operating Table Market Revenues & Volume By Plastic for the Period 2022 - 2032F
- Historical Data and Forecast of Estonia Operating Table Market Revenues & Volume By Adjustment Mechanism for the Period 2022 - 2032F
- Historical Data and Forecast of Estonia Operating Table Market Revenues & Volume By Manual for the Period 2022 - 2032F
- Historical Data and Forecast of Estonia Operating Table Market Revenues & Volume By Motorized for the Period 2022 - 2032F
- Historical Data and Forecast of Estonia Operating Table Market Revenues & Volume By Pneumatic for the Period 2022 - 2032F
- Historical Data and Forecast of Estonia Operating Table Market Revenues & Volume By Hydraulic for the Period 2022 - 2032F
- Historical Data and Forecast of Estonia Operating Table Market Revenues & Volume By Functionality for the Period 2022 - 2032F
- Historical Data and Forecast of Estonia Operating Table Market Revenues & Volume By Surgical for the Period 2022 - 2032F
- Historical Data and Forecast of Estonia Operating Table Market Revenues & Volume By Orthopedic for the Period 2022 - 2032F
- Historical Data and Forecast of Estonia Operating Table Market Revenues & Volume By ICU for the Period 2022 - 2032F
- Historical Data and Forecast of Estonia Operating Table Market Revenues & Volume By Examination for the Period 2022 - 2032F
- Historical Data and Forecast of Estonia Operating Table Market Revenues & Volume By Weight Capacity for the Period 2022 - 2032F
- Historical Data and Forecast of Estonia Operating Table Market Revenues & Volume By 300kg for the Period 2022 - 2032F
- Historical Data and Forecast of Estonia Operating Table Market Revenues & Volume By 500kg for the Period 2022 - 2032F
- Historical Data and Forecast of Estonia Operating Table Market Revenues & Volume By 700kg for the Period 2022 - 2032F
- Historical Data and Forecast of Estonia Operating Table Market Revenues & Volume By 800kg for the Period 2022 - 2032F
- Estonia Operating Table Import Export Trade Statistics
- Market Opportunity Assessment By Type
- Market Opportunity Assessment By Material
- Market Opportunity Assessment By Adjustment Mechanism
- Market Opportunity Assessment By Functionality
- Market Opportunity Assessment By Weight Capacity
- Estonia Operating Table Top Companies Market Share
- Estonia Operating Table Competitive Benchmarking By Technical and Operational Parameters
- Estonia Operating Table Company Profiles
- Estonia Operating Table Key Strategic Recommendations
Frequently Asked Questions About the Market Study (FAQs):
6Wresearch actively monitors the Estonia Operating Table Market and publishes its comprehensive annual report, highlighting emerging trends, growth drivers, revenue analysis, and forecast outlook. Our insights help businesses to make data-backed strategic decisions with ongoing market dynamics. Our analysts track relevent industries related to the Estonia Operating Table Market, allowing our clients with actionable intelligence and reliable forecasts tailored to emerging regional needs.
Yes, we provide customisation as per your requirements. To learn more, feel free to contact us on sales@6wresearch.com
1 Executive Summary |
2 Introduction |
2.1 Key Highlights of the Report |
2.2 Report Description |
2.3 Market Scope & Segmentation |
2.4 Research Methodology |
2.5 Assumptions |
3 Estonia Operating Table Market Overview |
3.1 Estonia Country Macro Economic Indicators |
3.2 Estonia Operating Table Market Revenues & Volume, 2022 & 2032F |
3.3 Estonia Operating Table Market - Industry Life Cycle |
3.4 Estonia Operating Table Market - Porter's Five Forces |
3.5 Estonia Operating Table Market Revenues & Volume Share, By Type, 2022 & 2032F |
3.6 Estonia Operating Table Market Revenues & Volume Share, By Material, 2022 & 2032F |
3.7 Estonia Operating Table Market Revenues & Volume Share, By Adjustment Mechanism, 2022 & 2032F |
3.8 Estonia Operating Table Market Revenues & Volume Share, By Functionality, 2022 & 2032F |
3.9 Estonia Operating Table Market Revenues & Volume Share, By Weight Capacity, 2022 & 2032F |
4 Estonia Operating Table Market Dynamics |
4.1 Impact Analysis |
4.2 Market Drivers |
4.3 Market Restraints |
5 Estonia Operating Table Market Trends |
6 Estonia Operating Table Market, By Types |
6.1 Estonia Operating Table Market, By Type |
6.1.1 Overview and Analysis |
6.1.2 Estonia Operating Table Market Revenues & Volume, By Type, 2022 - 2032F |
6.1.3 Estonia Operating Table Market Revenues & Volume, By Electric, 2022 - 2032F |
6.1.4 Estonia Operating Table Market Revenues & Volume, By Hydraulic, 2022 - 2032F |
6.1.5 Estonia Operating Table Market Revenues & Volume, By Manual, 2022 - 2032F |
6.1.6 Estonia Operating Table Market Revenues & Volume, By Adjustable, 2022 - 2032F |
6.2 Estonia Operating Table Market, By Material |
6.2.1 Overview and Analysis |
6.2.2 Estonia Operating Table Market Revenues & Volume, By Stainless Steel, 2022 - 2032F |
6.2.3 Estonia Operating Table Market Revenues & Volume, By Aluminum, 2022 - 2032F |
6.2.4 Estonia Operating Table Market Revenues & Volume, By Carbon Fiber, 2022 - 2032F |
6.2.5 Estonia Operating Table Market Revenues & Volume, By Plastic, 2022 - 2032F |
6.3 Estonia Operating Table Market, By Adjustment Mechanism |
6.3.1 Overview and Analysis |
6.3.2 Estonia Operating Table Market Revenues & Volume, By Manual, 2022 - 2032F |
6.3.3 Estonia Operating Table Market Revenues & Volume, By Motorized, 2022 - 2032F |
6.3.4 Estonia Operating Table Market Revenues & Volume, By Pneumatic, 2022 - 2032F |
6.3.5 Estonia Operating Table Market Revenues & Volume, By Hydraulic, 2022 - 2032F |
6.4 Estonia Operating Table Market, By Functionality |
6.4.1 Overview and Analysis |
6.4.2 Estonia Operating Table Market Revenues & Volume, By Surgical, 2022 - 2032F |
6.4.3 Estonia Operating Table Market Revenues & Volume, By Orthopedic, 2022 - 2032F |
6.4.4 Estonia Operating Table Market Revenues & Volume, By ICU, 2022 - 2032F |
6.4.5 Estonia Operating Table Market Revenues & Volume, By Examination, 2022 - 2032F |
6.5 Estonia Operating Table Market, By Weight Capacity |
6.5.1 Overview and Analysis |
6.5.2 Estonia Operating Table Market Revenues & Volume, By 300kg, 2022 - 2032F |
6.5.3 Estonia Operating Table Market Revenues & Volume, By 500kg, 2022 - 2032F |
6.5.4 Estonia Operating Table Market Revenues & Volume, By 700kg, 2022 - 2032F |
6.5.5 Estonia Operating Table Market Revenues & Volume, By 800kg, 2022 - 2032F |
7 Estonia Operating Table Market Import-Export Trade Statistics |
7.1 Estonia Operating Table Market Export to Major Countries |
7.2 Estonia Operating Table Market Imports from Major Countries |
8 Estonia Operating Table Market Key Performance Indicators |
9 Estonia Operating Table Market - Opportunity Assessment |
9.1 Estonia Operating Table Market Opportunity Assessment, By Type, 2022 & 2032F |
9.2 Estonia Operating Table Market Opportunity Assessment, By Material, 2022 & 2032F |
9.3 Estonia Operating Table Market Opportunity Assessment, By Adjustment Mechanism, 2022 & 2032F |
9.4 Estonia Operating Table Market Opportunity Assessment, By Functionality, 2022 & 2032F |
9.5 Estonia Operating Table Market Opportunity Assessment, By Weight Capacity, 2022 & 2032F |
10 Estonia Operating Table Market - Competitive Landscape |
10.1 Estonia Operating Table Market Revenue Share, By Companies, 2025 |
10.2 Estonia Operating Table Market Competitive Benchmarking, By Operating and Technical Parameters |
11 Company Profiles |
12 Recommendations |
13 Disclaimer |
Global Go To Market Strategy - 2030
Export potential enables firms to identify high-growth global markets with greater confidence by combining advanced trade intelligence with a structured quantitative methodology. The framework analyzes emerging demand trends and country-level import patterns while integrating macroeconomic and trade datasets such as GDP and population forecasts, bilateral import–export flows, tariff structures, elasticity differentials between developed and developing economies, geographic distance, and import demand projections. Using weighted trade values from 2020–2024 as the base period to project country-to-country export potential for 2030, these inputs are operationalized through calculated drivers such as gravity model parameters, tariff impact factors, and projected GDP per-capita growth. Through an analysis of hidden potentials, demand hotspots, and market conditions that are most favorable to success, this method enables firms to focus on target countries, maximize returns, and global expansion with data, backed by accuracy.
By factoring in the projected importer demand gap that is currently unmet and could be potential opportunity, it identifies the potential for the Exporter (Country) among 190 countries, against the general trade analysis, which identifies the biggest importer or exporter.
To discover high-growth global markets and optimize your business strategy:
Click Here
Pricing
- Single User License$ 1,995
- Department License$ 2,400
- Site License$ 3,120
- Global License$ 3,795

Leadership Perspectives from Industry Events
Search
Thought Leadership and Analyst Meet


Our Clients
6WResearch In News
- Doha a strategic location for EV manufacturing hub: IPA Qatar
- Demand for luxury TVs surging in the GCC, says Samsung
- Empowering Growth: The Thriving Journey of Bangladesh’s Cable Industry
- Demand for luxury TVs surging in the GCC, says Samsung
- Video call with a traditional healer? Once unthinkable, it’s now common in South Africa
- Intelligent Buildings To Smooth GCC’s Path To Net Zero
Latest Reports
- Cape Verde Portable Hand-Thrown Extinguisher Market (2026-2032)
- Canada Portable Hand-Thrown Extinguisher Market (2026-2032)
- Cameroon Portable Hand-Thrown Extinguisher Market (2026-2032)
- Burundi Portable Hand-Thrown Extinguisher Market (2026-2032)
- Burkina Faso Portable Hand-Thrown Extinguisher Market (2026-2032)
- Bulgaria Portable Hand-Thrown Extinguisher Market (2026-2032)
- Brunei Portable Hand-Thrown Extinguisher Market (2026-2032)
- Botswana Portable Hand-Thrown Extinguisher Market (2026-2032)
- Bosnia and Herzegovina Portable Hand-Thrown Extinguisher Market (2026-2032)
- Bolivia Portable Hand-Thrown Extinguisher Market (2026-2032)
Industry Events and Analyst Meet

HIMTEX 2026

India Refining Summit 2026

India EV Show 2026

EV tech India Expo 2026

Auto Tech Asia 2026
Whitepaper
- Middle East & Africa Commercial Security Market Click here to view more.
- Middle East & Africa Fire Safety Systems & Equipment Market Click here to view more.
- GCC Drone Market Click here to view more.
- Middle East Lighting Fixture Market Click here to view more.
- GCC Physical & Perimeter Security Market Click here to view more.