Estonia Protective Clothing Market (2025-2031) | Trends, Analysis, Value, Outlook, Industry, Size, Segmentation, Growth, Revenue, Share, Forecast & Companies
Market Forecast By Material Type (Aramid & Blends, Polyolefins & Blends, Polyamide, Pbi, Uhmw Pe, Cotton Fibers, Laminated Polyesters, Others), By Application (Thermal, Chemical, Mechanical, Biological/radiation, Visibility, Others), By End-use (Oil & Gas, Construction, Manufacturing, Healthcare/medical, Firefighting & Law Enforcement, Mining, Military, Warehouse & Logistics) And Competitive Landscape
| Product Code: ETC5148196 | Publication Date: Nov 2023 | Updated Date: Nov 2025 | Product Type: Market Research Report | |
| Publisher: 6Wresearch | Author: Bhawna Singh | No. of Pages: 60 | No. of Figures: 30 | No. of Tables: 5 |
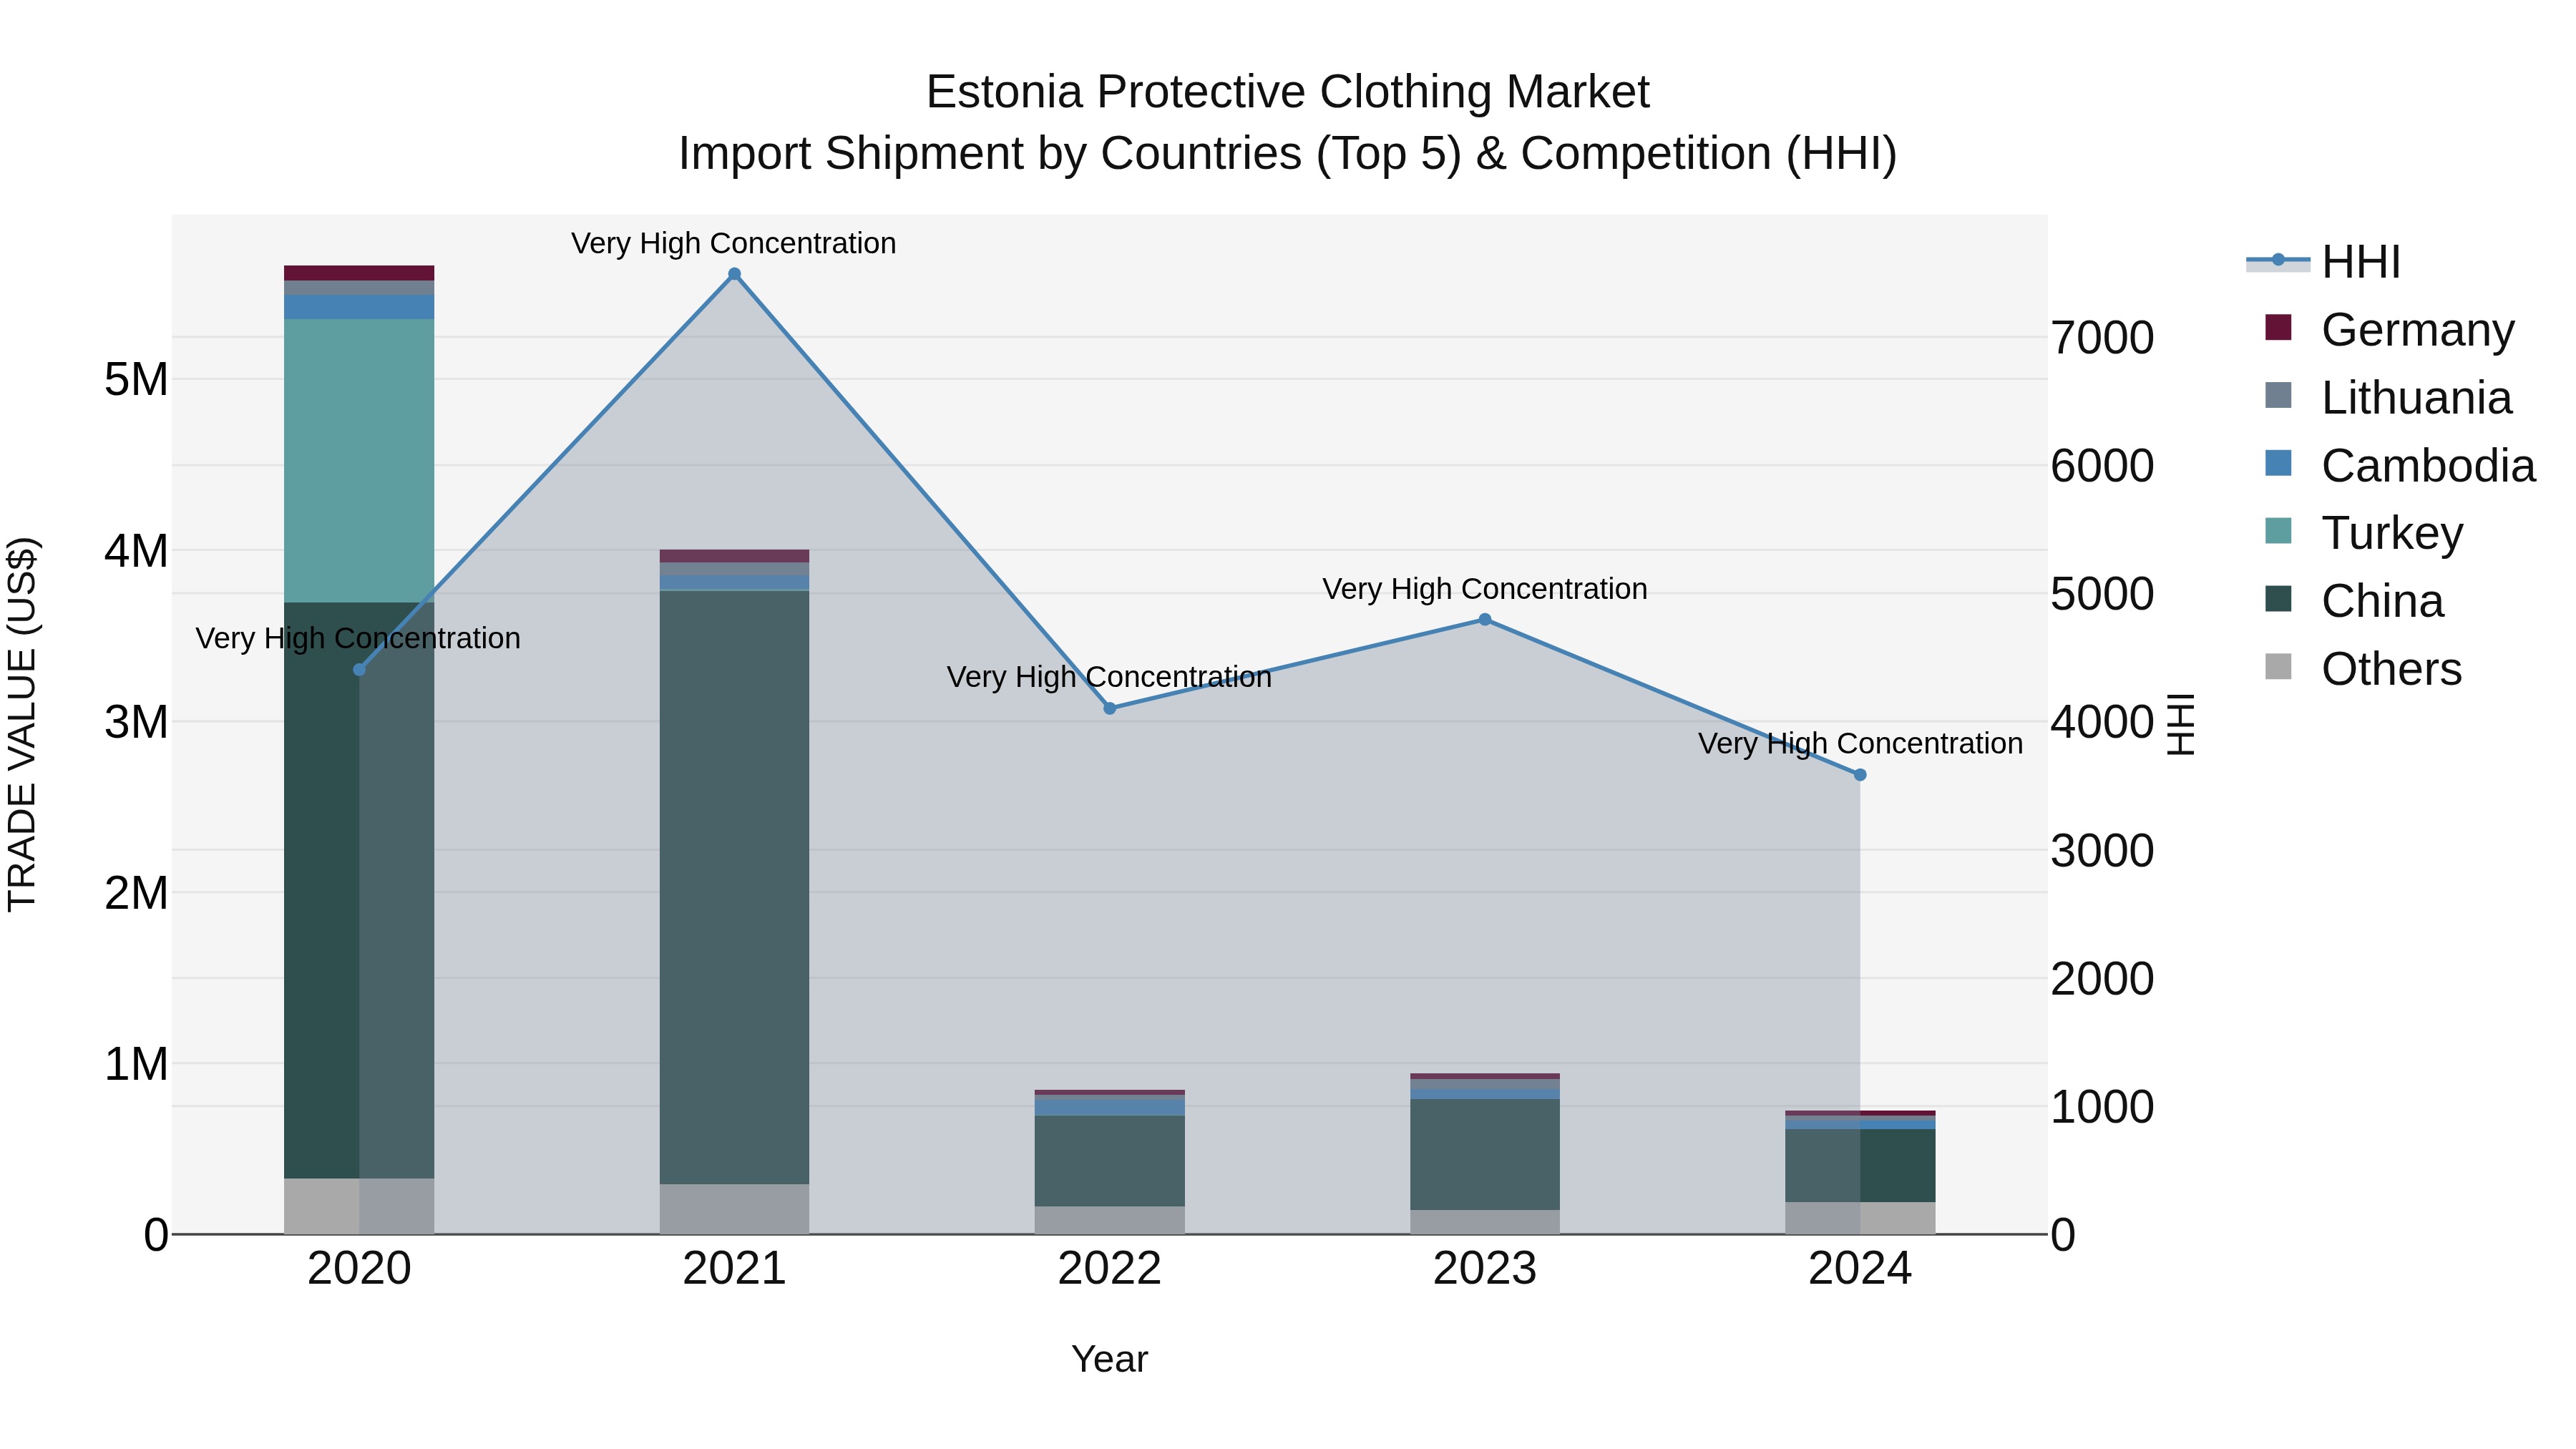
Estonia Protective Clothing Market Top 5 Importing Countries and Market Competition (HHI) Analysis
The import shipments of protective clothing into Estonia in 2024 saw significant contributions from top exporting countries including China, Cambodia, Vietnam, Germany, and Lithuania. Despite a high Herfindahl-Hirschman Index (HHI) indicating concentration, the Compound Annual Growth Rate (CAGR) for the period 2020-2024 was notably negative at -40.23%. Moreover, the growth rate from 2023 to 2024 declined by -23.13%, suggesting a challenging market landscape. Monitoring these trends and exploring strategies to stimulate growth will be crucial for stakeholders in the protective clothing import industry in Estonia.
Estonia Protective Clothing Market Overview
The protective clothing market in Estonia has experienced significant growth, particularly due to increasing awareness of health and safety standards in workplaces and hazardous environments. Industries such as construction, manufacturing, and healthcare are key consumers of protective clothing, including flame-resistant garments, chemical protective suits, and high-visibility clothing. The growing emphasis on worker safety and compliance with European Union regulations has led to the increased adoption of advanced protective gear in Estonias workforce.
Drivers of the market
The protective clothing market in Estonia is driven by heightened awareness of safety standards across various industries, including construction, healthcare, and manufacturing. Strict regulations regarding worker safety and the increasing number of industrial activities have spurred demand for high-quality protective gear. Innovations in materials, such as fabrics that offer enhanced protection against heat, chemicals, and electrical hazards, are also propelling the market forward.
Challenges of the market
The protective clothing market in Estonia faces challenges related to the rapidly evolving safety standards, which require manufacturers to keep up with stringent regulations and technological advancements in fabric materials. Additionally, the market is highly competitive, with global brands offering a wide range of products, making it difficult for local producers to differentiate themselves. Rising material costs and the need for continuous innovation to meet diverse industry requirements, such as chemical protection and fire resistance, also complicate production and pricing strategies.
Government Policy of the market
The Estonian government actively supports the protective clothing sector, especially in the context of workplace safety regulations. Subsidies and grants are available for manufacturers meeting quality and safety benchmarks, and export-oriented policies aim to strengthen Estonia`s position in EU markets.
Key Highlights of the Report:
- Estonia Protective Clothing Market Outlook
- Market Size of Estonia Protective Clothing Market, 2024
- Forecast of Estonia Protective Clothing Market, 2031
- Historical Data and Forecast of Estonia Protective Clothing Revenues & Volume for the Period 2021-2031
- Estonia Protective Clothing Market Trend Evolution
- Estonia Protective Clothing Market Drivers and Challenges
- Estonia Protective Clothing Price Trends
- Estonia Protective Clothing Porter`s Five Forces
- Estonia Protective Clothing Industry Life Cycle
- Historical Data and Forecast of Estonia Protective Clothing Market Revenues & Volume By Material Type for the Period 2021-2031
- Historical Data and Forecast of Estonia Protective Clothing Market Revenues & Volume By Aramid & Blends for the Period 2021-2031
- Historical Data and Forecast of Estonia Protective Clothing Market Revenues & Volume By Polyolefins & Blends for the Period 2021-2031
- Historical Data and Forecast of Estonia Protective Clothing Market Revenues & Volume By Polyamide for the Period 2021-2031
- Historical Data and Forecast of Estonia Protective Clothing Market Revenues & Volume By Pbi for the Period 2021-2031
- Historical Data and Forecast of Estonia Protective Clothing Market Revenues & Volume By Uhmw Pe for the Period 2021-2031
- Historical Data and Forecast of Estonia Protective Clothing Market Revenues & Volume By Cotton Fibers for the Period 2021-2031
- Historical Data and Forecast of Estonia Protective Clothing Market Revenues & Volume By Laminated Polyesters for the Period 2021-2031
- Historical Data and Forecast of Estonia Aramid & Blends Protective Clothing Market Revenues & Volume By Others for the Period 2021-2031
- Historical Data and Forecast of Estonia Protective Clothing Market Revenues & Volume By Application for the Period 2021-2031
- Historical Data and Forecast of Estonia Protective Clothing Market Revenues & Volume By Thermal for the Period 2021-2031
- Historical Data and Forecast of Estonia Protective Clothing Market Revenues & Volume By Chemical for the Period 2021-2031
- Historical Data and Forecast of Estonia Protective Clothing Market Revenues & Volume By Mechanical for the Period 2021-2031
- Historical Data and Forecast of Estonia Protective Clothing Market Revenues & Volume By Biological/radiation for the Period 2021-2031
- Historical Data and Forecast of Estonia Protective Clothing Market Revenues & Volume By Visibility for the Period 2021-2031
- Historical Data and Forecast of Estonia Protective Clothing Market Revenues & Volume By Others for the Period 2021-2031
- Historical Data and Forecast of Estonia Protective Clothing Market Revenues & Volume By End-use for the Period 2021-2031
- Historical Data and Forecast of Estonia Protective Clothing Market Revenues & Volume By Oil & Gas for the Period 2021-2031
- Historical Data and Forecast of Estonia Protective Clothing Market Revenues & Volume By Construction for the Period 2021-2031
- Historical Data and Forecast of Estonia Protective Clothing Market Revenues & Volume By Manufacturing for the Period 2021-2031
- Historical Data and Forecast of Estonia Protective Clothing Market Revenues & Volume By Healthcare/medical for the Period 2021-2031
- Historical Data and Forecast of Estonia Protective Clothing Market Revenues & Volume By Firefighting & Law Enforcement for the Period 2021-2031
- Historical Data and Forecast of Estonia Protective Clothing Market Revenues & Volume By Mining for the Period 2021-2031
- Historical Data and Forecast of Estonia Protective Clothing Market Revenues & Volume By Military for the Period 2021-2031
- Historical Data and Forecast of Estonia Protective Clothing Market Revenues & Volume By Warehouse & Logistics for the Period 2021-2031
- Estonia Protective Clothing Import Export Trade Statistics
- Market Opportunity Assessment By Material Type
- Market Opportunity Assessment By Application
- Market Opportunity Assessment By End-use
- Estonia Protective Clothing Top Companies Market Share
- Estonia Protective Clothing Competitive Benchmarking By Technical and Operational Parameters
- Estonia Protective Clothing Company Profiles
- Estonia Protective Clothing Key Strategic Recommendations
Frequently Asked Questions About the Market Study (FAQs):
6Wresearch actively monitors the Estonia Protective Clothing Market and publishes its comprehensive annual report, highlighting emerging trends, growth drivers, revenue analysis, and forecast outlook. Our insights help businesses to make data-backed strategic decisions with ongoing market dynamics. Our analysts track relevent industries related to the Estonia Protective Clothing Market, allowing our clients with actionable intelligence and reliable forecasts tailored to emerging regional needs.
Yes, we provide customisation as per your requirements. To learn more, feel free to contact us on sales@6wresearch.com
1 Executive Summary |
2 Introduction |
2.1 Key Highlights of the Report |
2.2 Report Description |
2.3 Market Scope & Segmentation |
2.4 Research Methodology |
2.5 Assumptions |
3 Estonia Protective Clothing Market Overview |
3.1 Estonia Country Macro Economic Indicators |
3.2 Estonia Protective Clothing Market Revenues & Volume, 2021 & 2031F |
3.3 Estonia Protective Clothing Market - Industry Life Cycle |
3.4 Estonia Protective Clothing Market - Porter's Five Forces |
3.5 Estonia Protective Clothing Market Revenues & Volume Share, By Material Type, 2021 & 2031F |
3.6 Estonia Protective Clothing Market Revenues & Volume Share, By Application, 2021 & 2031F |
3.7 Estonia Protective Clothing Market Revenues & Volume Share, By End-use, 2021 & 2031F |
4 Estonia Protective Clothing Market Dynamics |
4.1 Impact Analysis |
4.2 Market Drivers |
4.2.1 Stringent workplace safety regulations in Estonia |
4.2.2 Increasing awareness about the importance of personal protective equipment (PPE) |
4.2.3 Growth in sectors such as manufacturing, construction, and healthcare that require protective clothing |
4.3 Market Restraints |
4.3.1 High initial costs associated with specialized protective clothing |
4.3.2 Limited availability of advanced technology in protective clothing manufacturing in Estonia |
5 Estonia Protective Clothing Market Trends |
6 Estonia Protective Clothing Market Segmentations |
6.1 Estonia Protective Clothing Market, By Material Type |
6.1.1 Overview and Analysis |
6.1.2 Estonia Protective Clothing Market Revenues & Volume, By Aramid & Blends, 2021-2031F |
6.1.3 Estonia Protective Clothing Market Revenues & Volume, By Polyolefins & Blends, 2021-2031F |
6.1.4 Estonia Protective Clothing Market Revenues & Volume, By Polyamide, 2021-2031F |
6.1.5 Estonia Protective Clothing Market Revenues & Volume, By Pbi, 2021-2031F |
6.1.6 Estonia Protective Clothing Market Revenues & Volume, By Uhmw Pe, 2021-2031F |
6.1.7 Estonia Protective Clothing Market Revenues & Volume, By Cotton Fibers, 2021-2031F |
6.1.9 Estonia Protective Clothing Market Revenues & Volume, By Others, 2021-2031F |
6.1.10 Estonia Protective Clothing Market Revenues & Volume, By Others, 2021-2031F |
6.2 Estonia Protective Clothing Market, By Application |
6.2.1 Overview and Analysis |
6.2.2 Estonia Protective Clothing Market Revenues & Volume, By Thermal, 2021-2031F |
6.2.3 Estonia Protective Clothing Market Revenues & Volume, By Chemical, 2021-2031F |
6.2.4 Estonia Protective Clothing Market Revenues & Volume, By Mechanical, 2021-2031F |
6.2.5 Estonia Protective Clothing Market Revenues & Volume, By Biological/radiation, 2021-2031F |
6.2.6 Estonia Protective Clothing Market Revenues & Volume, By Visibility, 2021-2031F |
6.2.7 Estonia Protective Clothing Market Revenues & Volume, By Others, 2021-2031F |
6.3 Estonia Protective Clothing Market, By End-use |
6.3.1 Overview and Analysis |
6.3.2 Estonia Protective Clothing Market Revenues & Volume, By Oil & Gas, 2021-2031F |
6.3.3 Estonia Protective Clothing Market Revenues & Volume, By Construction, 2021-2031F |
6.3.4 Estonia Protective Clothing Market Revenues & Volume, By Manufacturing, 2021-2031F |
6.3.5 Estonia Protective Clothing Market Revenues & Volume, By Healthcare/medical, 2021-2031F |
6.3.6 Estonia Protective Clothing Market Revenues & Volume, By Firefighting & Law Enforcement, 2021-2031F |
6.3.7 Estonia Protective Clothing Market Revenues & Volume, By Mining, 2021-2031F |
6.3.8 Estonia Protective Clothing Market Revenues & Volume, By Warehouse & Logistics, 2021-2031F |
6.3.9 Estonia Protective Clothing Market Revenues & Volume, By Warehouse & Logistics, 2021-2031F |
6.3.10 Estonia Protective Clothing Market Revenues & Volume, By Others, 2021-2031F |
7 Estonia Protective Clothing Market Import-Export Trade Statistics |
7.1 Estonia Protective Clothing Market Export to Major Countries |
7.2 Estonia Protective Clothing Market Imports from Major Countries |
8 Estonia Protective Clothing Market Key Performance Indicators |
8.1 Number of workplace accidents reported annually |
8.2 Percentage of companies in high-risk industries compliant with PPE regulations |
8.3 Investment in research and development for innovative protective clothing materials and designs |
9 Estonia Protective Clothing Market - Opportunity Assessment |
9.1 Estonia Protective Clothing Market Opportunity Assessment, By Material Type, 2021 & 2031F |
9.2 Estonia Protective Clothing Market Opportunity Assessment, By Application, 2021 & 2031F |
9.3 Estonia Protective Clothing Market Opportunity Assessment, By End-use, 2021 & 2031F |
10 Estonia Protective Clothing Market - Competitive Landscape |
10.1 Estonia Protective Clothing Market Revenue Share, By Companies, 2024 |
10.2 Estonia Protective Clothing Market Competitive Benchmarking, By Operating and Technical Parameters |
11 Company Profiles |
12 Recommendations | 13 Disclaimer |
Global Go To Market Strategy - 2030
Export potential enables firms to identify high-growth global markets with greater confidence by combining advanced trade intelligence with a structured quantitative methodology. The framework analyzes emerging demand trends and country-level import patterns while integrating macroeconomic and trade datasets such as GDP and population forecasts, bilateral import–export flows, tariff structures, elasticity differentials between developed and developing economies, geographic distance, and import demand projections. Using weighted trade values from 2020–2024 as the base period to project country-to-country export potential for 2030, these inputs are operationalized through calculated drivers such as gravity model parameters, tariff impact factors, and projected GDP per-capita growth. Through an analysis of hidden potentials, demand hotspots, and market conditions that are most favorable to success, this method enables firms to focus on target countries, maximize returns, and global expansion with data, backed by accuracy.
By factoring in the projected importer demand gap that is currently unmet and could be potential opportunity, it identifies the potential for the Exporter (Country) among 190 countries, against the general trade analysis, which identifies the biggest importer or exporter.
To discover high-growth global markets and optimize your business strategy:
Click Here
Pricing
- Single User License$ 1,995
- Department License$ 2,400
- Site License$ 3,120
- Global License$ 3,795

Leadership Perspectives from Industry Events
Search
Thought Leadership and Analyst Meet


Our Clients
6WResearch In News
- India Export Attractiveness Tracker 2026
- India Air Conditioner Market Set for Strong Rebound in 2026 After Weather-Led Correction and GST-Driven Recovery: 6Wresearch
- ADAS in India: How Automatic Emergency Braking, Blind Spot Detection & Driver Monitoring are Transforming Road Safety
- Doha a strategic location for EV manufacturing hub: IPA Qatar
- Demand for luxury TVs surging in the GCC, says Samsung
- Empowering Growth: The Thriving Journey of Bangladesh’s Cable Industry
Latest Reports
- Nicaragua RPG Gaming Market (2026-2032)
- New Zealand RPG Gaming Market (2026-2032)
- Netherlands RPG Gaming Market (2026-2032)
- Nauru RPG Gaming Market (2026-2032)
- Namibia RPG Gaming Market (2026-2032)
- Mozambique RPG Gaming Market (2026-2032)
- Montenegro RPG Gaming Market (2026-2032)
- Mongolia RPG Gaming Market (2026-2032)
- Monaco RPG Gaming Market (2026-2032)
- Micronesia RPG Gaming Market (2026-2032)
Industry Events and Analyst Meet

EV India Expo 2026

HIMTEX 2026

India Refining Summit 2026

India EV Show 2026

EV tech India Expo 2026
Whitepaper
- Middle East & Africa Commercial Security Market Click here to view more.
- Middle East & Africa Fire Safety Systems & Equipment Market Click here to view more.
- GCC Drone Market Click here to view more.
- Middle East Lighting Fixture Market Click here to view more.
- GCC Physical & Perimeter Security Market Click here to view more.