Estonia Vitamin K Market (2025-2031) | Industry, Analysis, Trends, Outlook, Companies, Value, Revenue, Forecast, Growth, Size, Segmentation & Share
Market Forecast By Type (Vitamin K1, Vitamin K2), By Application (Osteoporosis, Vitamin-K Dependent Clotting Factor Deficiency, Prothrombin Deficiency, Vitamin K Deficiency Bleeding, Dermal Applications), By Route of Administration (Oral, Parenteral, Topical) And Competitive Landscape
| Product Code: ETC5330539 | Publication Date: Nov 2023 | Updated Date: Nov 2025 | Product Type: Market Research Report | |
| Publisher: 6Wresearch | Author: Bhawna Singh | No. of Pages: 60 | No. of Figures: 30 | No. of Tables: 5 |
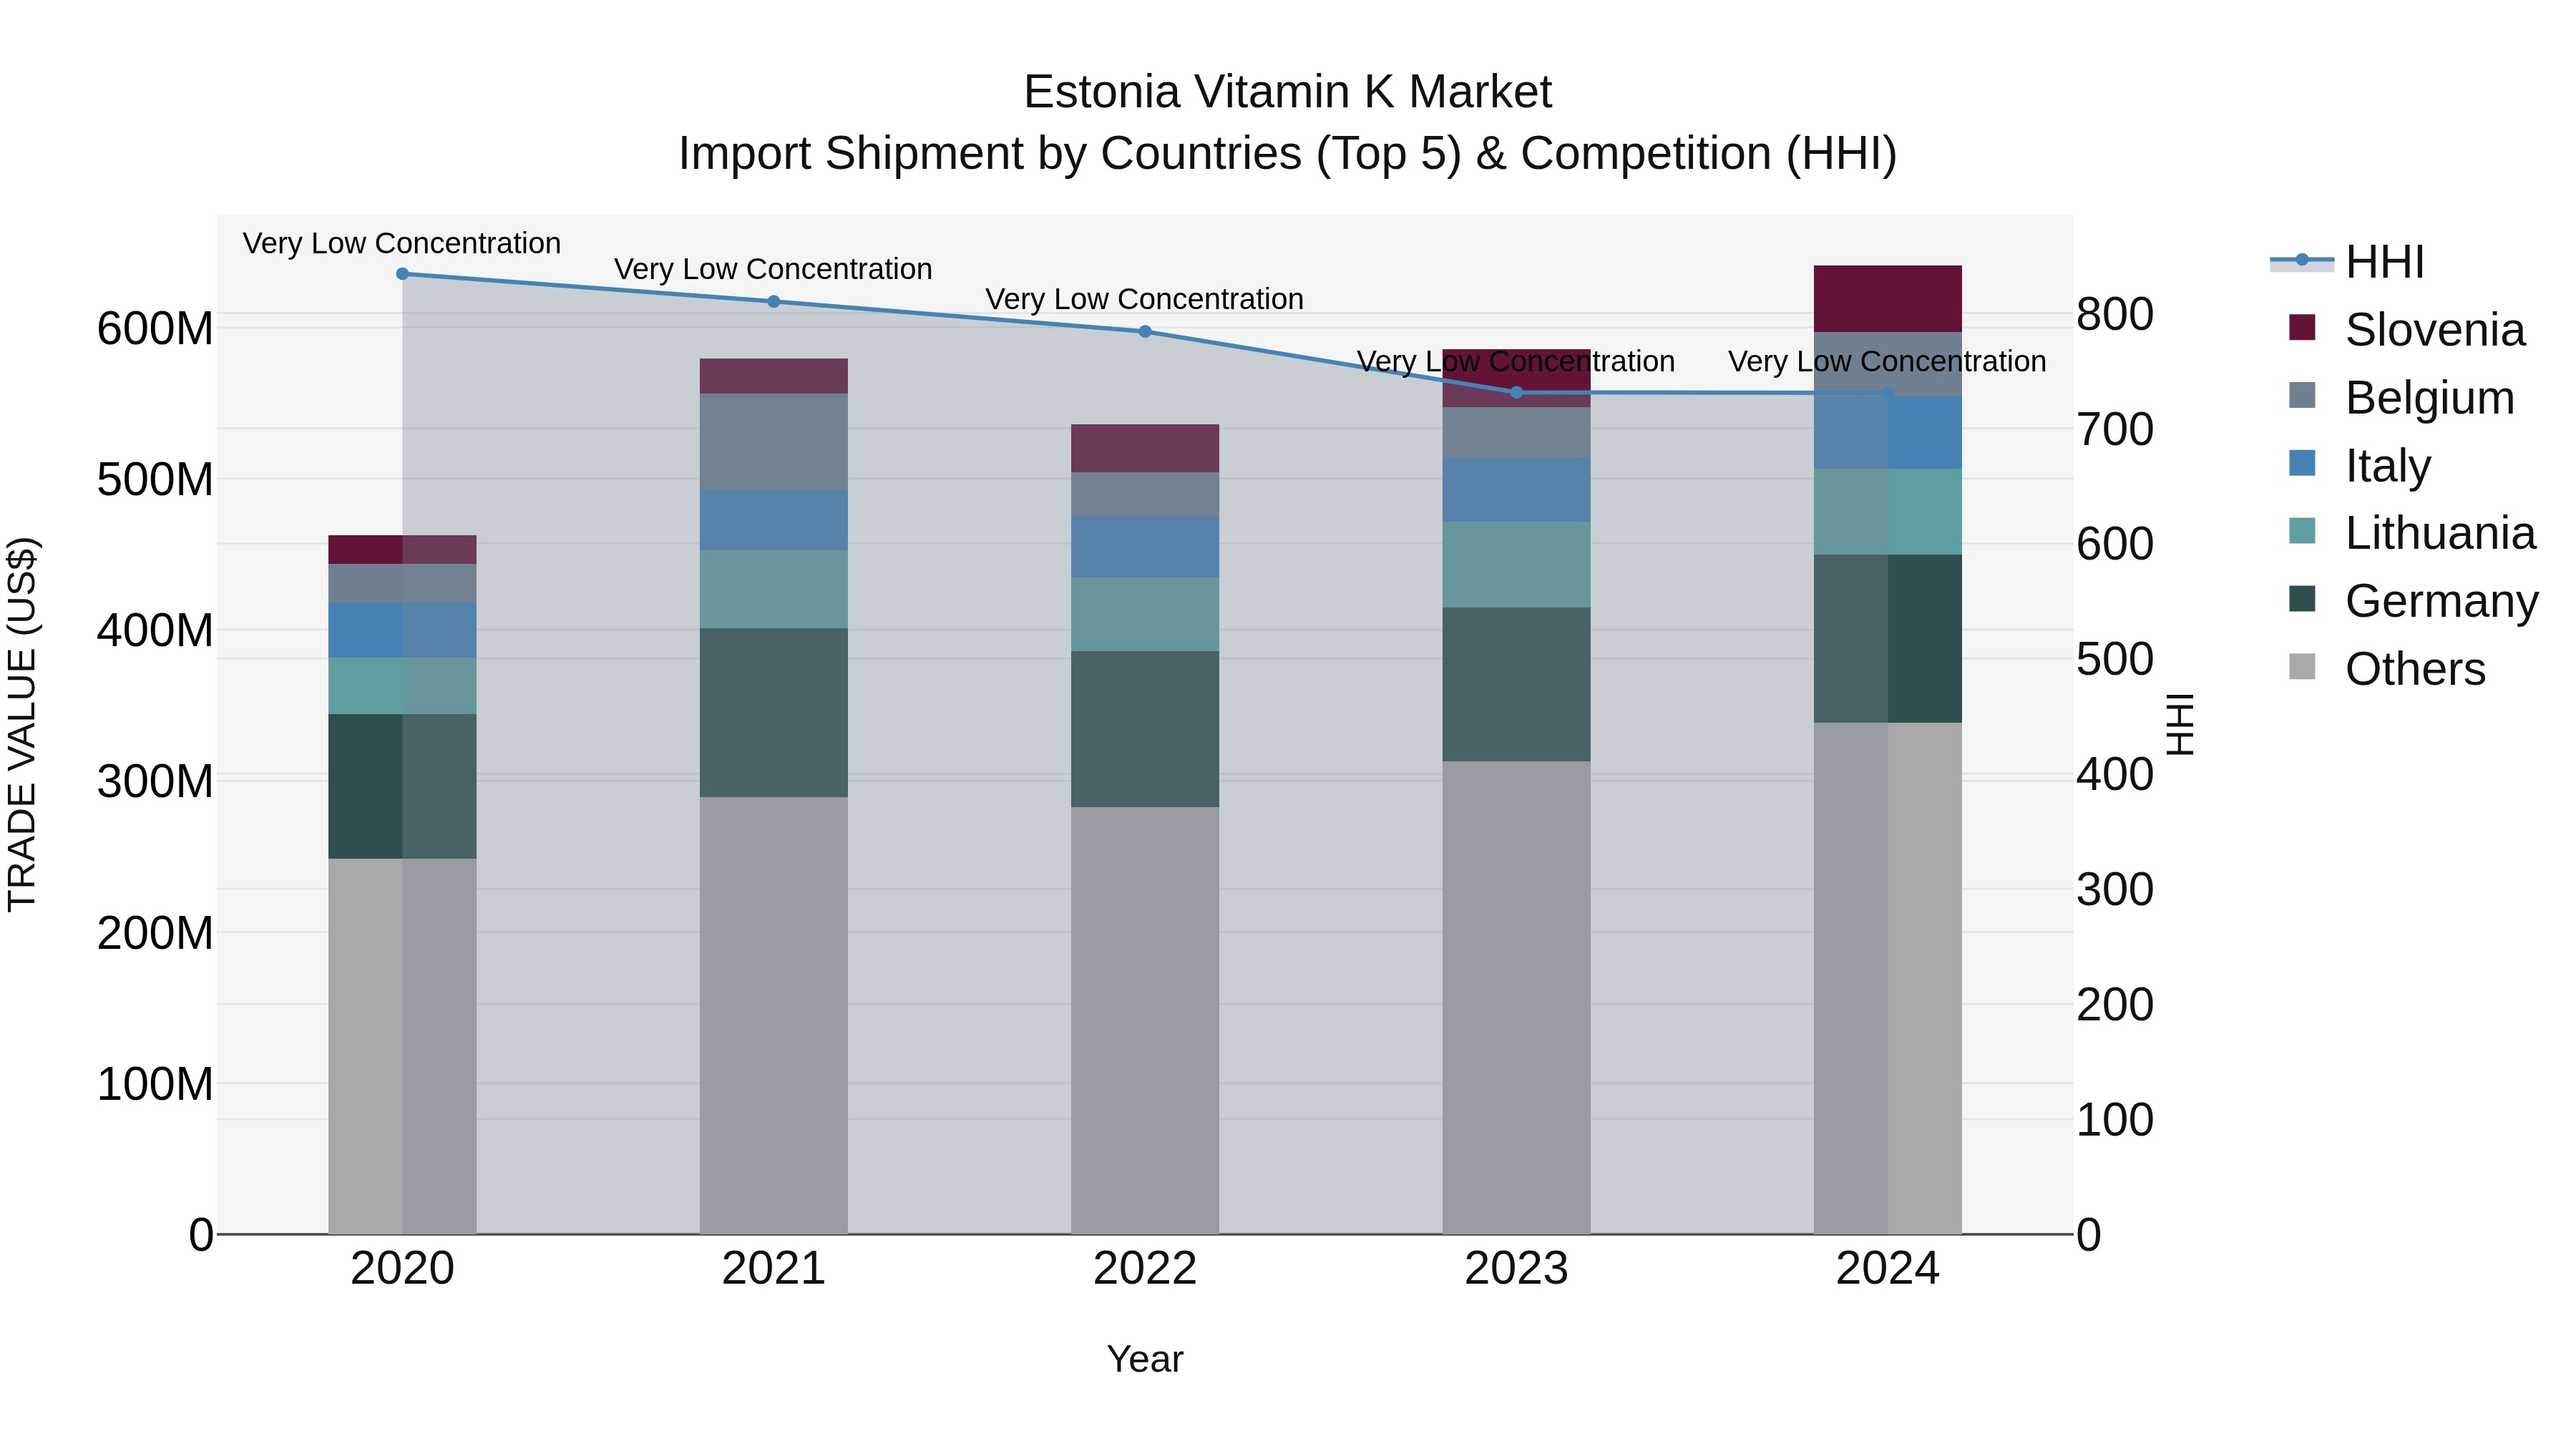
Estonia Vitamin K Market Top 5 Importing Countries and Market Competition (HHI) Analysis
Estonia`s vitamin K import market saw steady growth in 2024, with top suppliers being Germany, Lithuania, Italy, Slovenia, and Belgium. The market remained fairly competitive with low concentration, indicating a diverse range of sources. The compound annual growth rate (CAGR) from 2020 to 2024 was strong at 8.49%, showing sustained demand. Notably, the growth rate from 2023 to 2024 spiked to 9.4%, reflecting increasing market momentum and potential opportunities for both domestic and international vitamin K suppliers.
Estonia Vitamin K Market Overview
The vitamin K market in Estonia is steadily growing, driven by its essential role in blood clotting, bone health, and cardiovascular function. Increasing consumer awareness of its health benefits has led to a rising demand for vitamin K supplements, particularly among individuals focused on maintaining strong bones and overall health. As part of a broader trend toward preventive healthcare, vitamin K products are gaining traction, supported by recommendations from health professionals.
Drivers of the market
The Estonia vitamin K market is driven by its role in bone and cardiovascular health. Increasing health awareness and its inclusion in multivitamins boost the market.
Challenges of the market
The Estonia Vitamin K Market faces limited consumer awareness about its health benefits, affecting demand. Furthermore, stringent European Union regulations on supplements impact product formulation and marketing strategies.
Government Policy of the market
Estonias policies regarding the vitamin K market are aligned with public health strategies that emphasize the importance of vitamin K for bone health and blood clotting. The government supports initiatives that increase the availability of vitamin K in food products and supplements, particularly for populations with increased nutritional needs, such as the elderly. Regulations ensure the safety and quality of vitamin K products, and public health campaigns promote awareness about the role of vitamin K in maintaining cardiovascular and skeletal health. The Estonian government enforces EU standards for vitamin K product labeling and content.
Key Highlights of the Report:
- Estonia Vitamin K Market Outlook
- Market Size of Estonia Vitamin K Market, 2024
- Forecast of Estonia Vitamin K Market, 2031
- Historical Data and Forecast of Estonia Vitamin K Revenues & Volume for the Period 2021-2031
- Estonia Vitamin K Market Trend Evolution
- Estonia Vitamin K Market Drivers and Challenges
- Estonia Vitamin K Price Trends
- Estonia Vitamin K Porter`s Five Forces
- Estonia Vitamin K Industry Life Cycle
- Historical Data and Forecast of Estonia Vitamin K Market Revenues & Volume By Type for the Period 2021-2031
- Historical Data and Forecast of Estonia Vitamin K Market Revenues & Volume By Vitamin K1 for the Period 2021-2031
- Historical Data and Forecast of Estonia Vitamin K Market Revenues & Volume By Vitamin K2 for the Period 2021-2031
- Historical Data and Forecast of Estonia Vitamin K Market Revenues & Volume By Application for the Period 2021-2031
- Historical Data and Forecast of Estonia Vitamin K Market Revenues & Volume By Osteoporosis for the Period 2021-2031
- Historical Data and Forecast of Estonia Vitamin K Market Revenues & Volume By Vitamin-K Dependent Clotting Factor Deficiency for the Period 2021-2031
- Historical Data and Forecast of Estonia Vitamin K Market Revenues & Volume By Prothrombin Deficiency for the Period 2021-2031
- Historical Data and Forecast of Estonia Vitamin K Market Revenues & Volume By Vitamin K Deficiency Bleeding for the Period 2021-2031
- Historical Data and Forecast of Estonia Vitamin K Market Revenues & Volume By Dermal Applications for the Period 2021-2031
- Historical Data and Forecast of Estonia Vitamin K Market Revenues & Volume By Route of Administration for the Period 2021-2031
- Historical Data and Forecast of Estonia Vitamin K Market Revenues & Volume By Oral for the Period 2021-2031
- Historical Data and Forecast of Estonia Vitamin K Market Revenues & Volume By Parenteral for the Period 2021-2031
- Historical Data and Forecast of Estonia Vitamin K Market Revenues & Volume By Topical for the Period 2021-2031
- Estonia Vitamin K Import Export Trade Statistics
- Market Opportunity Assessment By Type
- Market Opportunity Assessment By Application
- Market Opportunity Assessment By Route of Administration
- Estonia Vitamin K Top Companies Market Share
- Estonia Vitamin K Competitive Benchmarking By Technical and Operational Parameters
- Estonia Vitamin K Company Profiles
- Estonia Vitamin K Key Strategic Recommendations
Frequently Asked Questions About the Market Study (FAQs):
6Wresearch actively monitors the Estonia Vitamin K Market and publishes its comprehensive annual report, highlighting emerging trends, growth drivers, revenue analysis, and forecast outlook. Our insights help businesses to make data-backed strategic decisions with ongoing market dynamics. Our analysts track relevent industries related to the Estonia Vitamin K Market, allowing our clients with actionable intelligence and reliable forecasts tailored to emerging regional needs.
Yes, we provide customisation as per your requirements. To learn more, feel free to contact us on sales@6wresearch.com
1 Executive Summary |
2 Introduction |
2.1 Key Highlights of the Report |
2.2 Report Description |
2.3 Market Scope & Segmentation |
2.4 Research Methodology |
2.5 Assumptions |
3 Estonia Vitamin K Market Overview |
3.1 Estonia Country Macro Economic Indicators |
3.2 Estonia Vitamin K Market Revenues & Volume, 2021 & 2031F |
3.3 Estonia Vitamin K Market - Industry Life Cycle |
3.4 Estonia Vitamin K Market - Porter's Five Forces |
3.5 Estonia Vitamin K Market Revenues & Volume Share, By Type, 2021 & 2031F |
3.6 Estonia Vitamin K Market Revenues & Volume Share, By Application, 2021 & 2031F |
3.7 Estonia Vitamin K Market Revenues & Volume Share, By Route of Administration, 2021 & 2031F |
4 Estonia Vitamin K Market Dynamics |
4.1 Impact Analysis |
4.2 Market Drivers |
4.2.1 Increasing awareness about the importance of Vitamin K in maintaining bone health and blood clotting functions |
4.2.2 Growing emphasis on preventive healthcare and the role of supplements in overall well-being |
4.2.3 Aging population in Estonia leading to higher demand for Vitamin K supplements |
4.3 Market Restraints |
4.3.1 Stringent regulations and approval processes for new products in the supplement industry |
4.3.2 Limited availability of Vitamin K-enriched foods in the Estonian market |
4.3.3 Competition from alternative sources of nutrition and health supplements |
5 Estonia Vitamin K Market Trends |
6 Estonia Vitamin K Market Segmentations |
6.1 Estonia Vitamin K Market, By Type |
6.1.1 Overview and Analysis |
6.1.2 Estonia Vitamin K Market Revenues & Volume, By Vitamin K1, 2021-2031F |
6.1.3 Estonia Vitamin K Market Revenues & Volume, By Vitamin K2, 2021-2031F |
6.2 Estonia Vitamin K Market, By Application |
6.2.1 Overview and Analysis |
6.2.2 Estonia Vitamin K Market Revenues & Volume, By Osteoporosis, 2021-2031F |
6.2.3 Estonia Vitamin K Market Revenues & Volume, By Vitamin-K Dependent Clotting Factor Deficiency, 2021-2031F |
6.2.4 Estonia Vitamin K Market Revenues & Volume, By Prothrombin Deficiency, 2021-2031F |
6.2.5 Estonia Vitamin K Market Revenues & Volume, By Vitamin K Deficiency Bleeding, 2021-2031F |
6.2.6 Estonia Vitamin K Market Revenues & Volume, By Dermal Applications, 2021-2031F |
6.3 Estonia Vitamin K Market, By Route of Administration |
6.3.1 Overview and Analysis |
6.3.2 Estonia Vitamin K Market Revenues & Volume, By Oral, 2021-2031F |
6.3.3 Estonia Vitamin K Market Revenues & Volume, By Parenteral, 2021-2031F |
6.3.4 Estonia Vitamin K Market Revenues & Volume, By Topical, 2021-2031F |
7 Estonia Vitamin K Market Import-Export Trade Statistics |
7.1 Estonia Vitamin K Market Export to Major Countries |
7.2 Estonia Vitamin K Market Imports from Major Countries |
8 Estonia Vitamin K Market Key Performance Indicators |
8.1 Number of health awareness campaigns or educational programs related to Vitamin K in Estonia |
8.2 Percentage increase in the sales of Vitamin K supplements year-over-year |
8.3 Number of new product launches or innovations in the Vitamin K supplement market in Estonia |
8.4 Average consumer spend on Vitamin K supplements in the region |
8.5 Growth in the number of healthcare professionals recommending or prescribing Vitamin K supplements |
9 Estonia Vitamin K Market - Opportunity Assessment |
9.1 Estonia Vitamin K Market Opportunity Assessment, By Type, 2021 & 2031F |
9.2 Estonia Vitamin K Market Opportunity Assessment, By Application, 2021 & 2031F |
9.3 Estonia Vitamin K Market Opportunity Assessment, By Route of Administration, 2021 & 2031F |
10 Estonia Vitamin K Market - Competitive Landscape |
10.1 Estonia Vitamin K Market Revenue Share, By Companies, 2024 |
10.2 Estonia Vitamin K Market Competitive Benchmarking, By Operating and Technical Parameters |
11 Company Profiles |
12 Recommendations | 13 Disclaimer |
Global Go To Market Strategy - 2030
Export potential enables firms to identify high-growth global markets with greater confidence by combining advanced trade intelligence with a structured quantitative methodology. The framework analyzes emerging demand trends and country-level import patterns while integrating macroeconomic and trade datasets such as GDP and population forecasts, bilateral import–export flows, tariff structures, elasticity differentials between developed and developing economies, geographic distance, and import demand projections. Using weighted trade values from 2020–2024 as the base period to project country-to-country export potential for 2030, these inputs are operationalized through calculated drivers such as gravity model parameters, tariff impact factors, and projected GDP per-capita growth. Through an analysis of hidden potentials, demand hotspots, and market conditions that are most favorable to success, this method enables firms to focus on target countries, maximize returns, and global expansion with data, backed by accuracy.
By factoring in the projected importer demand gap that is currently unmet and could be potential opportunity, it identifies the potential for the Exporter (Country) among 190 countries, against the general trade analysis, which identifies the biggest importer or exporter.
To discover high-growth global markets and optimize your business strategy:
Click Here
Pricing
- Single User License$ 1,995
- Department License$ 2,400
- Site License$ 3,120
- Global License$ 3,795

Leadership Perspectives from Industry Events
Search
Thought Leadership and Analyst Meet


Our Clients
6WResearch In News
- India Export Attractiveness Tracker 2026
- India Air Conditioner Market Set for Strong Rebound in 2026 After Weather-Led Correction and GST-Driven Recovery: 6Wresearch
- ADAS in India: How Automatic Emergency Braking, Blind Spot Detection & Driver Monitoring are Transforming Road Safety
- Doha a strategic location for EV manufacturing hub: IPA Qatar
- Demand for luxury TVs surging in the GCC, says Samsung
- Empowering Growth: The Thriving Journey of Bangladesh’s Cable Industry
Latest Reports
- Nicaragua RPG Gaming Market (2026-2032)
- New Zealand RPG Gaming Market (2026-2032)
- Netherlands RPG Gaming Market (2026-2032)
- Nauru RPG Gaming Market (2026-2032)
- Namibia RPG Gaming Market (2026-2032)
- Mozambique RPG Gaming Market (2026-2032)
- Montenegro RPG Gaming Market (2026-2032)
- Mongolia RPG Gaming Market (2026-2032)
- Monaco RPG Gaming Market (2026-2032)
- Micronesia RPG Gaming Market (2026-2032)
Industry Events and Analyst Meet

EV India Expo 2026

HIMTEX 2026

India Refining Summit 2026

India EV Show 2026

EV tech India Expo 2026
Whitepaper
- Middle East & Africa Commercial Security Market Click here to view more.
- Middle East & Africa Fire Safety Systems & Equipment Market Click here to view more.
- GCC Drone Market Click here to view more.
- Middle East Lighting Fixture Market Click here to view more.
- GCC Physical & Perimeter Security Market Click here to view more.