Finland Precipitated Calcium Carbonate Market (2026-2032) | Share, Companies, Industry, Outlook, Growth, Trends, Segmentation, Size & Revenue, Competitive Landscape, Analysis, Value, Forecast
Market Forecast By Grade (Food, Pharmaceutical, Cosmetic, Reagent) And Competitive Landscape
| Product Code: ETC7205730 | Publication Date: Sep 2024 | Updated Date: Apr 2026 | Product Type: Market Research Report | |
| Publisher: 6Wresearch | Author: Shubham Padhi | No. of Pages: 75 | No. of Figures: 35 | No. of Tables: 20 |
Finland Precipitated Calcium Carbonate Market Size (2020-2030)
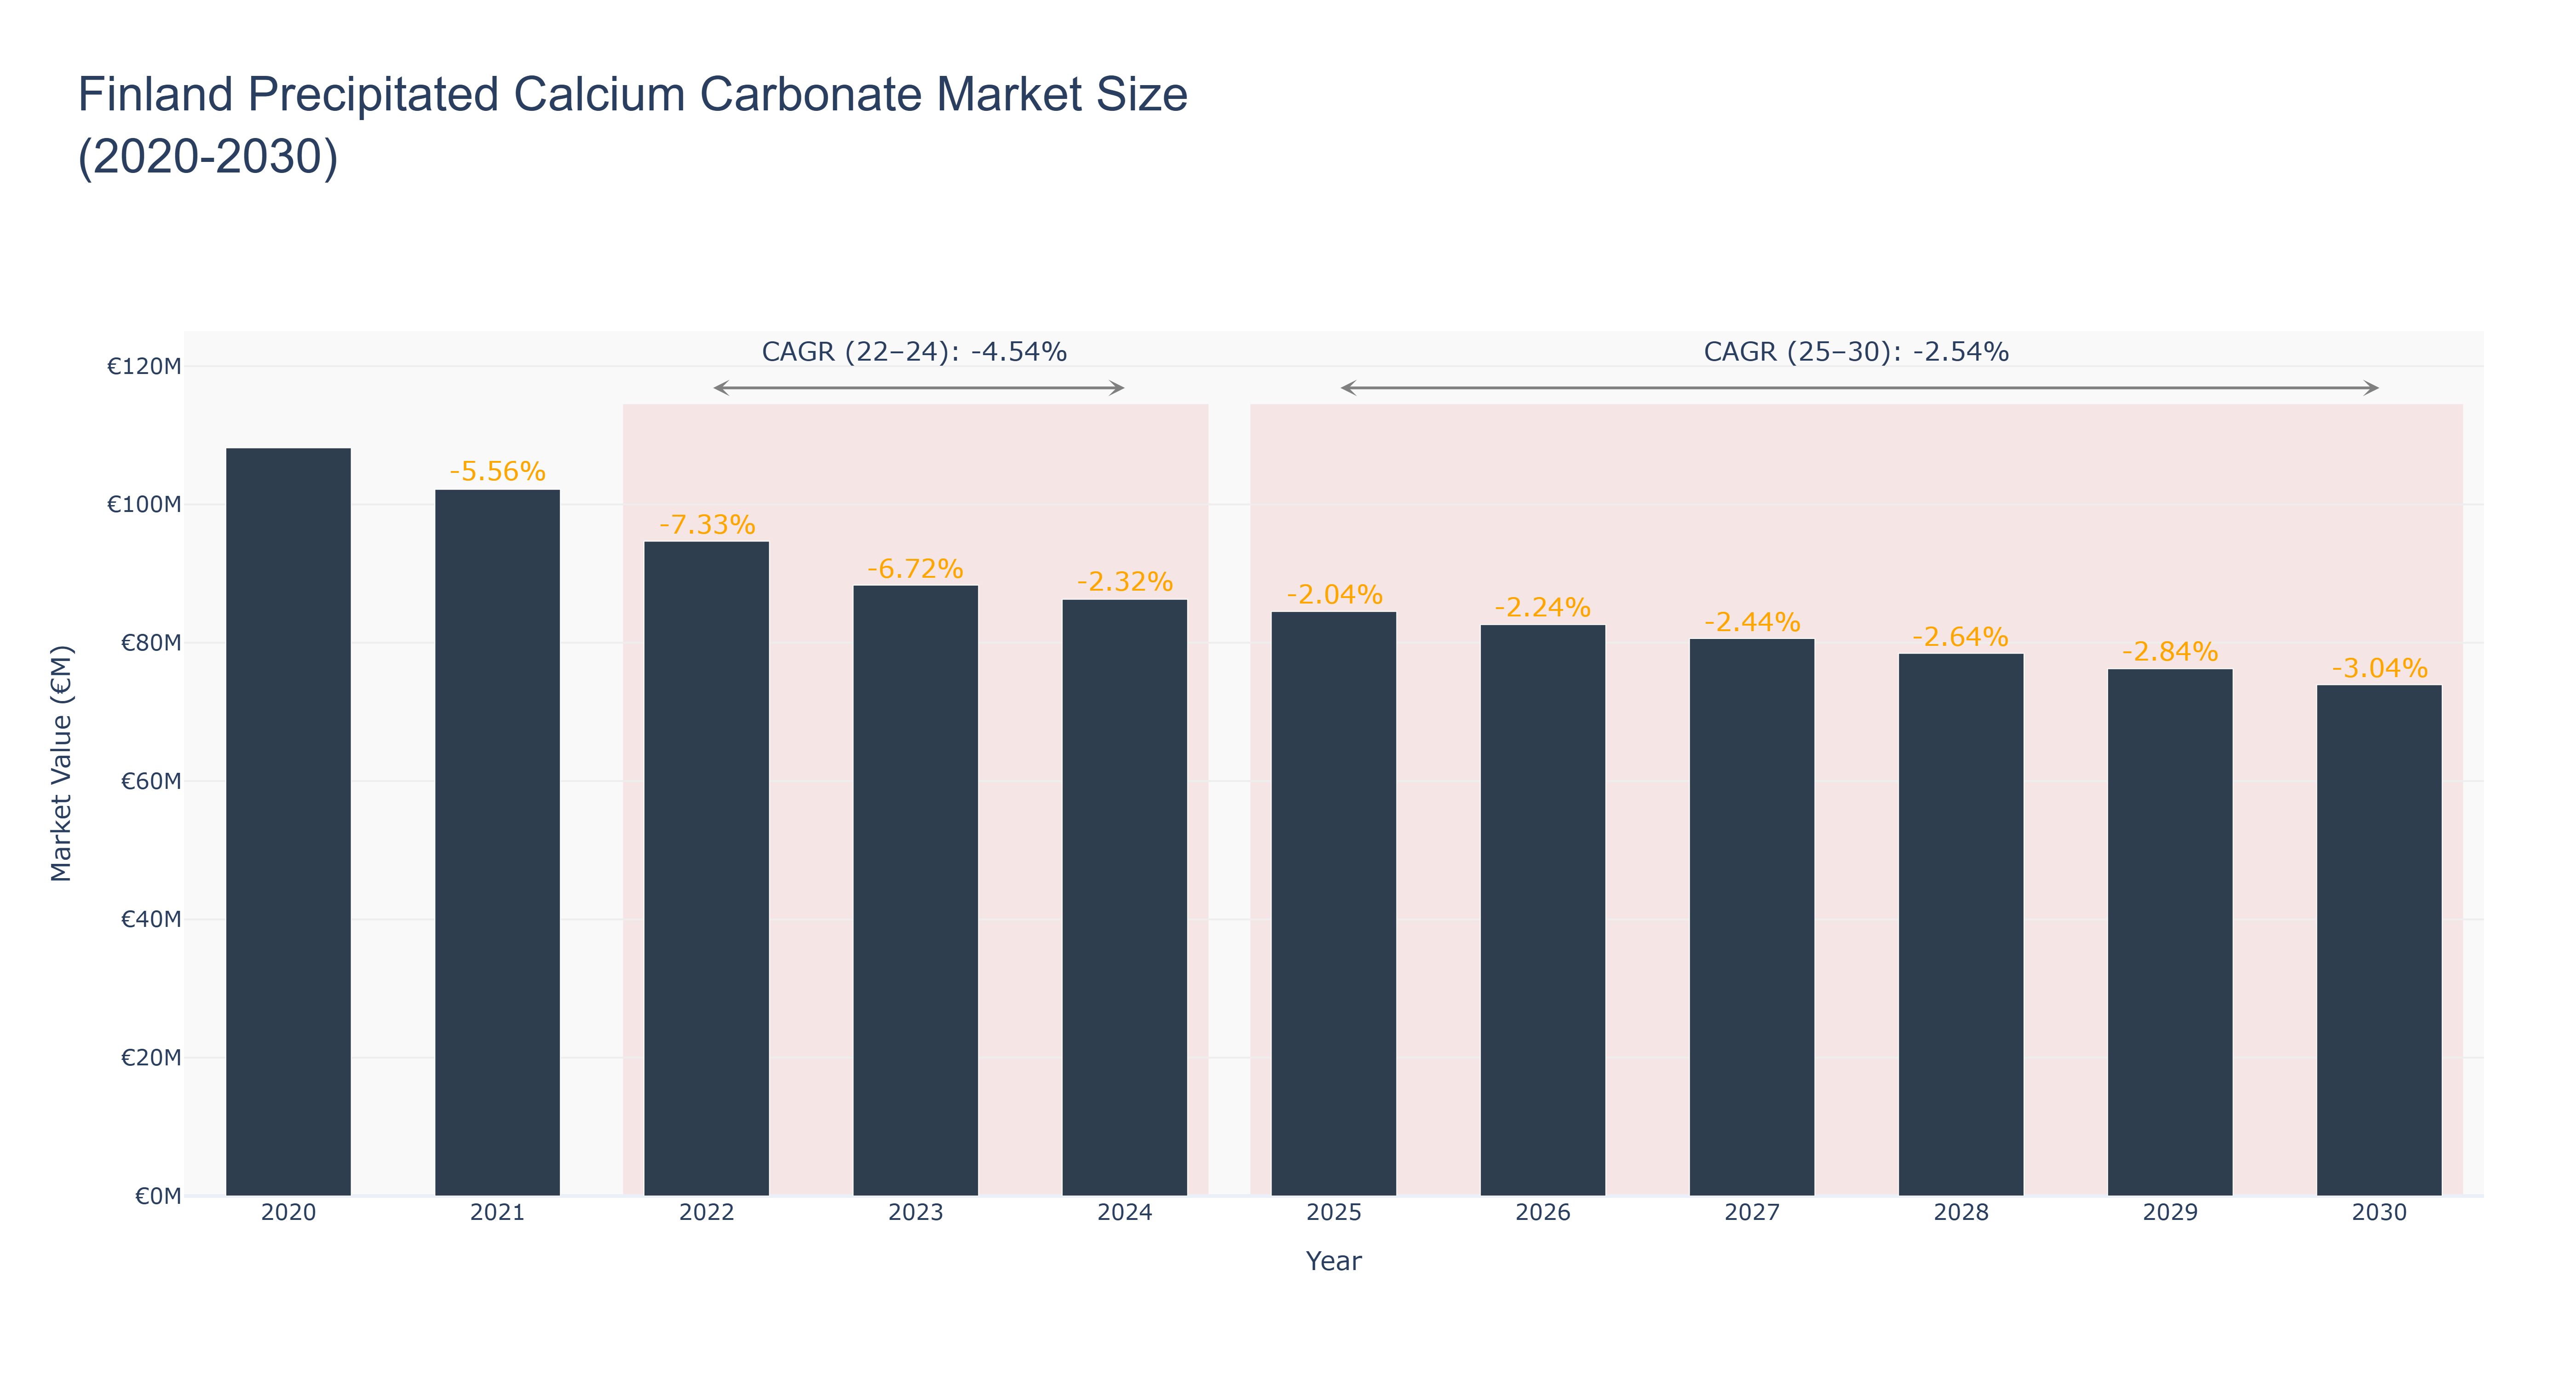
Finland's Precipitated Calcium Carbonate Market has experienced a steady decline in market size from €108.19 million in 2020 to €73.92 million in 2030, with a peak in 2020. The market saw a significant drop from 2020 to 2024 due to negative growth rates each year, indicating a challenging period for the industry. The CAGR from 2022 to 2024 was -4.54%, while the forecasted CAGR from 2025 to 2030 is -2.54%. Industry drivers such as changing consumer preferences towards eco-friendly products and increased regulations on industrial emissions have impacted the market. Looking ahead, Finland's Precipitated Calcium Carbonate Market is expected to focus on sustainability initiatives and technological advancements to drive growth. Recent developments include collaborations with research institutions to develop innovative production methods, paving the way for a more competitive market landscape.
Finland Precipitated Calcium Carbonate Market: Production & Trade Performance (2019-2025)
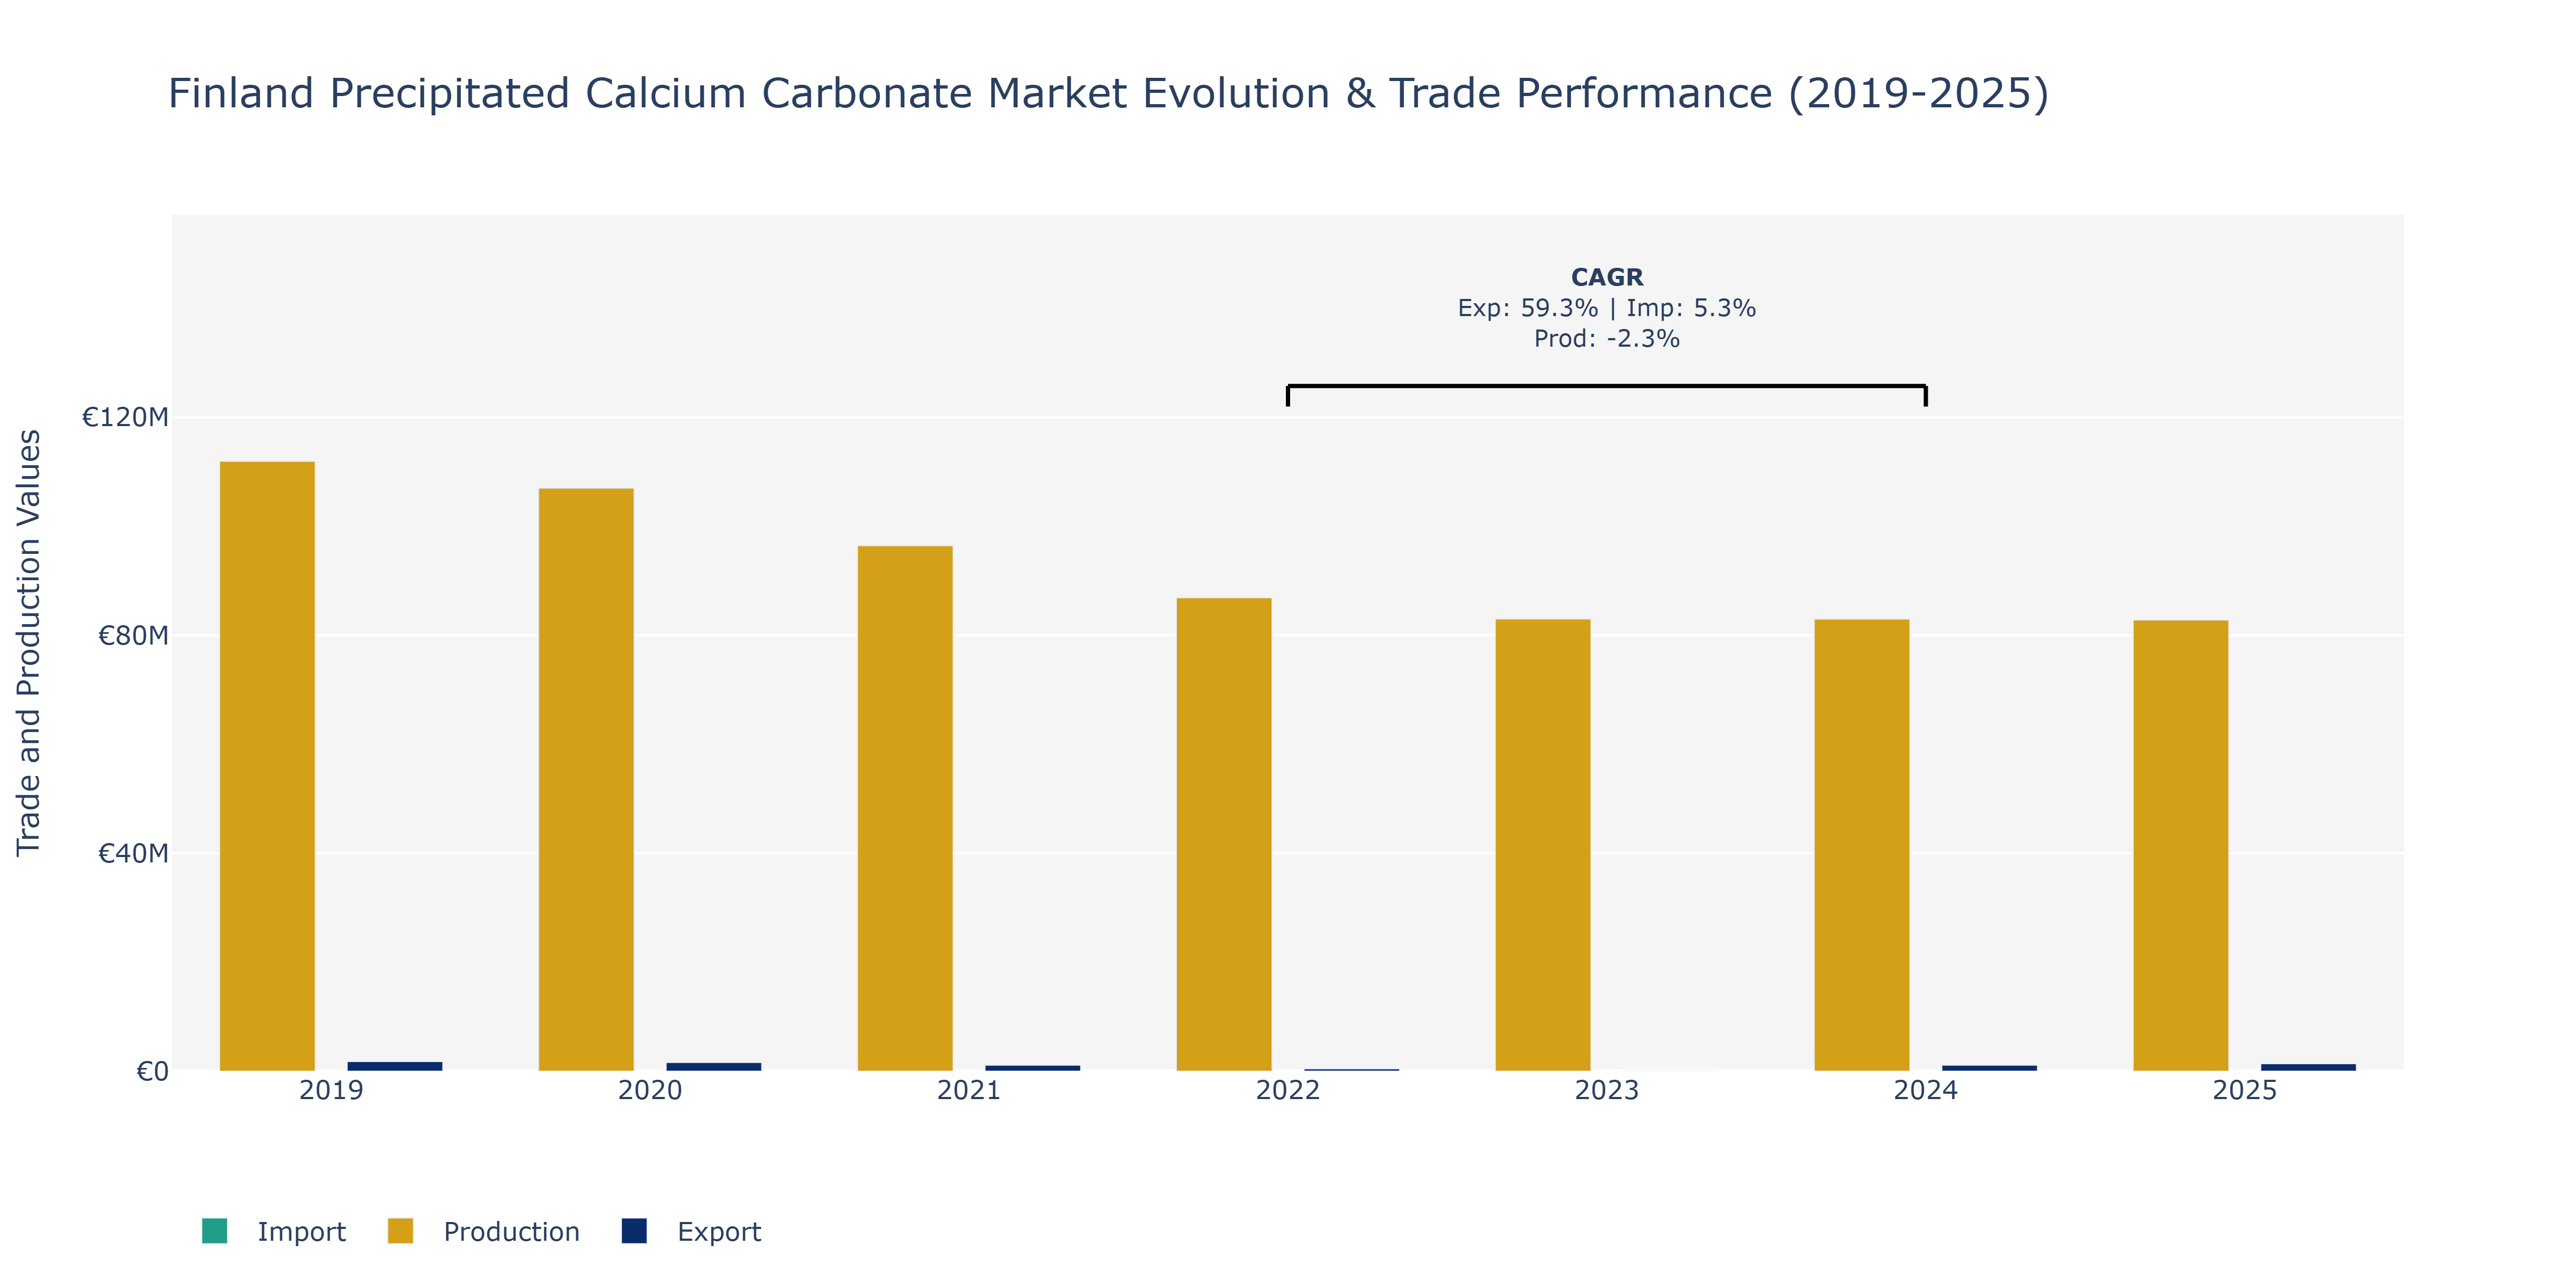
In the Finland Precipitated Calcium Carbonate market, exports experienced a notable decrease from €1.78 million in 2019 to €19.26 thousand in 2023 before showing a recovery in 2024 and 2025, reaching €1.11 million and €1.37 million, respectively. Imports, on the other hand, followed a more fluctuating trend, starting at €348.32 thousand in 2019, peaking in 2022 at €3.65 million, and then declining slightly in 2025 to €4.28 million. Production witnessed a continuous decline from €111.93 million in 2019 to €82.80 million in 2024, with a marginal uptick in 2025 to €82.80 million. The decline in production could be attributed to the changing consumer preferences towards alternative materials or environmental concerns leading to regulatory changes impacting production processes. The fluctuations in imports might be influenced by global market conditions impacting demand and supply dynamics. To maintain market competitiveness, market players could focus on enhancing production efficiency and exploring innovative uses of precipitated calcium carbonate in various industries.
Key Highlights of the Report:
- Finland Precipitated Calcium Carbonate Market Outlook
- Market Size of Finland Precipitated Calcium Carbonate Market, 2025
- Forecast of Finland Precipitated Calcium Carbonate Market, 2032
- Historical Data and Forecast of Finland Precipitated Calcium Carbonate Revenues & Volume for the Period 2022 - 2032
- Finland Precipitated Calcium Carbonate Market Trend Evolution
- Finland Precipitated Calcium Carbonate Market Drivers and Challenges
- Finland Precipitated Calcium Carbonate Price Trends
- Finland Precipitated Calcium Carbonate Porter's Five Forces
- Finland Precipitated Calcium Carbonate Industry Life Cycle
- Historical Data and Forecast of Finland Precipitated Calcium Carbonate Market Revenues & Volume By Grade for the Period 2022 - 2032
- Historical Data and Forecast of Finland Precipitated Calcium Carbonate Market Revenues & Volume By Food for the Period 2022 - 2032
- Historical Data and Forecast of Finland Precipitated Calcium Carbonate Market Revenues & Volume By Pharmaceutical for the Period 2022 - 2032
- Historical Data and Forecast of Finland Precipitated Calcium Carbonate Market Revenues & Volume By Cosmetic for the Period 2022 - 2032
- Historical Data and Forecast of Finland Precipitated Calcium Carbonate Market Revenues & Volume By Reagent for the Period 2022 - 2032
- Finland Precipitated Calcium Carbonate Import Export Trade Statistics
- Market Opportunity Assessment By Grade
- Finland Precipitated Calcium Carbonate Top Companies Market Share
- Finland Precipitated Calcium Carbonate Competitive Benchmarking By Technical and Operational Parameters
- Finland Precipitated Calcium Carbonate Company Profiles
- Finland Precipitated Calcium Carbonate Key Strategic Recommendations
Frequently Asked Questions About the Market Study (FAQs):
6Wresearch actively monitors the Finland Precipitated Calcium Carbonate Market and publishes its comprehensive annual report, highlighting emerging trends, growth drivers, revenue analysis, and forecast outlook. Our insights help businesses to make data-backed strategic decisions with ongoing market dynamics. Our analysts track relevent industries related to the Finland Precipitated Calcium Carbonate Market, allowing our clients with actionable intelligence and reliable forecasts tailored to emerging regional needs.
Yes, we provide customisation as per your requirements. To learn more, feel free to contact us on sales@6wresearch.com
1 Executive Summary |
2 Introduction |
2.1 Key Highlights of the Report |
2.2 Report Description |
2.3 Market Scope & Segmentation |
2.4 Research Methodology |
2.5 Assumptions |
3 Finland Precipitated Calcium Carbonate Market Overview |
3.1 Finland Country Macro Economic Indicators |
3.2 Finland Precipitated Calcium Carbonate Market Revenues & Volume, 2022 & 2032F |
3.3 Finland Precipitated Calcium Carbonate Market - Industry Life Cycle |
3.4 Finland Precipitated Calcium Carbonate Market - Porter's Five Forces |
3.5 Finland Precipitated Calcium Carbonate Market Revenues & Volume Share, By Grade, 2022 & 2032F |
4 Finland Precipitated Calcium Carbonate Market Dynamics |
4.1 Impact Analysis |
4.2 Market Drivers |
4.2.1 Growing demand from end-use industries such as paper, plastics, and paints due to the superior properties of precipitated calcium carbonate. |
4.2.2 Increasing focus on sustainable and eco-friendly alternatives to traditional fillers and extenders. |
4.2.3 Technological advancements leading to improved production processes and cost efficiencies. |
4.3 Market Restraints |
4.3.1 Fluctuating raw material prices impacting production costs. |
4.3.2 Regulatory challenges related to environmental compliance and waste disposal. |
4.3.3 Competition from other fillers and extenders in the market. |
5 Finland Precipitated Calcium Carbonate Market Trends |
6 Finland Precipitated Calcium Carbonate Market, By Types |
6.1 Finland Precipitated Calcium Carbonate Market, By Grade |
6.1.1 Overview and Analysis |
6.1.2 Finland Precipitated Calcium Carbonate Market Revenues & Volume, By Grade, 2022 - 2032F |
6.1.3 Finland Precipitated Calcium Carbonate Market Revenues & Volume, By Food, 2022 - 2032F |
6.1.4 Finland Precipitated Calcium Carbonate Market Revenues & Volume, By Pharmaceutical, 2022 - 2032F |
6.1.5 Finland Precipitated Calcium Carbonate Market Revenues & Volume, By Cosmetic, 2022 - 2032F |
6.1.6 Finland Precipitated Calcium Carbonate Market Revenues & Volume, By Reagent, 2022 - 2032F |
7 Finland Precipitated Calcium Carbonate Market Import-Export Trade Statistics |
7.1 Finland Precipitated Calcium Carbonate Market Export to Major Countries |
7.2 Finland Precipitated Calcium Carbonate Market Imports from Major Countries |
8 Finland Precipitated Calcium Carbonate Market Key Performance Indicators |
8.1 Energy efficiency improvements in the production process. |
8.2 Adoption rate of precipitated calcium carbonate in new applications. |
8.3 Research and development investments in enhancing product quality and performance. |
9 Finland Precipitated Calcium Carbonate Market - Opportunity Assessment |
9.1 Finland Precipitated Calcium Carbonate Market Opportunity Assessment, By Grade, 2022 & 2032F |
10 Finland Precipitated Calcium Carbonate Market - Competitive Landscape |
10.1 Finland Precipitated Calcium Carbonate Market Revenue Share, By Companies, 2025 |
10.2 Finland Precipitated Calcium Carbonate Market Competitive Benchmarking, By Operating and Technical Parameters |
11 Company Profiles |
12 Recommendations |
13 Disclaimer |
Global Go To Market Strategy - 2030
Export potential enables firms to identify high-growth global markets with greater confidence by combining advanced trade intelligence with a structured quantitative methodology. The framework analyzes emerging demand trends and country-level import patterns while integrating macroeconomic and trade datasets such as GDP and population forecasts, bilateral import–export flows, tariff structures, elasticity differentials between developed and developing economies, geographic distance, and import demand projections. Using weighted trade values from 2020–2024 as the base period to project country-to-country export potential for 2030, these inputs are operationalized through calculated drivers such as gravity model parameters, tariff impact factors, and projected GDP per-capita growth. Through an analysis of hidden potentials, demand hotspots, and market conditions that are most favorable to success, this method enables firms to focus on target countries, maximize returns, and global expansion with data, backed by accuracy.
By factoring in the projected importer demand gap that is currently unmet and could be potential opportunity, it identifies the potential for the Exporter (Country) among 190 countries, against the general trade analysis, which identifies the biggest importer or exporter.
To discover high-growth global markets and optimize your business strategy:
Click Here
Pricing
- Single User License$ 1,995
- Department License$ 2,400
- Site License$ 3,120
- Global License$ 3,795

Leadership Perspectives from Industry Events
Search
Thought Leadership and Analyst Meet


Our Clients
6WResearch In News
- India Export Attractiveness Tracker 2026
- India Air Conditioner Market Set for Strong Rebound in 2026 After Weather-Led Correction and GST-Driven Recovery: 6Wresearch
- ADAS in India: How Automatic Emergency Braking, Blind Spot Detection & Driver Monitoring are Transforming Road Safety
- Doha a strategic location for EV manufacturing hub: IPA Qatar
- Demand for luxury TVs surging in the GCC, says Samsung
- Empowering Growth: The Thriving Journey of Bangladesh’s Cable Industry
Latest Reports
- Qatar Access and Home Network Market (2026-2032)
- Nicaragua RPG Gaming Market (2026-2032)
- New Zealand RPG Gaming Market (2026-2032)
- Netherlands RPG Gaming Market (2026-2032)
- Nauru RPG Gaming Market (2026-2032)
- Namibia RPG Gaming Market (2026-2032)
- Mozambique RPG Gaming Market (2026-2032)
- Montenegro RPG Gaming Market (2026-2032)
- Mongolia RPG Gaming Market (2026-2032)
- Monaco RPG Gaming Market (2026-2032)
Industry Events and Analyst Meet

EV India Expo 2026

HIMTEX 2026

India Refining Summit 2026

India EV Show 2026

EV tech India Expo 2026
Whitepaper
- Middle East & Africa Commercial Security Market Click here to view more.
- Middle East & Africa Fire Safety Systems & Equipment Market Click here to view more.
- GCC Drone Market Click here to view more.
- Middle East Lighting Fixture Market Click here to view more.
- GCC Physical & Perimeter Security Market Click here to view more.