Gambia Natural Sweeteners Market (2026-2032) | Outlook, Growth, Companies, Forecast, Segmentation, Size, Trends, Analysis, Share, Revenue, Value & Industry
Market Forecast By Type (Stevia, Sorbitol, Xylitol, Mannitol, Erythritol, Sweet Proteins, Others), By End Use Sector (Food & Beverage, Pharmaceutical, Direct Sales, Others) And Competitive Landscape
| Product Code: ETC5798818 | Publication Date: Nov 2023 | Updated Date: Mar 2026 | Product Type: Market Research Report | |
| Publisher: 6Wresearch | Author: Summon Dutta | No. of Pages: 60 | No. of Figures: 30 | No. of Tables: 5 |
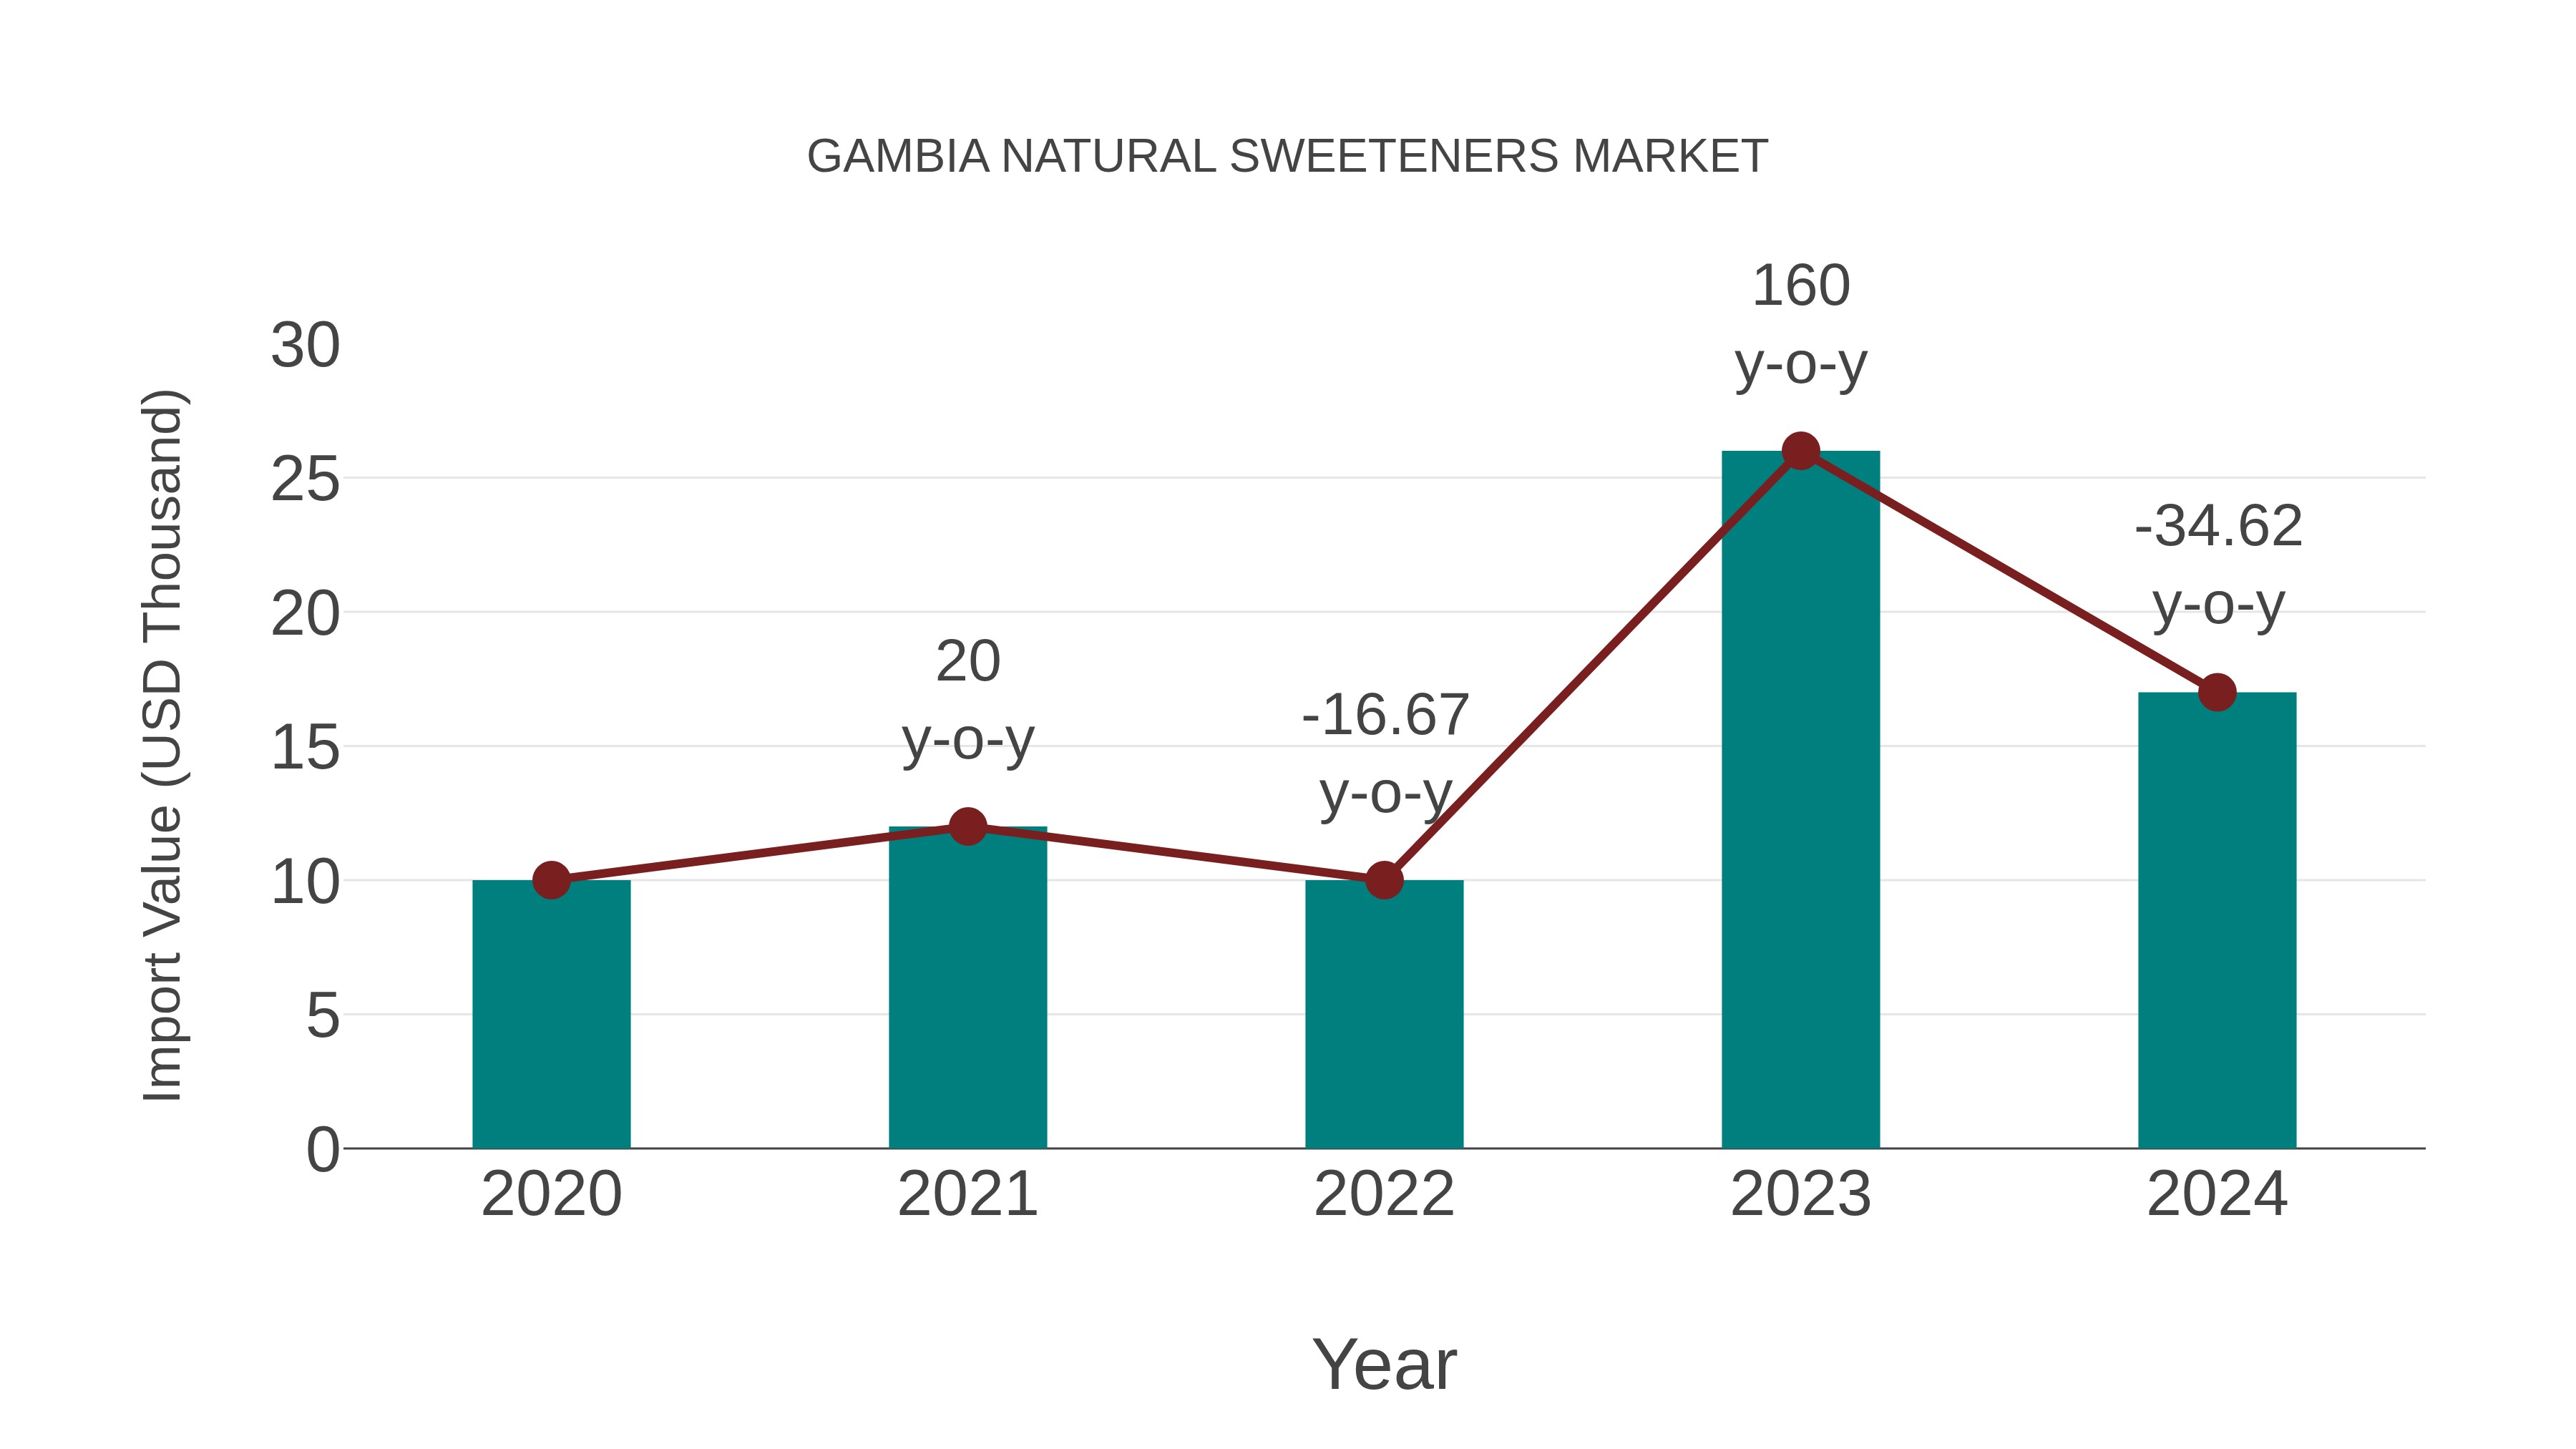
Gambia Natural Sweeteners Market: Import Trend Analysis
The Gambia natural sweeteners market witnessed a positive import trend from 2020 to 2024, with a Compound Annual Growth Rate (CAGR) of 14.19%. Notably, in 2023-2024, there was a year-on-year growth rate of -34.62%. This fluctuation indicates a temporary decrease in imports during that specific period.
Gambia Natural Sweeteners Market Overview
The natural sweeteners market in Gambia benefits from rising health consciousness among consumers seeking alternatives to artificial sweeteners. Products such as stevia, honey, and agave nectar find application in food, beverages, and pharmaceuticals, driving consistent market expansion.
Drivers of the market
The rising prevalence of health concerns such as diabetes and obesity propels the demand for natural sweeteners in Gambia. Consumers are increasingly seeking healthier alternatives to artificial sweeteners, driving growth in the food and beverage industry.
Challenges of the market
The natural sweeteners market in the Gambia is constrained by limited local production of raw materials and a reliance on imported products. There is also a lack of awareness about the health benefits of natural sweeteners compared to traditional sugar. The high cost of natural sweeteners, combined with consumer price sensitivity, limits their adoption in the Gambia`s food and beverage sectors.
Government Policy of the market
The Gambia government may support the growth of the natural sweeteners market by encouraging the production of locally sourced, healthy alternatives to sugar. Policies could focus on promoting the cultivation of natural sweetener crops such as stevia, monk fruit, and others, offering financial support to farmers and businesses involved in their production. The government might also regulate the labeling and marketing of natural sweeteners to ensure consumer safety and foster public awareness of the health benefits associated with these products. Additionally, policies could create export opportunities for Gambias natural sweeteners in regional and global markets.
Key Highlights of the Report:
- Gambia Natural Sweeteners Market Outlook
- Market Size of Gambia Natural Sweeteners Market, 2025
- Forecast of Gambia Natural Sweeteners Market, 2032
- Historical Data and Forecast of Gambia Natural Sweeteners Revenues & Volume for the Period 2022-2032F
- Gambia Natural Sweeteners Market Trend Evolution
- Gambia Natural Sweeteners Market Drivers and Challenges
- Gambia Natural Sweeteners Price Trends
- Gambia Natural Sweeteners Porter`s Five Forces
- Gambia Natural Sweeteners Industry Life Cycle
- Historical Data and Forecast of Gambia Natural Sweeteners Market Revenues & Volume By Type for the Period 2022-2032F
- Historical Data and Forecast of Gambia Natural Sweeteners Market Revenues & Volume By Stevia for the Period 2022-2032F
- Historical Data and Forecast of Gambia Natural Sweeteners Market Revenues & Volume By Sorbitol for the Period 2022-2032F
- Historical Data and Forecast of Gambia Natural Sweeteners Market Revenues & Volume By Xylitol for the Period 2022-2032F
- Historical Data and Forecast of Gambia Natural Sweeteners Market Revenues & Volume By Mannitol for the Period 2022-2032F
- Historical Data and Forecast of Gambia Natural Sweeteners Market Revenues & Volume By Erythritol for the Period 2022-2032F
- Historical Data and Forecast of Gambia Natural Sweeteners Market Revenues & Volume By Sweet Proteins for the Period 2022-2032F
- Historical Data and Forecast of Gambia Natural Sweeteners Market Revenues & Volume By Others for the Period 2022-2032F
- Historical Data and Forecast of Gambia Natural Sweeteners Market Revenues & Volume By End Use Sector for the Period 2022-2032F
- Historical Data and Forecast of Gambia Natural Sweeteners Market Revenues & Volume By Food & Beverage for the Period 2022-2032F
- Historical Data and Forecast of Gambia Natural Sweeteners Market Revenues & Volume By Pharmaceutical for the Period 2022-2032F
- Historical Data and Forecast of Gambia Natural Sweeteners Market Revenues & Volume By Direct Sales for the Period 2022-2032F
- Historical Data and Forecast of Gambia Natural Sweeteners Market Revenues & Volume By Others for the Period 2022-2032F
- Gambia Natural Sweeteners Import Export Trade Statistics
- Market Opportunity Assessment By Type
- Market Opportunity Assessment By End Use Sector
- Gambia Natural Sweeteners Top Companies Market Share
- Gambia Natural Sweeteners Competitive Benchmarking By Technical and Operational Parameters
- Gambia Natural Sweeteners Company Profiles
- Gambia Natural Sweeteners Key Strategic Recommendations
Gambia Natural Sweeteners Market (2026-2032): FAQs
6Wresearch actively monitors the Gambia Natural Sweeteners Market and publishes its comprehensive annual report, highlighting emerging trends, growth drivers, revenue analysis, and forecast outlook. Our insights help businesses to make data-backed strategic decisions with ongoing market dynamics. Our analysts track relevent industries related to the Gambia Natural Sweeteners Market, allowing our clients with actionable intelligence and reliable forecasts tailored to emerging regional needs.
Yes, we provide customisation as per your requirements. To learn more, feel free to contact us on sales@6wresearch.com
1 Executive Summary |
2 Introduction |
2.1 Key Highlights of the Report |
2.2 Report Description |
2.3 Market Scope & Segmentation |
2.4 Research Methodology |
2.5 Assumptions |
3 Gambia Natural Sweeteners Market Overview |
3.1 Gambia Country Macro Economic Indicators |
3.2 Gambia Natural Sweeteners Market Revenues & Volume, 2022 & 2032F |
3.3 Gambia Natural Sweeteners Market - Industry Life Cycle |
3.4 Gambia Natural Sweeteners Market - Porter's Five Forces |
3.5 Gambia Natural Sweeteners Market Revenues & Volume Share, By Type, 2022 & 2032F |
3.6 Gambia Natural Sweeteners Market Revenues & Volume Share, By End Use Sector, 2022 & 2032F |
4 Gambia Natural Sweeteners Market Dynamics |
4.1 Impact Analysis |
4.2 Market Drivers |
4.2.1 Increasing consumer awareness about health and wellness leading to a shift towards natural sweeteners |
4.2.2 Growing demand for organic and non-GMO products in the food and beverage industry |
4.2.3 Government regulations promoting the use of natural sweeteners over artificial ones |
4.3 Market Restraints |
4.3.1 Limited availability of raw materials for natural sweeteners production |
4.3.2 Price volatility of natural sweeteners compared to artificial sweeteners |
5 Gambia Natural Sweeteners Market Trends |
6 Gambia Natural Sweeteners Market Segmentations |
6.1 Gambia Natural Sweeteners Market, By Type |
6.1.1 Overview and Analysis |
6.1.2 Gambia Natural Sweeteners Market Revenues & Volume, By Stevia, 2022-2032F |
6.1.3 Gambia Natural Sweeteners Market Revenues & Volume, By Sorbitol, 2022-2032F |
6.1.4 Gambia Natural Sweeteners Market Revenues & Volume, By Xylitol, 2022-2032F |
6.1.5 Gambia Natural Sweeteners Market Revenues & Volume, By Mannitol, 2022-2032F |
6.1.6 Gambia Natural Sweeteners Market Revenues & Volume, By Erythritol, 2022-2032F |
6.1.7 Gambia Natural Sweeteners Market Revenues & Volume, By Sweet Proteins, 2022-2032F |
6.2 Gambia Natural Sweeteners Market, By End Use Sector |
6.2.1 Overview and Analysis |
6.2.2 Gambia Natural Sweeteners Market Revenues & Volume, By Food & Beverage, 2022-2032F |
6.2.3 Gambia Natural Sweeteners Market Revenues & Volume, By Pharmaceutical, 2022-2032F |
6.2.4 Gambia Natural Sweeteners Market Revenues & Volume, By Direct Sales, 2022-2032F |
6.2.5 Gambia Natural Sweeteners Market Revenues & Volume, By Others, 2022-2032F |
7 Gambia Natural Sweeteners Market Import-Export Trade Statistics |
7.1 Gambia Natural Sweeteners Market Export to Major Countries |
7.2 Gambia Natural Sweeteners Market Imports from Major Countries |
8 Gambia Natural Sweeteners Market Key Performance Indicators |
8.1 Consumer acceptance and preference for natural sweeteners in Gambia |
8.2 Growth in the number of products using natural sweeteners in the market |
8.3 Adoption rate of natural sweeteners by food and beverage manufacturers |
9 Gambia Natural Sweeteners Market - Opportunity Assessment |
9.1 Gambia Natural Sweeteners Market Opportunity Assessment, By Type, 2022 & 2032F |
9.2 Gambia Natural Sweeteners Market Opportunity Assessment, By End Use Sector, 2022 & 2032F |
10 Gambia Natural Sweeteners Market - Competitive Landscape |
10.1 Gambia Natural Sweeteners Market Revenue Share, By Companies, 2025 |
10.2 Gambia Natural Sweeteners Market Competitive Benchmarking, By Operating and Technical Parameters |
11 Company Profiles |
12 Recommendations | 13 Disclaimer |
Global Go To Market Strategy - 2030
Export potential enables firms to identify high-growth global markets with greater confidence by combining advanced trade intelligence with a structured quantitative methodology. The framework analyzes emerging demand trends and country-level import patterns while integrating macroeconomic and trade datasets such as GDP and population forecasts, bilateral import–export flows, tariff structures, elasticity differentials between developed and developing economies, geographic distance, and import demand projections. Using weighted trade values from 2020–2024 as the base period to project country-to-country export potential for 2030, these inputs are operationalized through calculated drivers such as gravity model parameters, tariff impact factors, and projected GDP per-capita growth. Through an analysis of hidden potentials, demand hotspots, and market conditions that are most favorable to success, this method enables firms to focus on target countries, maximize returns, and global expansion with data, backed by accuracy.
By factoring in the projected importer demand gap that is currently unmet and could be potential opportunity, it identifies the potential for the Exporter (Country) among 190 countries, against the general trade analysis, which identifies the biggest importer or exporter.
To discover high-growth global markets and optimize your business strategy:
Click Here
Pricing
- Single User License$ 1,995
- Department License$ 2,400
- Site License$ 3,120
- Global License$ 3,795

Leadership Perspectives from Industry Events
Search
Thought Leadership and Analyst Meet


Our Clients
6WResearch In News
- India Export Attractiveness Tracker 2026
- India Air Conditioner Market Set for Strong Rebound in 2026 After Weather-Led Correction and GST-Driven Recovery: 6Wresearch
- ADAS in India: How Automatic Emergency Braking, Blind Spot Detection & Driver Monitoring are Transforming Road Safety
- Doha a strategic location for EV manufacturing hub: IPA Qatar
- Demand for luxury TVs surging in the GCC, says Samsung
- Empowering Growth: The Thriving Journey of Bangladesh’s Cable Industry
Latest Reports
- Qatar Access and Home Network Market (2026-2032)
- Nicaragua RPG Gaming Market (2026-2032)
- New Zealand RPG Gaming Market (2026-2032)
- Netherlands RPG Gaming Market (2026-2032)
- Nauru RPG Gaming Market (2026-2032)
- Namibia RPG Gaming Market (2026-2032)
- Mozambique RPG Gaming Market (2026-2032)
- Montenegro RPG Gaming Market (2026-2032)
- Mongolia RPG Gaming Market (2026-2032)
- Monaco RPG Gaming Market (2026-2032)
Industry Events and Analyst Meet

EV India Expo 2026

HIMTEX 2026

India Refining Summit 2026

India EV Show 2026

EV tech India Expo 2026
Whitepaper
- Middle East & Africa Commercial Security Market Click here to view more.
- Middle East & Africa Fire Safety Systems & Equipment Market Click here to view more.
- GCC Drone Market Click here to view more.
- Middle East Lighting Fixture Market Click here to view more.
- GCC Physical & Perimeter Security Market Click here to view more.