Georgia Vitamin B3 Market (2026-2032) Outlook | Growth, Revenue, Share, Analysis, Value, Companies, Industry, Trends, Size & Forecast
Market Forecast By Type (Feed grade, Nutrition grade), By Source (Natural, Synthetic), By Form (Dry, Liquid), By Application (Nutrition, Consumer, Agrochemicals, Pharmaceuticals, Other applications) And Competitive Landscape
| Product Code: ETC103939 | Publication Date: Jun 2021 | Updated Date: Jun 2026 | Product Type: Report | |
| Publisher: 6Wresearch | Author: Ravi Bhandari | No. of Pages: 70 | No. of Figures: 35 | No. of Tables: 5 |
Georgia Vitamin B3 Market Size, Share & Growth Rate
The Georgia Vitamin B3 Market was estimated at USD 368 Million in 2025 and is projected to reach USD 509 Million by 2032, growing at a CAGR of 4.7% from 2026 to 2032. This impressive growth trajectory is primarily fueled by increasing consumer awareness regarding the health benefits of vitamin B3, particularly in dietary supplements and fortified foods. Additionally, the growing prevalence of metabolic disorders and a heightened focus on cardiovascular health are further propelling the market forward.
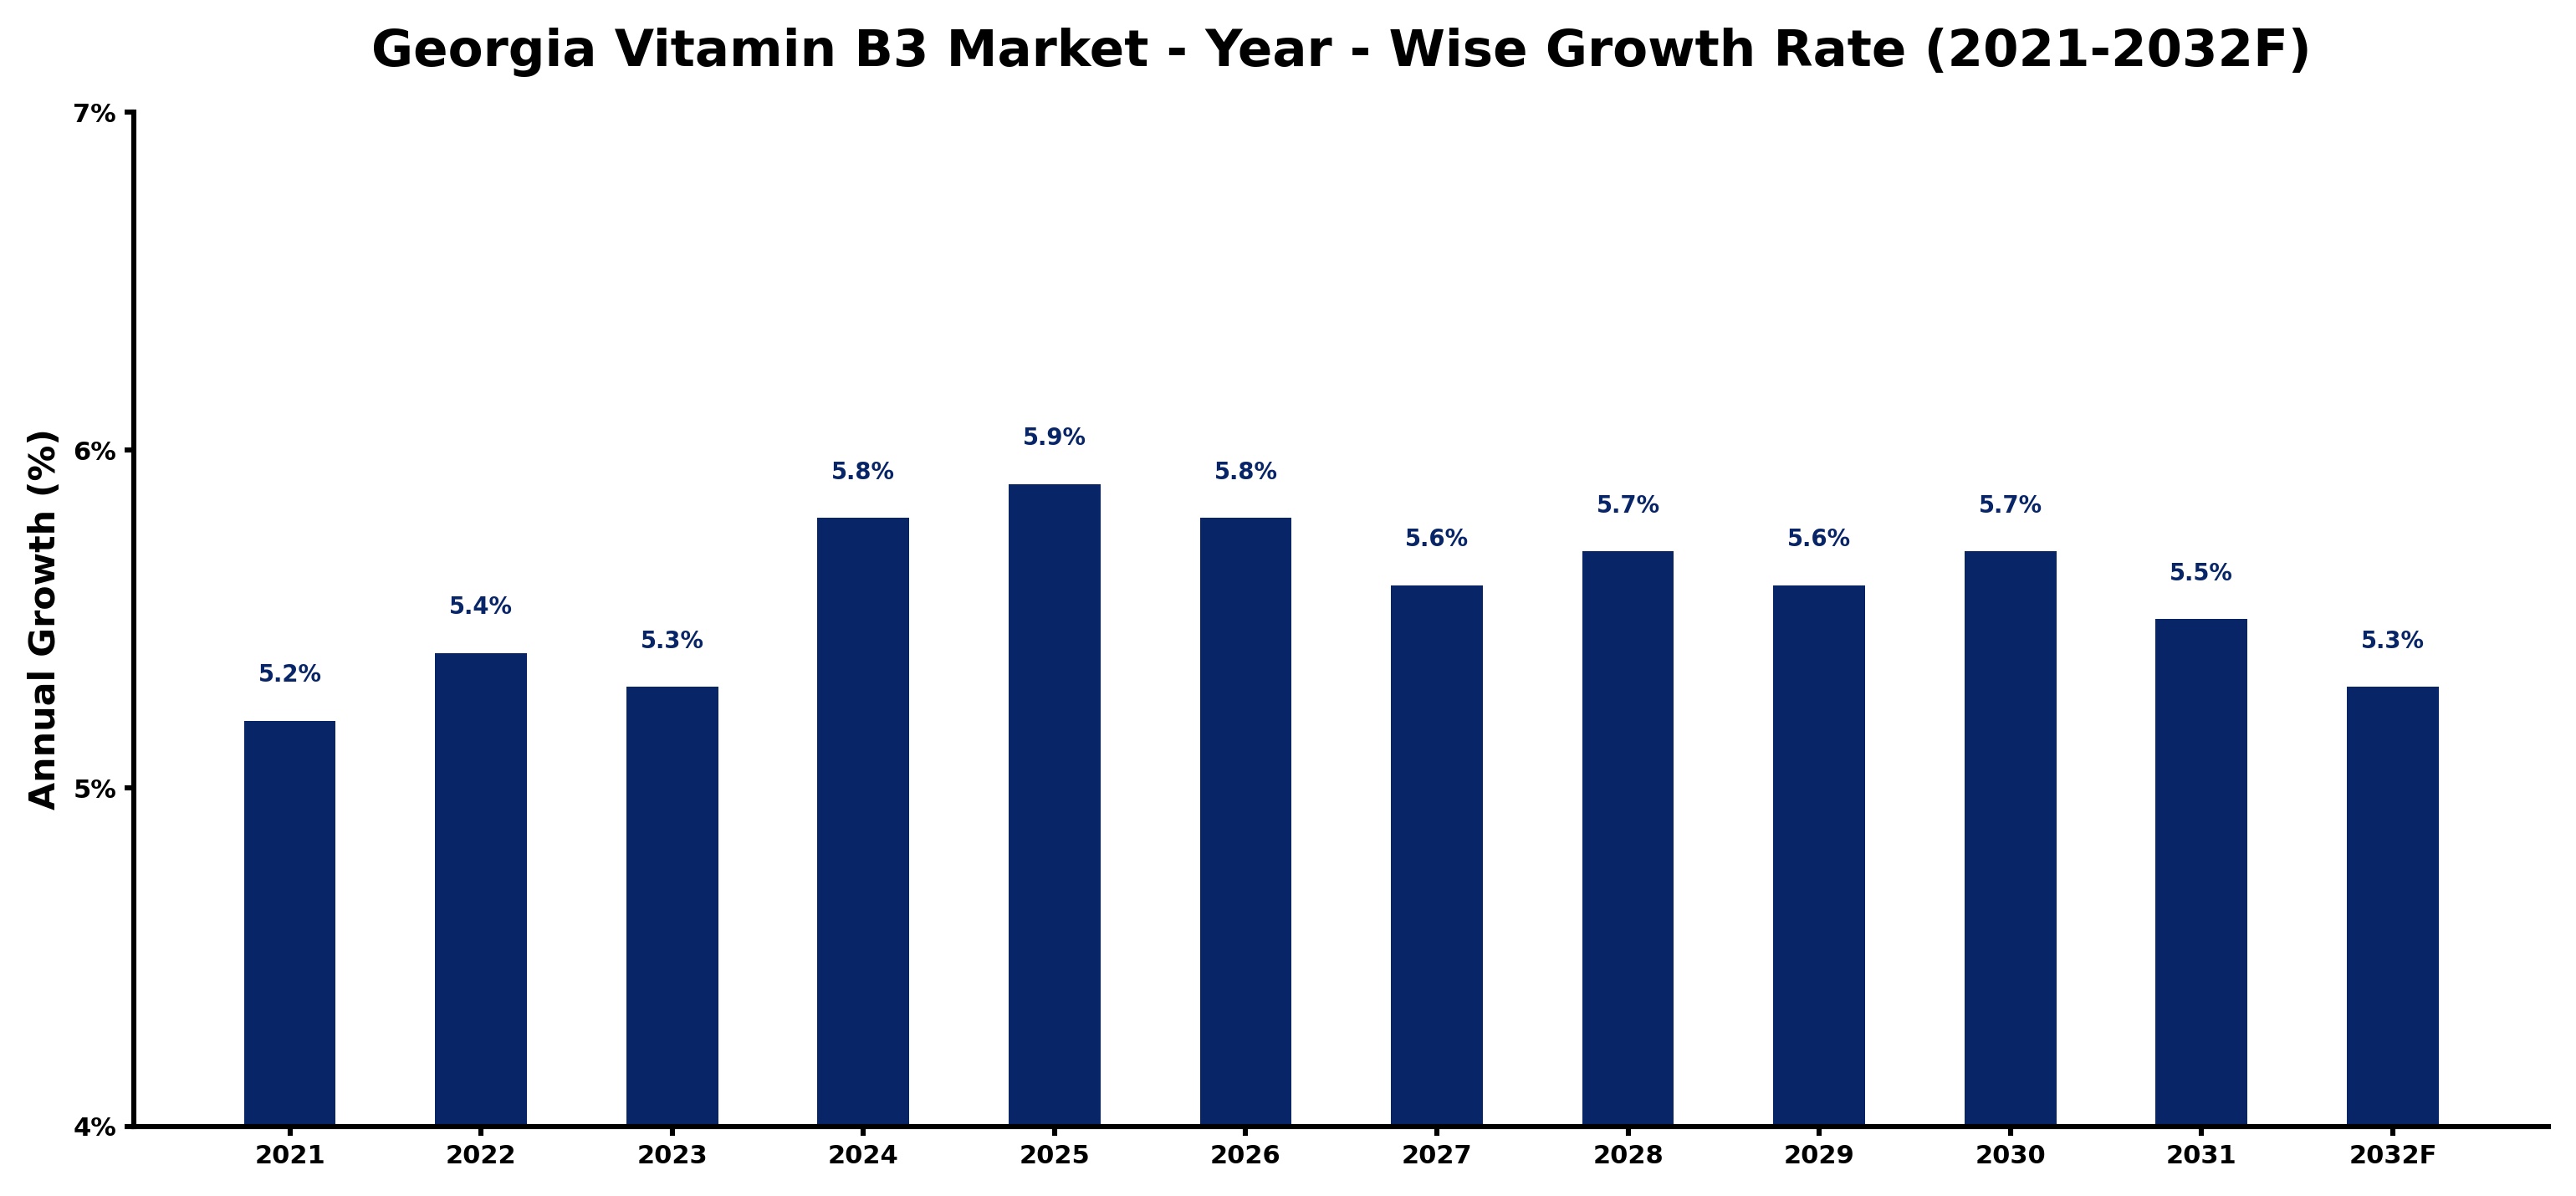
Georgia Vitamin B3 Market Growth Rate Analysis (2021-2032)
The Georgia Vitamin B3 market has exhibited stable growth, with yearly increases of 5.2% in 2021, peaking at 5.9% in 2025. Factors driving this upward trend include rising consumer awareness about nutritional supplements and the expanding applications of Vitamin B3 in pharmaceuticals and cosmetics. The years 2024 and 2025 are particularly noteworthy, reflecting increased investments in health and wellness sectors. Although growth slightly fluctuated to 5.3% in 2023, it rebounded to 5.8% in 2024, indicating robust consumer demand. The overall trajectory remains positive, supported by advancements in digitalization and infrastructure, enabling enhanced distribution channels and product accessibility in Georgia's market landscape.
Georgia Vitamin B3 Market Year-wise Growth Rate and Key Drivers
This graph highlights how the Georgia Vitamin B3 Market has steadily grown over the past five years, supported by major growth factors.
The table below presents the year‑wise growth rates along with the key drivers influencing the market
| Year | Growth Rate | Major Drivers |
| 2021 | 5.2% | Upgraded fermentation technology boosted vitamin B3 production efficiency |
| 2022 | 5.4% | Manufacturing investments boosted vitamin B3 production capacity in Georgia |
| 2023 | 5.3% | New manufacturing plants boost local Vitamin B3 production capacity |
| 2024 | 5.8% | Domestic vitamin B3 production expansion drives supplier sourcing strategies |
| 2025 | 5.9% | Nutraceutical companies boost Vitamin B3 production for domestic market recovery |
| 2026 | 5.8% | Export driven biopharmaceutical investments boosted local Vitamin B3 production capacity |
| 2027 | 5.6% | Improved fermentation technology boosts domestic vitamin B3 production capacity |
| 2028 | 5.7% | Manufacturing investments boosted domestic Vitamin B3 production capacity |
| 2029 | 5.6% | Production efficiency upgrades boosted vitamin B3 extraction capacity |
| 2030 | 5.7% | Manufacturing investments in vitamin B3 drive local supply chain growth |
| 2031 | 5.5% | Local dietary supplement firms boost vitamin B3 manufacturing capacity |
| 2032 | 5.3% | Expanded fermentation capacity boosted vitamin B3 production efficiency |
Note - Market size estimations and growth projections presented in this report are based on 6Wresearch’s advanced forecasting approach, validated with industry datasets as of June 2026.
Georgia Vitamin B3 Market Synopsis
The strongest force currently shaping the Georgia Vitamin B3 Market is the rising consumer demand for health supplements aimed at supporting cardiovascular health and metabolic function. This trend is particularly significant among health-conscious individuals who seek to improve their overall wellness through dietary changes and supplementation.
Moreover, advancements in niacin formulations and their applications across various sectors—including skincare and pharmaceuticals—are also contributing to the dynamic evolution of this market. As consumers become increasingly informed about the antioxidant and anti-inflammatory properties of vitamin B3, the demand for innovative products continues to rise.
Georgia Vitamin B3 Market Key Takeaways
- The market is estimated to reach USD 509 Million by 2032, indicating a robust growth trend.
- Consumer awareness of niacin's health benefits is a key driver of market expansion.
- Growing applications in skincare and personal care products are enhancing market attractiveness.
- Government regulations promoting quality control support industry growth.
- Advancements in bioavailability and formulations are bolstering product offerings.
Evaluation of Restraints in Georgia Vitamin B3 Market
Despite the favorable growth outlook for the Georgia Vitamin B3 Market, certain restraints exist that may hinder its expansion. One primary concern is the potential for misinformation regarding niacin supplementation, which can lead to consumer skepticism. Additionally, competition from alternative supplements and the complexities of regulatory compliance may challenge smaller producers attempting to enter the market. Manufacturers must also navigate the intricate landscape of consumer preferences, which can shift rapidly and affect product demand.
Georgia Vitamin B3 Market Trends
Current trends in the Georgia Vitamin B3 Market reflect a growing inclination towards holistic health solutions. Consumers are increasingly turning to functional foods and dietary supplements that promise not just metabolic support, but also enhanced skin health and aging benefits. Furthermore, there is a noticeable surge in the popularity of niacinamide in beauty and skincare formulations, driven by its proven efficacy in addressing skin concerns such as hyperpigmentation and aging.
Georgia Vitamin B3 Market Opportunities
Opportunities for growth in the Georgia Vitamin B3 Market are abundant, particularly within the realms of innovation in product development and formulation. Companies are encouraged to explore new dosage forms and delivery methods that enhance bioavailability, making it easier for consumers to incorporate vitamin B3 into their daily routines. Furthermore, the burgeoning interest in sustainable and clean-label products presents an avenue for market players to differentiate their offerings and attract environmentally conscious consumers.
Government Initiatives in the Georgia Vitamin B3 Market
Recognizing the importance of vitamin B3 for public health, the government of Georgia has instituted several initiatives aimed at regulating the production and distribution of niacin products. These policies include stringent quality control standards for manufacturing processes, monitoring product labeling to prevent misinformation, and supporting research initiatives focused on the benefits of vitamin B3. Such regulatory frameworks not only enhance consumer safety but also promote confidence in the market.
Future Insights of the Georgia Vitamin B3 Market
Looking ahead to 2026-2032, the Georgia Vitamin B3 Market is poised for significant transformation. The increasing integration of technology in product development, such as personalized supplements and enhanced formulation processes, is expected to elevate consumer engagement. As more individuals recognize the importance of vitamins in preventative health, the market is likely to expand, supported by ongoing education and research into the multifaceted benefits of vitamin B3.
Georgia Vitamin B3 Market Latest Developments (May 2025 - June 2026)
In recent months, the Georgia Vitamin B3 Market has witnessed a surge in interest surrounding innovative product formulations that cater to specific consumer needs, particularly in skincare and cardiovascular health. Research collaborations and product launches have emerged, focusing on the dual benefits of vitamin B3 as both a dietary supplement and a topical skincare ingredient. This trend reflects a broader movement towards comprehensive health and wellness solutions that appeal to a diverse consumer base.
Georgia Vitamin B3 Market - Key Attractiveness of the Report
- 10 Years of Market Numbers
- Historical Data Starting from 2022 to 2025
- Base Year: 2025
- Forecast Data until 2032
- Key Performance Indicators Impacting the Market
- Major Upcoming Developments and Projects
Key Highlights of the Report:
- Georgia Vitamin B3 Market Outlook
- Market Size of Georgia Vitamin B3 Market, 2025
- Forecast of Georgia Vitamin B3 Market, 2032F
- Historical Data and Forecast of Georgia Vitamin B3 Revenues & Volume for the Period 2022-2032F
- Georgia Vitamin B3 Market Trend Evolution
- Georgia Vitamin B3 Market Drivers and Challenges
- Georgia Vitamin B3 Price Trends
- Georgia Vitamin B3 Porter's Five Forces
- Georgia Vitamin B3 Industry Life Cycle
- Historical Data and Forecast of Georgia Vitamin B3 Market Revenues & Volume By Type for the Period 2022-2032F
- Historical Data and Forecast of Georgia Vitamin B3 Market Revenues & Volume By Feed grade for the Period 2022-2032F
- Historical Data and Forecast of Georgia Vitamin B3 Market Revenues & Volume By Nutrition grade for the Period 2022-2032F
- Historical Data and Forecast of Georgia Vitamin B3 Market Revenues & Volume By Source for the Period 2022-2032F
- Historical Data and Forecast of Georgia Vitamin B3 Market Revenues & Volume By Natural for the Period 2022-2032F
- Historical Data and Forecast of Georgia Vitamin B3 Market Revenues & Volume By Synthetic for the Period 2022-2032F
- Historical Data and Forecast of Georgia Vitamin B3 Market Revenues & Volume By Form for the Period 2022-2032F
- Historical Data and Forecast of Georgia Vitamin B3 Market Revenues & Volume By Dry for the Period 2022-2032F
- Historical Data and Forecast of Georgia Vitamin B3 Market Revenues & Volume By Liquid for the Period 2022-2032F
- Historical Data and Forecast of Georgia Vitamin B3 Market Revenues & Volume By Application for the Period 2022-2032F
- Historical Data and Forecast of Georgia Vitamin B3 Market Revenues & Volume By Nutrition for the Period 2022-2032F
- Historical Data and Forecast of Georgia Vitamin B3 Market Revenues & Volume By Consumer for the Period 2022-2032F
- Historical Data and Forecast of Georgia Vitamin B3 Market Revenues & Volume By Agrochemicals for the Period 2022-2032F
- Historical Data and Forecast of Georgia Vitamin B3 Market Revenues & Volume By Pharmaceuticals for the Period 2022-2032F
- Historical Data and Forecast of Georgia Vitamin B3 Market Revenues & Volume By Other applications for the Period 2022-2032F
- Georgia Vitamin B3 Import Export Trade Statistics
- Market Opportunity Assessment By Type
- Market Opportunity Assessment By Source
- Market Opportunity Assessment By Form
- Market Opportunity Assessment By Application
- Georgia Vitamin B3 Top Companies Market Share
- Georgia Vitamin B3 Competitive Benchmarking By Technical and Operational Parameters
- Georgia Vitamin B3 Company Profiles
- Georgia Vitamin B3 Key Strategic Recommendations
Georgia Vitamin B3 Market - Frequently Asked Questions
The increasing consumer awareness regarding the health benefits of niacin, particularly for cardiovascular health and metabolic disorders, is significantly driving the demand. Additionally, trends in skincare and overall wellness have further stimulated interest.
The market is estimated to be USD 368 Million in 2025 and is projected to reach USD 509 Million by 2032, growing at a CAGR of 4.7% from 2026 to 2032. This growth reflects a robust interest in niacin supplementation.
Government initiatives have established quality control standards that enhance consumer safety and confidence. Regulations also ensure that products meet specific health claims, which is crucial for maintaining market integrity.
Yes, emerging trends include the rise in interest for functional foods and supplements, a focus on clean-label products, and innovations in skincare formulations utilizing vitamin B3.
Manufacturers are focusing on developing innovative products that not only enhance bioavailability but also cater to specific health concerns such as aging skin, cardiovascular health, and metabolic support.
6Wresearch actively monitors the Georgia Vitamin B3 Market and publishes its comprehensive annual report, highlighting emerging trends, growth drivers, revenue analysis, and forecast outlook. Our insights help businesses to make data-backed strategic decisions with ongoing market dynamics. Our analysts track relevent industries related to the Georgia Vitamin B3 Market, allowing our clients with actionable intelligence and reliable forecasts tailored to emerging regional needs.
Yes, we provide customisation as per your requirements. To learn more, feel free to contact us on sales@6wresearch.com
1 Executive Summary |
2 Introduction |
2.1 Key Highlights of the Report |
2.2 Report Description |
2.3 Market Scope & Segmentation |
2.4 Research Methodology |
2.5 Assumptions |
3 Georgia Vitamin B3 Market Overview |
3.1 Georgia Country Macro Economic Indicators |
3.2 Georgia Vitamin B3 Market Revenues & Volume, 2022 & 2032F |
3.3 Georgia Vitamin B3 Market - Industry Life Cycle |
3.4 Georgia Vitamin B3 Market - Porter's Five Forces |
3.5 Georgia Vitamin B3 Market Revenues & Volume Share, By Type, 2022 & 2032F |
3.6 Georgia Vitamin B3 Market Revenues & Volume Share, By Source, 2022 & 2032F |
3.7 Georgia Vitamin B3 Market Revenues & Volume Share, By Form, 2022 & 2032F |
3.8 Georgia Vitamin B3 Market Revenues & Volume Share, By Form, 2022 & 2032F |
4 Georgia Vitamin B3 Market Dynamics |
4.1 Impact Analysis |
4.2 Market Drivers |
4.3 Market Restraints |
5 Georgia Vitamin B3 Market Trends |
6 Georgia Vitamin B3 Market, By Types |
6.1 Georgia Vitamin B3 Market, By Type |
6.1.1 Overview and Analysis |
6.1.2 Georgia Vitamin B3 Market Revenues & Volume, By Type, 2022-2032F |
6.1.3 Georgia Vitamin B3 Market Revenues & Volume, By Feed grade, 2022-2032F |
6.1.4 Georgia Vitamin B3 Market Revenues & Volume, By Nutrition grade, 2022-2032F |
6.2 Georgia Vitamin B3 Market, By Source |
6.2.1 Overview and Analysis |
6.2.2 Georgia Vitamin B3 Market Revenues & Volume, By Natural, 2022-2032F |
6.2.3 Georgia Vitamin B3 Market Revenues & Volume, By Synthetic, 2022-2032F |
6.3 Georgia Vitamin B3 Market, By Form |
6.3.1 Overview and Analysis |
6.3.2 Georgia Vitamin B3 Market Revenues & Volume, By Dry, 2022-2032F |
6.3.3 Georgia Vitamin B3 Market Revenues & Volume, By Liquid, 2022-2032F |
6.4 Georgia Vitamin B3 Market, By Application |
6.4.1 Overview and Analysis |
6.4.2 Georgia Vitamin B3 Market Revenues & Volume, By Nutrition, 2022-2032F |
6.4.3 Georgia Vitamin B3 Market Revenues & Volume, By Consumer, 2022-2032F |
6.4.4 Georgia Vitamin B3 Market Revenues & Volume, By Agrochemicals, 2022-2032F |
6.4.5 Georgia Vitamin B3 Market Revenues & Volume, By Pharmaceuticals, 2022-2032F |
6.4.6 Georgia Vitamin B3 Market Revenues & Volume, By Other applications, 2022-2032F |
7 Georgia Vitamin B3 Market Import-Export Trade Statistics |
7.1 Georgia Vitamin B3 Market Export to Major Countries |
7.2 Georgia Vitamin B3 Market Imports from Major Countries |
8 Georgia Vitamin B3 Market Key Performance Indicators |
9 Georgia Vitamin B3 Market - Opportunity Assessment |
9.1 Georgia Vitamin B3 Market Opportunity Assessment, By Type, 2022 & 2032F |
9.2 Georgia Vitamin B3 Market Opportunity Assessment, By Source, 2022 & 2032F |
9.3 Georgia Vitamin B3 Market Opportunity Assessment, By Form, 2022 & 2032F |
9.4 Georgia Vitamin B3 Market Opportunity Assessment, By Application, 2022 & 2032F |
10 Georgia Vitamin B3 Market - Competitive Landscape |
10.1 Georgia Vitamin B3 Market Revenue Share, By Companies, 2025 |
10.2 Georgia Vitamin B3 Market Competitive Benchmarking, By Operating and Technical Parameters |
11 Company Profiles |
12 Recommendations |
13 Disclaimer |
Global Go To Market Strategy - 2030
Export potential enables firms to identify high-growth global markets with greater confidence by combining advanced trade intelligence with a structured quantitative methodology. The framework analyzes emerging demand trends and country-level import patterns while integrating macroeconomic and trade datasets such as GDP and population forecasts, bilateral import–export flows, tariff structures, elasticity differentials between developed and developing economies, geographic distance, and import demand projections. Using weighted trade values from 2020–2024 as the base period to project country-to-country export potential for 2030, these inputs are operationalized through calculated drivers such as gravity model parameters, tariff impact factors, and projected GDP per-capita growth. Through an analysis of hidden potentials, demand hotspots, and market conditions that are most favorable to success, this method enables firms to focus on target countries, maximize returns, and global expansion with data, backed by accuracy.
By factoring in the projected importer demand gap that is currently unmet and could be potential opportunity, it identifies the potential for the Exporter (Country) among 190 countries, against the general trade analysis, which identifies the biggest importer or exporter.
To discover high-growth global markets and optimize your business strategy:
Click Here
Pricing
- Single User License$ 1,995
- Department License$ 2,400
- Site License$ 3,120
- Global License$ 3,795

Leadership Perspectives from Industry Events
Search
Thought Leadership and Analyst Meet


Our Clients
6WResearch In News
- India Air Conditioner Market Set for Strong Rebound in 2026 After Weather-Led Correction and GST-Driven Recovery: 6Wresearch
- ADAS in India: How Automatic Emergency Braking, Blind Spot Detection & Driver Monitoring are Transforming Road Safety
- Doha a strategic location for EV manufacturing hub: IPA Qatar
- Demand for luxury TVs surging in the GCC, says Samsung
- Empowering Growth: The Thriving Journey of Bangladesh’s Cable Industry
- Demand for luxury TVs surging in the GCC, says Samsung
Latest Reports
- Poland Fire Protection Systems Market (2026-2032)
- Cape Verde Portable Hand-Thrown Extinguisher Market (2026-2032)
- Canada Portable Hand-Thrown Extinguisher Market (2026-2032)
- Cameroon Portable Hand-Thrown Extinguisher Market (2026-2032)
- Burundi Portable Hand-Thrown Extinguisher Market (2026-2032)
- Burkina Faso Portable Hand-Thrown Extinguisher Market (2026-2032)
- Bulgaria Portable Hand-Thrown Extinguisher Market (2026-2032)
- Brunei Portable Hand-Thrown Extinguisher Market (2026-2032)
- Botswana Portable Hand-Thrown Extinguisher Market (2026-2032)
- Bosnia and Herzegovina Portable Hand-Thrown Extinguisher Market (2026-2032)
Industry Events and Analyst Meet

HIMTEX 2026

India Refining Summit 2026

India EV Show 2026

EV tech India Expo 2026

Auto Tech Asia 2026
Whitepaper
- Middle East & Africa Commercial Security Market Click here to view more.
- Middle East & Africa Fire Safety Systems & Equipment Market Click here to view more.
- GCC Drone Market Click here to view more.
- Middle East Lighting Fixture Market Click here to view more.
- GCC Physical & Perimeter Security Market Click here to view more.