Germany Captive Power Plant Market (2026-2032) | Industry, Companies, Value, Forecast, Share, Trends, Outlook, Segmentation, Growth, Size & Revenue, Analysis, Competitive Landscape
Market Forecast By Fuel Source (Coal, Gas, Diesel, Renewable, Other Fuel Sources), By Industry (Cement, Steel, Metal & Minerals, Petrochemicals) And Competitive Landscape
| Product Code: ETC7301227 | Publication Date: Sep 2024 | Updated Date: Apr 2026 | Product Type: Market Research Report | |
| Publisher: 6Wresearch | Author: Sumit Sagar | No. of Pages: 75 | No. of Figures: 35 | No. of Tables: 20 |
Germany Captive Power Plant Market Size (2020-2030)
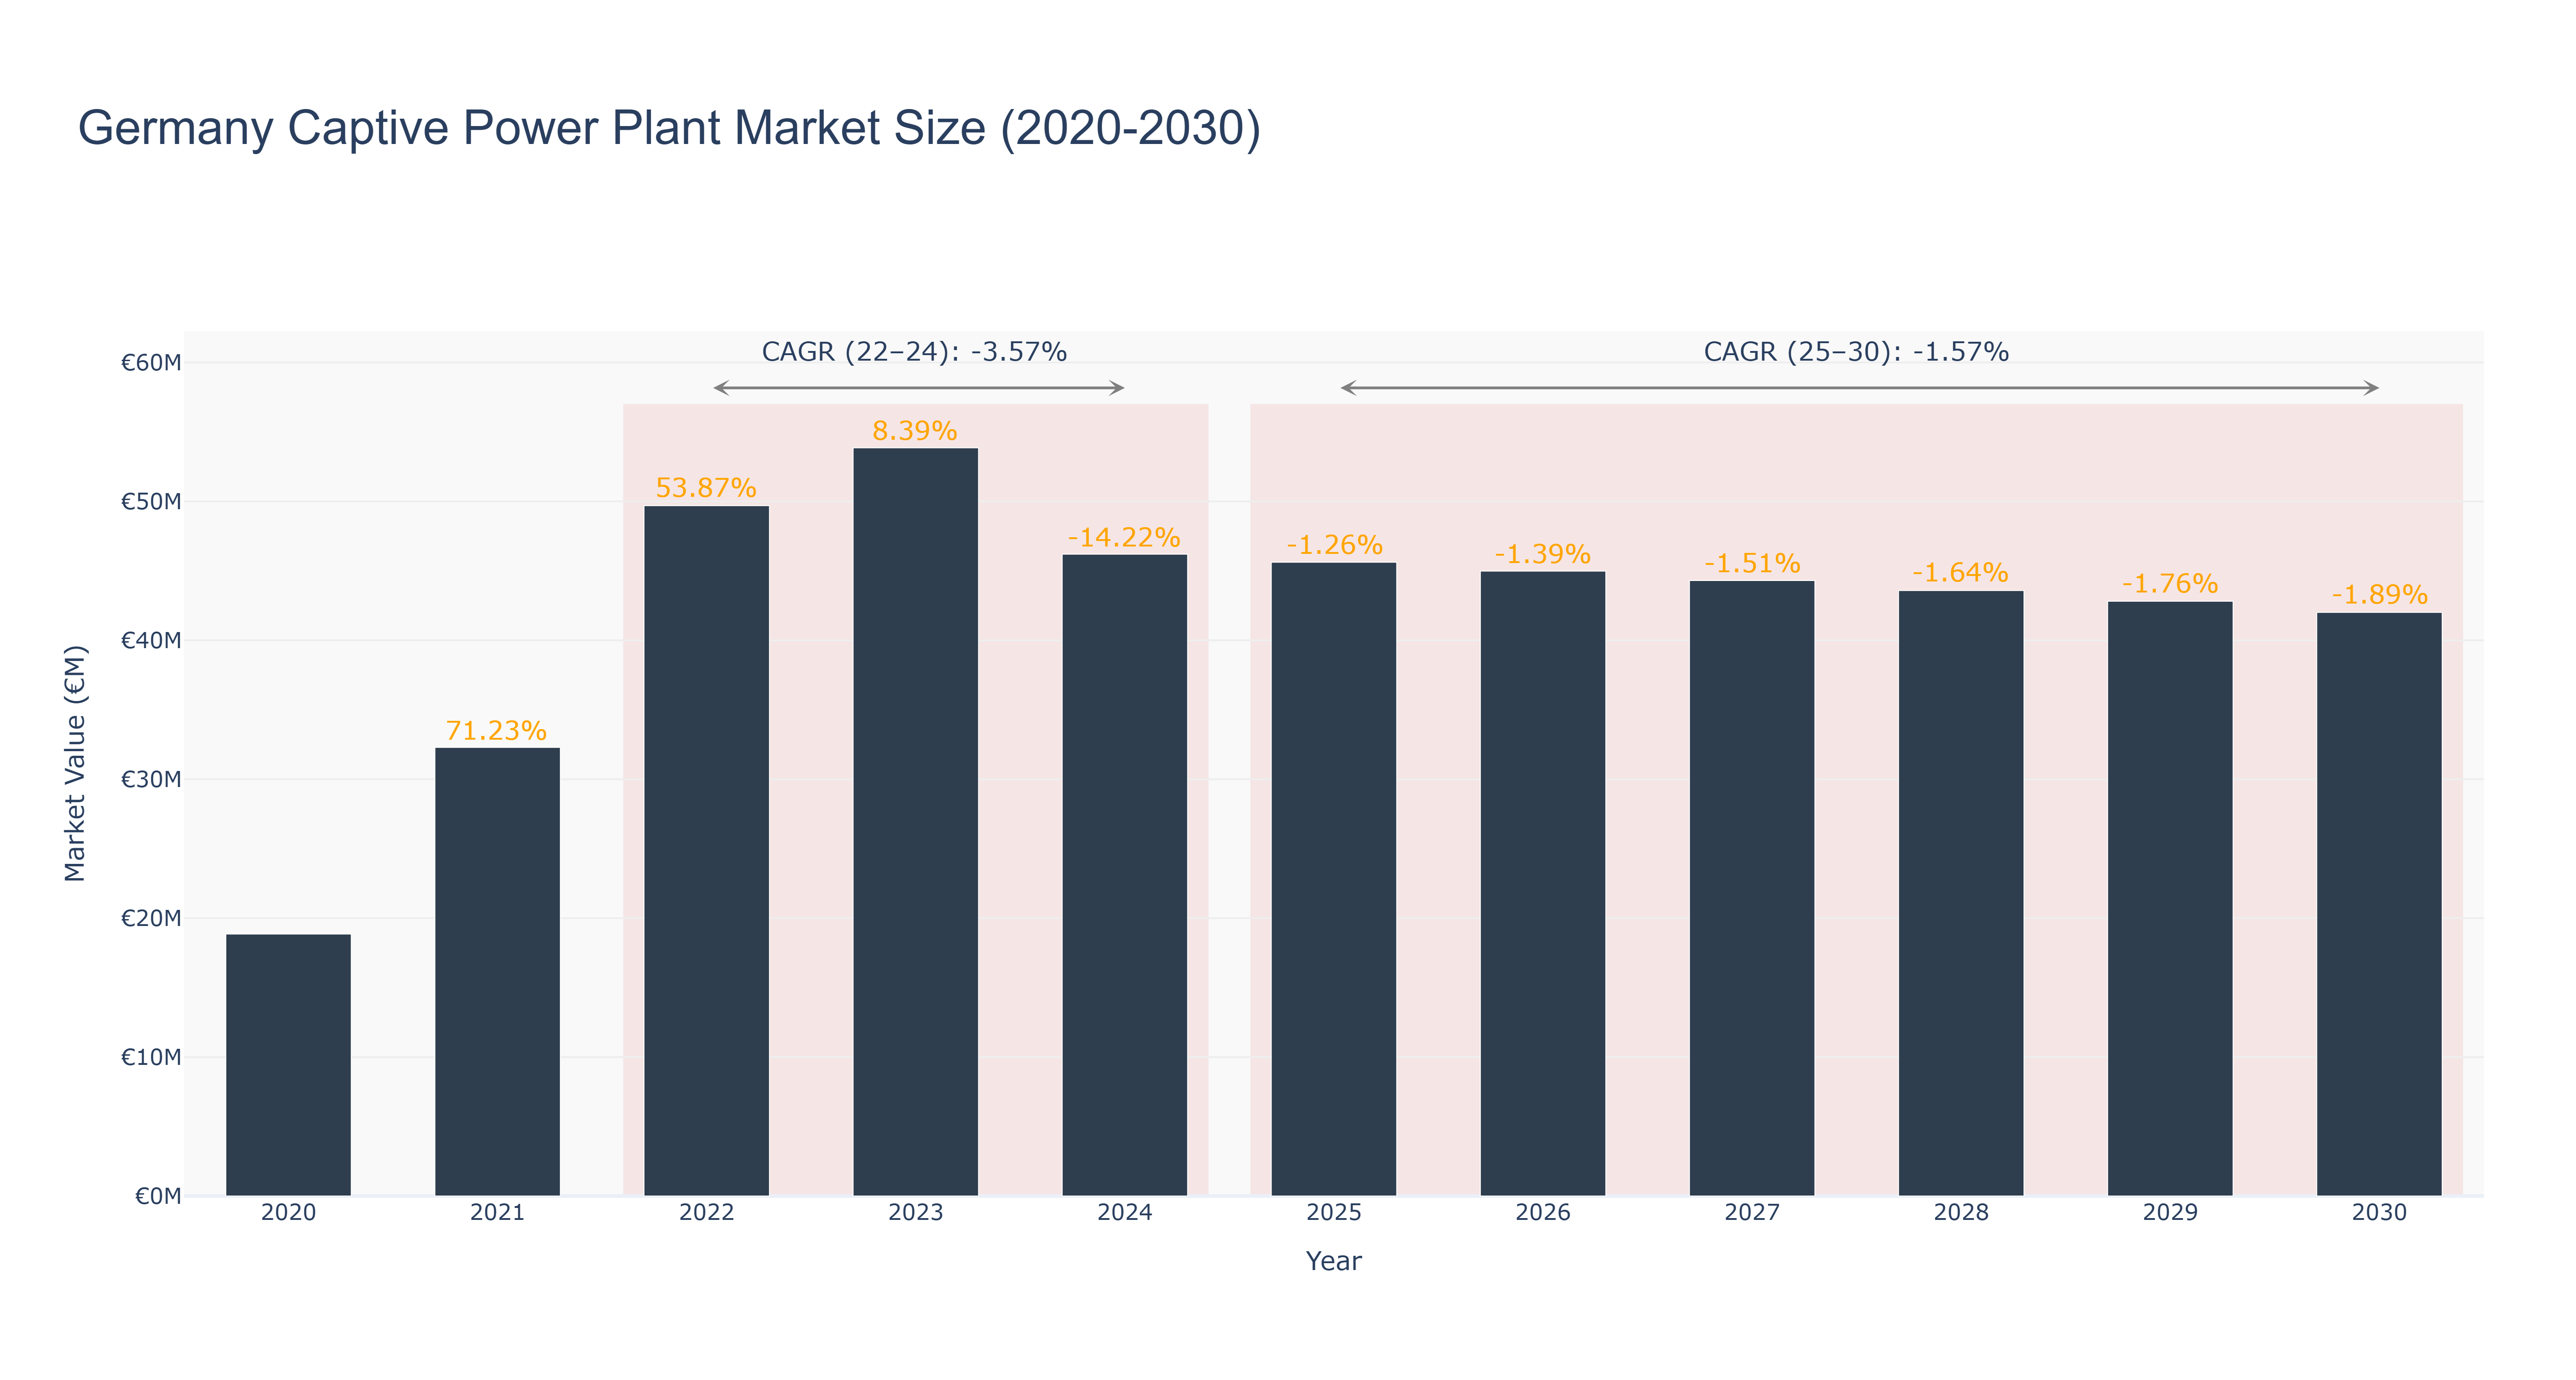
Germany's Captive Power Plant Market experienced a peak market size of €53.86 million in 2023. From 2020 to 2024, the market size saw fluctuations, starting at €18.86 million in 2020 and peaking in 2023 before declining to €46.20 million in 2024. The forecasted market size from 2025 to 2030 shows a continued downward trend, with the market size projected to decrease to €42.01 million in 2030. The CAGR for the period 2022-24 is -3.57%, while for 2025-30, it is -1.57%. The market's decline can be attributed to factors such as regulatory changes impacting investment decisions and the shift towards renewable energy sources. Looking ahead, upcoming projects in Germany's renewable energy sector, including new solar and wind farm installations, are expected to drive further market transformations. Industry drivers include increasing environmental regulations, the focus on sustainability, and advancements in renewable energy technologies. Future developments in the market may involve collaborations between industry players to enhance energy efficiency and explore innovative solutions for captive power generation.
Germany Captive Power Plant Market: Production & Trade Performance (2019-2025)
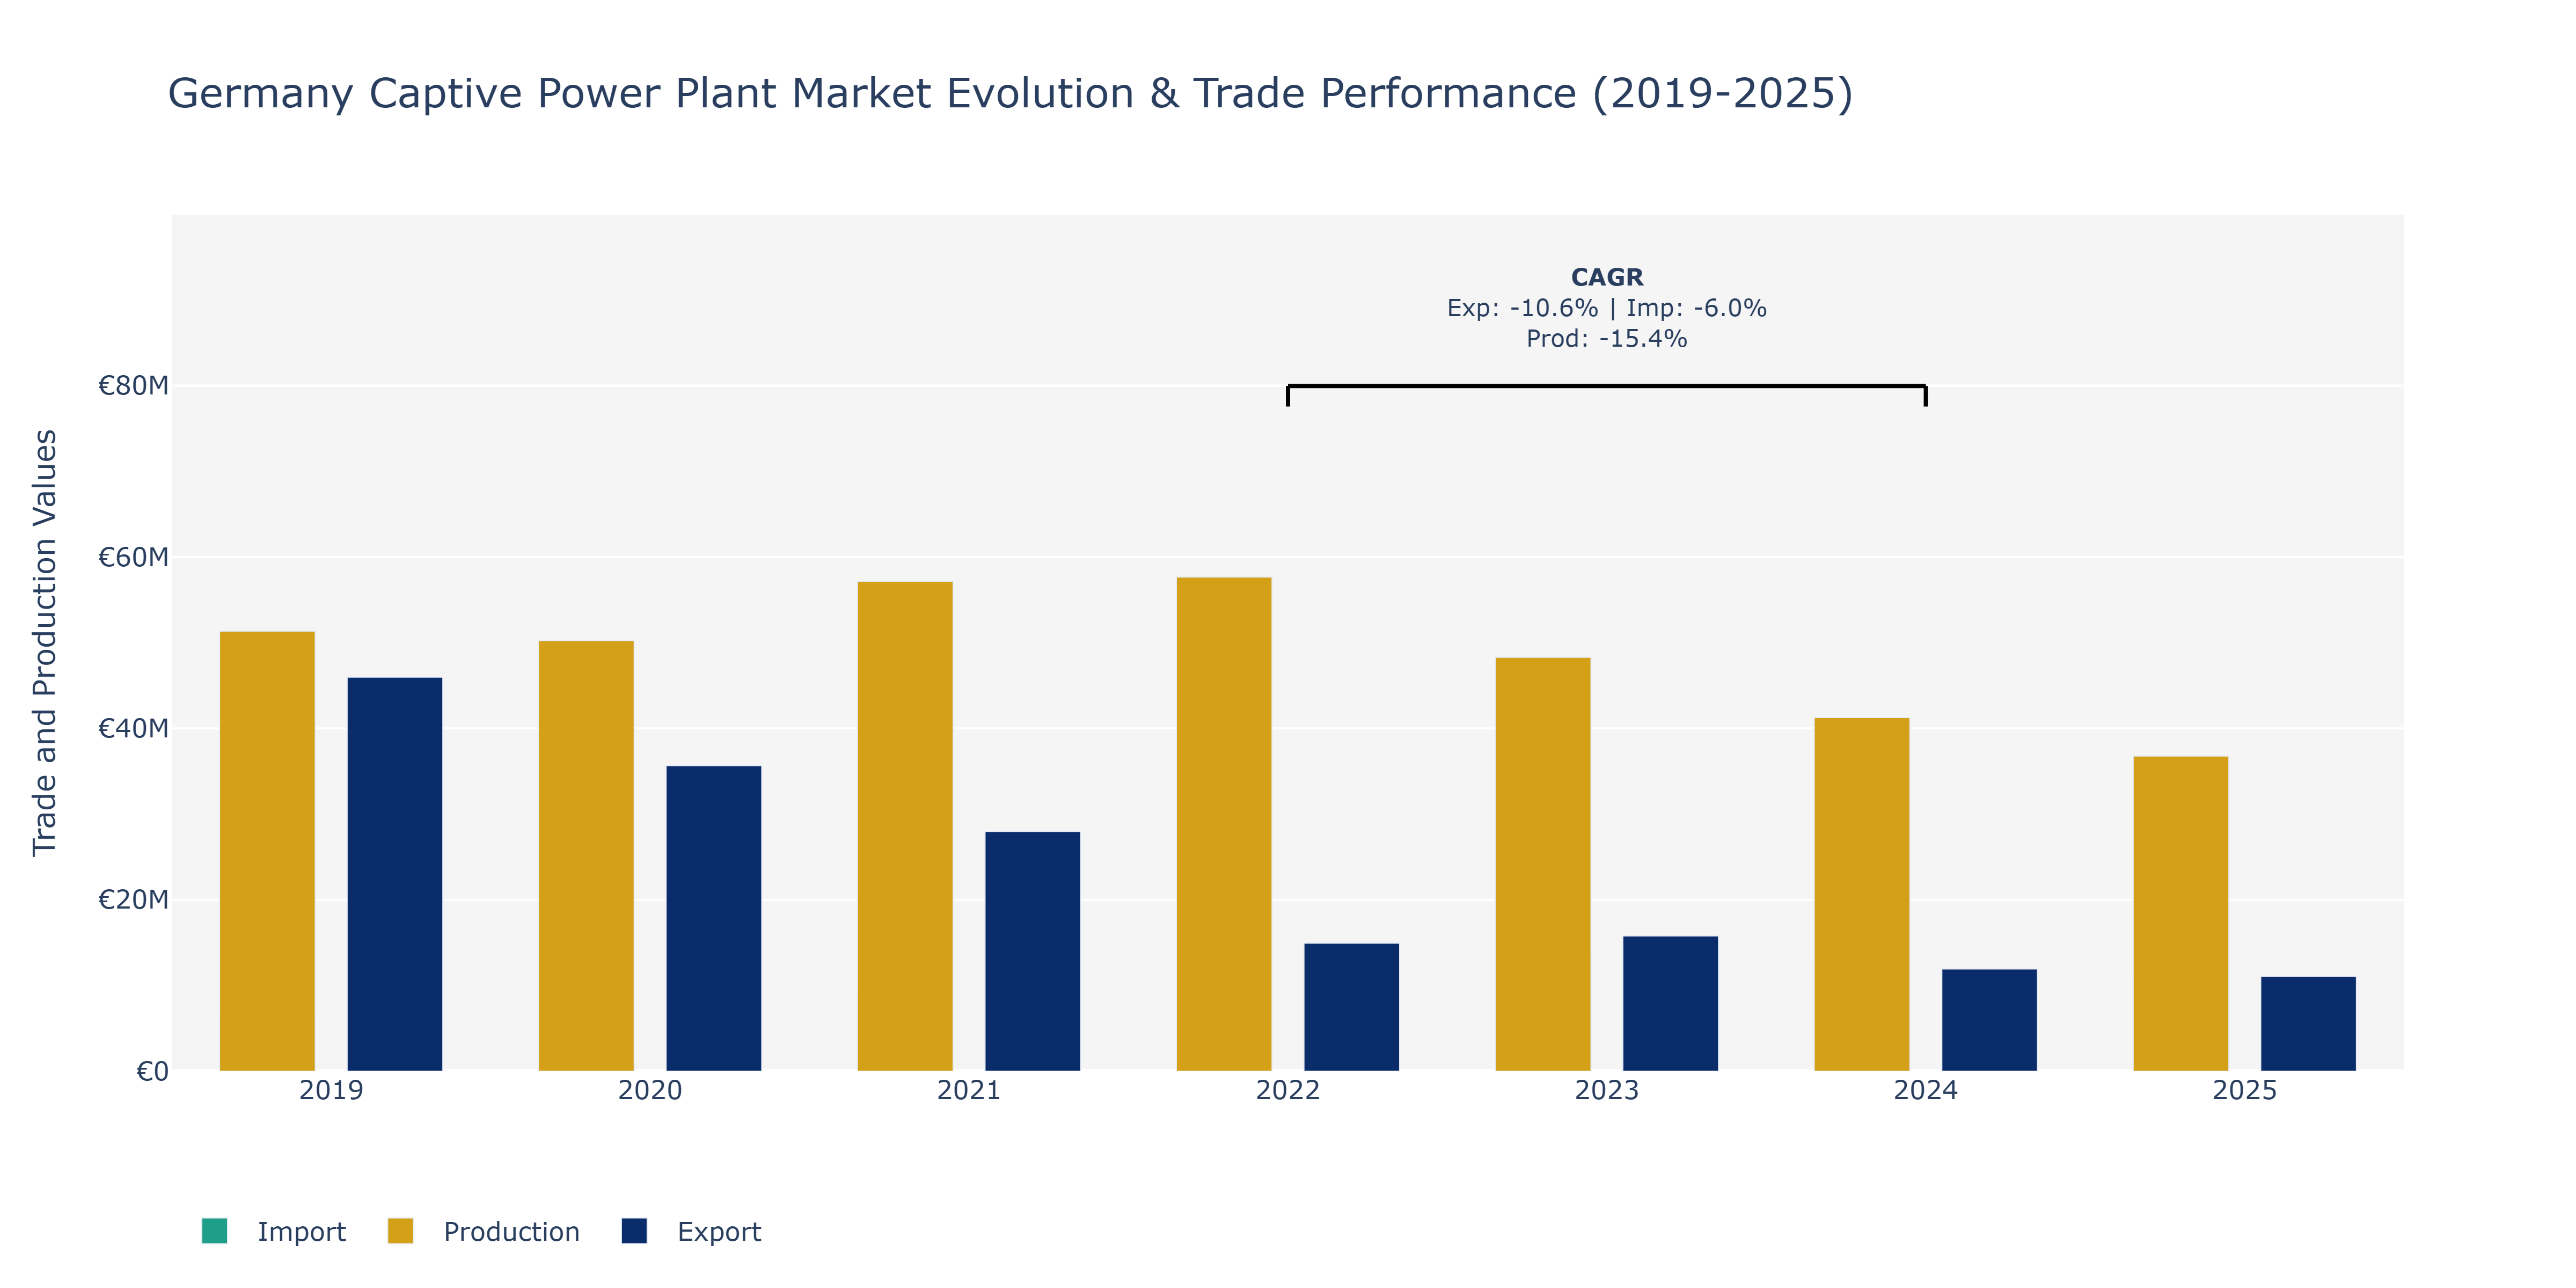
The Germany Captive Power Plant Market exhibited notable variations in Exports, Imports, and Production from 2019 to 2025. Exports experienced a gradual decline from €45.99 million in 2019 to around €11.09 million in 2025, reflecting a reduction in international trade activities within the market. Conversely, Imports demonstrated a fluctuating pattern, reaching a peak of €13.73 million in 2022 before decreasing to approximately €11.73 million in 2025. This variability suggests changing demand dynamics and global supply chain disruptions impacting the influx of foreign goods. Production value followed a downward trajectory, falling from €51.35 million in 2019 to about €36.78 million in 2025, indicating potential challenges in the local manufacturing sector, potentially due to regulatory changes or technological advancements favoring alternative energy sources. These trends align with the market's CAGR data, showcasing a negative growth trend during the specified period. The shifts in these metrics underscore the market's sensitivity to external factors such as regulatory policies, technological advancements, and global economic conditions, highlighting the need for strategic adaptations to ensure competitiveness and sustainability in the Germany Captive Power Plant Market.
Key Highlights of the Report:
- Germany Captive Power Plant Market Outlook
- Market Size of Germany Captive Power Plant Market, 2025
- Forecast of Germany Captive Power Plant Market, 2032
- Historical Data and Forecast of Germany Captive Power Plant Revenues & Volume for the Period 2022-2032F
- Germany Captive Power Plant Market Trend Evolution
- Germany Captive Power Plant Market Drivers and Challenges
- Germany Captive Power Plant Price Trends
- Germany Captive Power Plant Porter's Five Forces
- Germany Captive Power Plant Industry Life Cycle
- Historical Data and Forecast of Germany Captive Power Plant Market Revenues & Volume By Fuel Source for the Period 2022-2032F
- Historical Data and Forecast of Germany Captive Power Plant Market Revenues & Volume By Coal for the Period 2022-2032F
- Historical Data and Forecast of Germany Captive Power Plant Market Revenues & Volume By Gas for the Period 2022-2032F
- Historical Data and Forecast of Germany Captive Power Plant Market Revenues & Volume By Diesel for the Period 2022-2032F
- Historical Data and Forecast of Germany Captive Power Plant Market Revenues & Volume By Renewable for the Period 2022-2032F
- Historical Data and Forecast of Germany Captive Power Plant Market Revenues & Volume By Other Fuel Sources for the Period 2022-2032F
- Historical Data and Forecast of Germany Captive Power Plant Market Revenues & Volume By Industry for the Period 2022-2032F
- Historical Data and Forecast of Germany Captive Power Plant Market Revenues & Volume By Cement for the Period 2022-2032F
- Historical Data and Forecast of Germany Captive Power Plant Market Revenues & Volume By Steel for the Period 2022-2032F
- Historical Data and Forecast of Germany Captive Power Plant Market Revenues & Volume By Metal & Minerals for the Period 2022-2032F
- Historical Data and Forecast of Germany Captive Power Plant Market Revenues & Volume By Petrochemicals for the Period 2022-2032F
- Germany Captive Power Plant Import Export Trade Statistics
- Market Opportunity Assessment By Fuel Source
- Market Opportunity Assessment By Industry
- Germany Captive Power Plant Top Companies Market Share
- Germany Captive Power Plant Competitive Benchmarking By Technical and Operational Parameters
- Germany Captive Power Plant Company Profiles
- Germany Captive Power Plant Key Strategic Recommendations
Frequently Asked Questions About the Market Study (FAQs):
6Wresearch actively monitors the Germany Captive Power Plant Market and publishes its comprehensive annual report, highlighting emerging trends, growth drivers, revenue analysis, and forecast outlook. Our insights help businesses to make data-backed strategic decisions with ongoing market dynamics. Our analysts track relevent industries related to the Germany Captive Power Plant Market, allowing our clients with actionable intelligence and reliable forecasts tailored to emerging regional needs.
Yes, we provide customisation as per your requirements. To learn more, feel free to contact us on sales@6wresearch.com
1 Executive Summary |
2 Introduction |
2.1 Key Highlights of the Report |
2.2 Report Description |
2.3 Market Scope & Segmentation |
2.4 Research Methodology |
2.5 Assumptions |
3 Germany Captive Power Plant Market Overview |
3.1 Germany Country Macro Economic Indicators |
3.2 Germany Captive Power Plant Market Revenues & Volume, 2022 & 2032F |
3.3 Germany Captive Power Plant Market - Industry Life Cycle |
3.4 Germany Captive Power Plant Market - Porter's Five Forces |
3.5 Germany Captive Power Plant Market Revenues & Volume Share, By Fuel Source, 2022 & 2032F |
3.6 Germany Captive Power Plant Market Revenues & Volume Share, By Industry, 2022 & 2032F |
4 Germany Captive Power Plant Market Dynamics |
4.1 Impact Analysis |
4.2 Market Drivers |
4.2.1 Increasing energy costs in Germany |
4.2.2 Growing focus on energy efficiency and sustainability |
4.2.3 Rising demand for uninterrupted power supply |
4.2.4 Government policies promoting the use of captive power plants |
4.2.5 Technological advancements in the power generation sector |
4.3 Market Restraints |
4.3.1 High initial investment costs for setting up captive power plants |
4.3.2 Regulatory challenges and complex permitting processes |
4.3.3 Concerns about environmental impact and emissions |
4.3.4 Competition from traditional power generation sources |
4.3.5 Volatility in fuel prices |
5 Germany Captive Power Plant Market Trends |
6 Germany Captive Power Plant Market, By Types |
6.1 Germany Captive Power Plant Market, By Fuel Source |
6.1.1 Overview and Analysis |
6.1.2 Germany Captive Power Plant Market Revenues & Volume, By Fuel Source, 2022-2032F |
6.1.3 Germany Captive Power Plant Market Revenues & Volume, By Coal, 2022-2032F |
6.1.4 Germany Captive Power Plant Market Revenues & Volume, By Gas, 2022-2032F |
6.1.5 Germany Captive Power Plant Market Revenues & Volume, By Diesel, 2022-2032F |
6.1.6 Germany Captive Power Plant Market Revenues & Volume, By Renewable, 2022-2032F |
6.1.7 Germany Captive Power Plant Market Revenues & Volume, By Other Fuel Sources, 2022-2032F |
6.2 Germany Captive Power Plant Market, By Industry |
6.2.1 Overview and Analysis |
6.2.2 Germany Captive Power Plant Market Revenues & Volume, By Cement, 2022-2032F |
6.2.3 Germany Captive Power Plant Market Revenues & Volume, By Steel, 2022-2032F |
6.2.4 Germany Captive Power Plant Market Revenues & Volume, By Metal & Minerals, 2022-2032F |
6.2.5 Germany Captive Power Plant Market Revenues & Volume, By Petrochemicals, 2022-2032F |
7 Germany Captive Power Plant Market Import-Export Trade Statistics |
7.1 Germany Captive Power Plant Market Export to Major Countries |
7.2 Germany Captive Power Plant Market Imports from Major Countries |
8 Germany Captive Power Plant Market Key Performance Indicators |
8.1 Average capacity utilization rate of captive power plants |
8.2 Percentage of renewable energy sources used in captive power generation |
8.3 Energy cost savings achieved by using captive power plants |
8.4 Number of new installations or expansions of captive power plants |
8.5 Level of compliance with environmental regulations and emission standards |
9 Germany Captive Power Plant Market - Opportunity Assessment |
9.1 Germany Captive Power Plant Market Opportunity Assessment, By Fuel Source, 2022 & 2032F |
9.2 Germany Captive Power Plant Market Opportunity Assessment, By Industry, 2022 & 2032F |
10 Germany Captive Power Plant Market - Competitive Landscape |
10.1 Germany Captive Power Plant Market Revenue Share, By Companies, 2025 |
10.2 Germany Captive Power Plant Market Competitive Benchmarking, By Operating and Technical Parameters |
11 Company Profiles |
12 Recommendations |
13 Disclaimer |
Global Go To Market Strategy - 2030
Export potential enables firms to identify high-growth global markets with greater confidence by combining advanced trade intelligence with a structured quantitative methodology. The framework analyzes emerging demand trends and country-level import patterns while integrating macroeconomic and trade datasets such as GDP and population forecasts, bilateral import–export flows, tariff structures, elasticity differentials between developed and developing economies, geographic distance, and import demand projections. Using weighted trade values from 2020–2024 as the base period to project country-to-country export potential for 2030, these inputs are operationalized through calculated drivers such as gravity model parameters, tariff impact factors, and projected GDP per-capita growth. Through an analysis of hidden potentials, demand hotspots, and market conditions that are most favorable to success, this method enables firms to focus on target countries, maximize returns, and global expansion with data, backed by accuracy.
By factoring in the projected importer demand gap that is currently unmet and could be potential opportunity, it identifies the potential for the Exporter (Country) among 190 countries, against the general trade analysis, which identifies the biggest importer or exporter.
To discover high-growth global markets and optimize your business strategy:
Click Here
Pricing
- Single User License$ 1,995
- Department License$ 2,400
- Site License$ 3,120
- Global License$ 3,795

Leadership Perspectives from Industry Events
Search
Thought Leadership and Analyst Meet


Our Clients
6WResearch In News
- India Export Attractiveness Tracker 2026
- India Air Conditioner Market Set for Strong Rebound in 2026 After Weather-Led Correction and GST-Driven Recovery: 6Wresearch
- ADAS in India: How Automatic Emergency Braking, Blind Spot Detection & Driver Monitoring are Transforming Road Safety
- Doha a strategic location for EV manufacturing hub: IPA Qatar
- Demand for luxury TVs surging in the GCC, says Samsung
- Empowering Growth: The Thriving Journey of Bangladesh’s Cable Industry
Latest Reports
- Qatar Access and Home Network Market (2026-2032)
- Nicaragua RPG Gaming Market (2026-2032)
- New Zealand RPG Gaming Market (2026-2032)
- Netherlands RPG Gaming Market (2026-2032)
- Nauru RPG Gaming Market (2026-2032)
- Namibia RPG Gaming Market (2026-2032)
- Mozambique RPG Gaming Market (2026-2032)
- Montenegro RPG Gaming Market (2026-2032)
- Mongolia RPG Gaming Market (2026-2032)
- Monaco RPG Gaming Market (2026-2032)
Industry Events and Analyst Meet

EV India Expo 2026

HIMTEX 2026

India Refining Summit 2026

India EV Show 2026

EV tech India Expo 2026
Whitepaper
- Middle East & Africa Commercial Security Market Click here to view more.
- Middle East & Africa Fire Safety Systems & Equipment Market Click here to view more.
- GCC Drone Market Click here to view more.
- Middle East Lighting Fixture Market Click here to view more.
- GCC Physical & Perimeter Security Market Click here to view more.