Ghana Energy Saving & Fluorescent Market (2026-2032) | Revenue, Share, Value, Industry, Analysis, Companies, Size, Outlook, Trends, Forecast & Growth
Market Forecast By Sources (High-Intensity Discharge Lamps (HID), Linear Fluorescent Lamps (LFL), Light Emitting Diodes (LED)), By Applications (Commercial, Residential, Government) And Competitive Landscape
| Product Code: ETC005116 | Publication Date: Sep 2020 | Updated Date: Jun 2026 | Product Type: Report | |
| Publisher: 6Wresearch | Author: Ravi Bhandari | No. of Pages: 70 | No. of Figures: 35 | No. of Tables: 5 |
Ghana Energy Saving & Fluorescent Market Summary
The ghana energy saving & fluorescent market was estimated at USD 296 Million in 2025 and is projected to reach USD 394 Million by 2032, growing at a CAGR of 4.7% from 2026 to 2032.
Ghana Energy Saving & Fluorescent Market Growth Rate Analysis (2021-2032)
The Ghana Energy Saving & Fluorescent Market has exhibited steady growth, with an annual increase of 4.8% recorded from 2021 to 2023. This stability reflects rising consumer demand for energy-efficient solutions driven by heightened awareness of sustainability and government initiatives promoting energy transition. A slight uptick to 5.1% in 2024 and 5.2% in 2025 is anticipated as investments in renewable energy infrastructure gain momentum. However, the market is expected to face a slight dip to 4.7% in 2026 due to potential supply chain disruptions. Looking ahead, renewed consumer interest in energy-saving technologies is poised to bolster growth again, with estimates returning to 5.3% by 2031, underscoring the sector's resilience amidst evolving energy policies.
Ghana Energy Saving & Fluorescent Market Year-wise Growth Rate and Key Drivers
This graph highlights how the Ghana Energy Saving & Fluorescent Market has steadily grown over the past five years, supported by major growth factors.
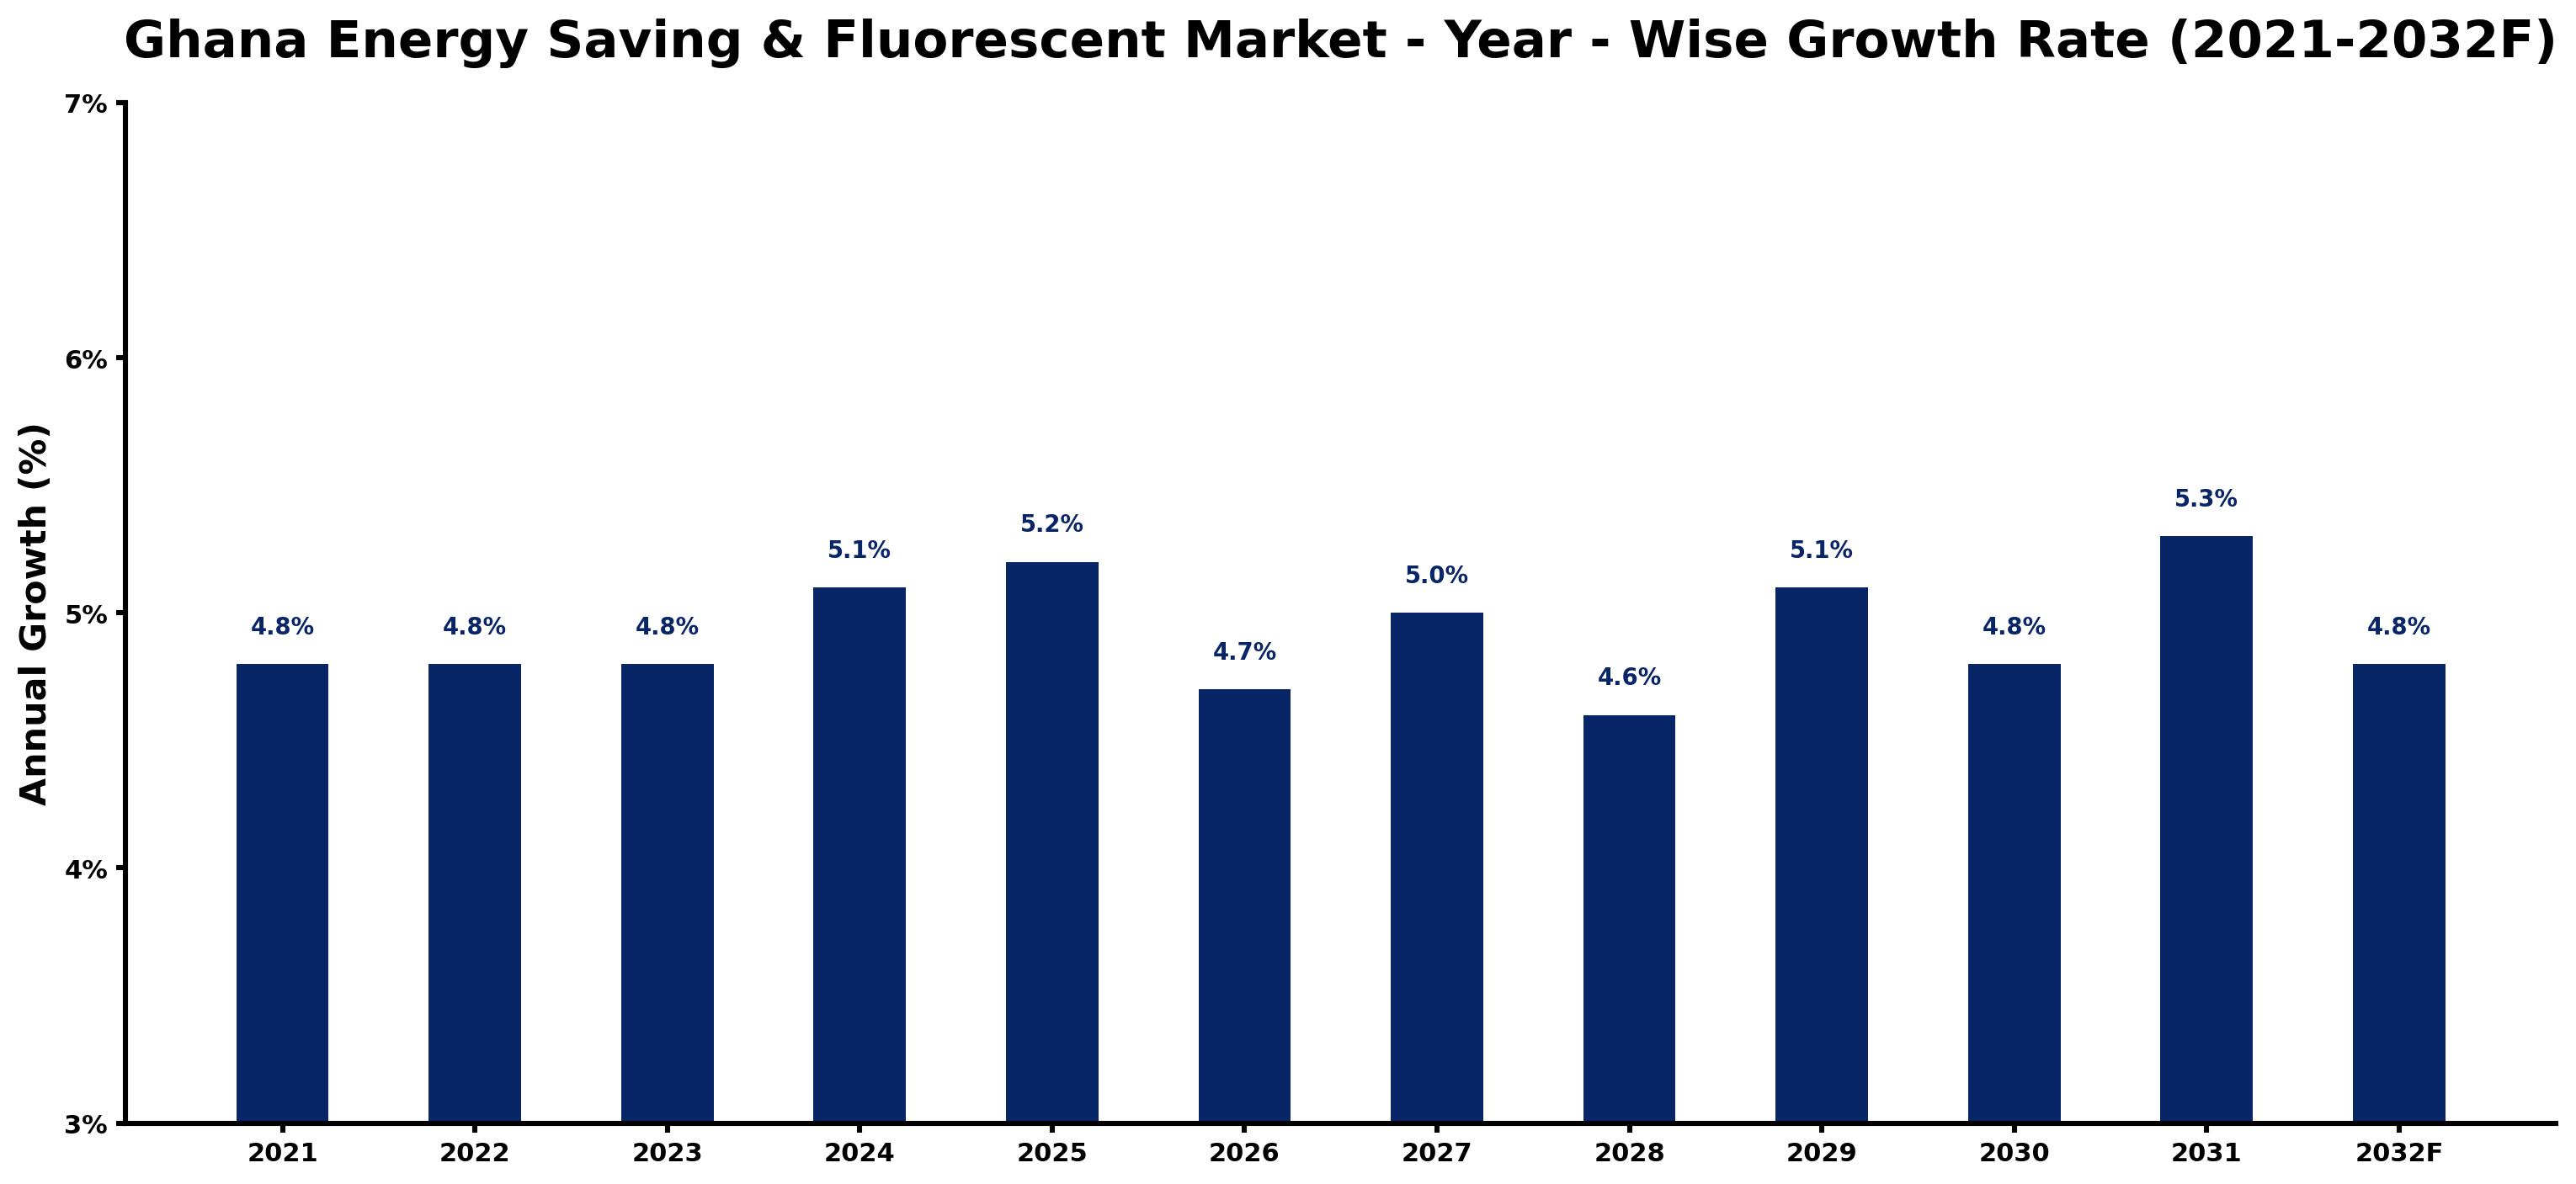
The table below presents the year wise growth rates along with the key drivers influencing the market
| Year | Growth Rate | Major Drivers |
| 2021 | 4.8% | Local manufacturers ramped up production to meet increasing energy efficiency standards in Ghana. |
| 2022 | 4.8% | Consumers increasingly sought affordable lighting options due to rising electricity costs. |
| 2023 | 4.8% | Retail outlets expanded their offerings of energy-efficient products in urban areas. |
| 2024 | 5.1% | Public-private partnerships emerged to promote awareness of energy-saving benefits. |
| 2025 | 5.2% | Investment in renewable energy projects attracted funding for energy-efficient technologies. |
| 2026 | 4.7% | Technological innovations led to the development of more efficient fluorescent lighting solutions. |
| 2027 | 5.0% | Urbanization trends prompted demand for energy-efficient solutions in newly developed housing. |
| 2028 | 4.6% | Community-based initiatives educated households on the long-term savings of energy efficiency. |
| 2029 | 5.1% | Corporate social responsibility efforts highlighted the importance of sustainability in lighting. |
| 2030 | 4.8% | Advancements in LED technology shifted consumer preferences towards more durable lighting options. |
| 2031 | 5.3% | Local governments implemented incentive programs encouraging energy-efficient home upgrades. |
| 2032 | 4.8% | Market consolidation created opportunities for larger players to drive down prices significantly. |
Note - Market size estimations and growth projections presented in this report are based on 6Wresearch's advanced forecasting approach, validated with industry datasets as of June 2026.
Key Highlights of the Report:
- Ghana Energy Saving & Fluorescent Market Outlook
- Market Size of Ghana Energy Saving & Fluorescent Market, 2025
- Forecast of Ghana Energy Saving & Fluorescent Market, 2032F
- Historical Data and Forecast of Ghana Energy Saving & Fluorescent Revenues & Volume for the Period 2022-2032F
- Ghana Energy Saving & Fluorescent Market Trend Evolution
- Ghana Energy Saving & Fluorescent Market Drivers and Challenges
- Ghana Energy Saving & Fluorescent Price Trends
- Ghana Energy Saving & Fluorescent Porter's Five Forces
- Ghana Energy Saving & Fluorescent Industry Life Cycle
- Historical Data and Forecast of Ghana Energy Saving & Fluorescent Market Revenues & Volume By Sources for the Period 2022-2032F
- Historical Data and Forecast of Ghana Energy Saving & Fluorescent Market Revenues & Volume By High-Intensity Discharge Lamps (HID) for the Period 2022-2032F
- Historical Data and Forecast of Ghana Energy Saving & Fluorescent Market Revenues & Volume By Linear Fluorescent Lamps (LFL) for the Period 2022-2032F
- Historical Data and Forecast of Ghana Energy Saving & Fluorescent Market Revenues & Volume By Light Emitting Diodes (LED) for the Period 2022-2032F
- Historical Data and Forecast of Ghana Energy Saving & Fluorescent Market Revenues & Volume By Applications for the Period 2022-2032F
- Historical Data and Forecast of Ghana Energy Saving & Fluorescent Market Revenues & Volume By Commercial for the Period 2022-2032F
- Historical Data and Forecast of Ghana Energy Saving & Fluorescent Market Revenues & Volume By Residential for the Period 2022-2032F
- Historical Data and Forecast of Ghana Energy Saving & Fluorescent Market Revenues & Volume By Government for the Period 2022-2032F
- Ghana Energy Saving & Fluorescent Import Export Trade Statistics
- Market Opportunity Assessment By Sources
- Market Opportunity Assessment By Applications
- Ghana Energy Saving & Fluorescent Top Companies Market Share
- Ghana Energy Saving & Fluorescent Competitive Benchmarking By Technical and Operational Parameters
- Ghana Energy Saving & Fluorescent Company Profiles
- Ghana Energy Saving & Fluorescent Key Strategic Recommendations
Frequently Asked Questions About the Market Study (FAQs):
6Wresearch actively monitors the Ghana Energy Saving & Fluorescent Market and publishes its comprehensive annual report, highlighting emerging trends, growth drivers, revenue analysis, and forecast outlook. Our insights help businesses to make data-backed strategic decisions with ongoing market dynamics. Our analysts track relevent industries related to the Ghana Energy Saving & Fluorescent Market, allowing our clients with actionable intelligence and reliable forecasts tailored to emerging regional needs.
Yes, we provide customisation as per your requirements. To learn more, feel free to contact us on sales@6wresearch.com
1 Executive Summary |
2 Introduction |
2.1 Key Highlights of the Report |
2.2 Report Description |
2.3 Market Scope & Segmentation |
2.4 Research Methodology |
2.5 Assumptions |
3 Ghana Energy Saving & Fluorescent Market Overview |
3.1 Ghana Country Macro Economic Indicators |
3.2 Ghana Energy Saving & Fluorescent Market Revenues & Volume, 2022 & 2032F |
3.3 Ghana Energy Saving & Fluorescent Market - Industry Life Cycle |
3.4 Ghana Energy Saving & Fluorescent Market - Porter's Five Forces |
3.5 Ghana Energy Saving & Fluorescent Market Revenues & Volume Share, By Sources, 2022 & 2032F |
3.6 Ghana Energy Saving & Fluorescent Market Revenues & Volume Share, By Applications, 2022 & 2032F |
4 Ghana Energy Saving & Fluorescent Market Dynamics |
4.1 Impact Analysis |
4.2 Market Drivers |
4.3 Market Restraints |
5 Ghana Energy Saving & Fluorescent Market Trends |
6 Ghana Energy Saving & Fluorescent Market, By Types |
6.1 Ghana Energy Saving & Fluorescent Market, By Sources |
6.1.1 Overview and Analysis |
6.1.2 Ghana Energy Saving & Fluorescent Market Revenues & Volume, By Sources, 2022 - 2032F |
6.1.3 Ghana Energy Saving & Fluorescent Market Revenues & Volume, By High-Intensity Discharge Lamps (HID), 2022 - 2032F |
6.1.4 Ghana Energy Saving & Fluorescent Market Revenues & Volume, By Linear Fluorescent Lamps (LFL), 2022 - 2032F |
6.1.5 Ghana Energy Saving & Fluorescent Market Revenues & Volume, By Light Emitting Diodes (LED), 2022 - 2032F |
6.2 Ghana Energy Saving & Fluorescent Market, By Applications |
6.2.1 Overview and Analysis |
6.2.2 Ghana Energy Saving & Fluorescent Market Revenues & Volume, By Commercial, 2022 - 2032F |
6.2.3 Ghana Energy Saving & Fluorescent Market Revenues & Volume, By Residential, 2022 - 2032F |
6.2.4 Ghana Energy Saving & Fluorescent Market Revenues & Volume, By Government, 2022 - 2032F |
7 Ghana Energy Saving & Fluorescent Market Import-Export Trade Statistics |
7.1 Ghana Energy Saving & Fluorescent Market Export to Major Countries |
7.2 Ghana Energy Saving & Fluorescent Market Imports from Major Countries |
8 Ghana Energy Saving & Fluorescent Market Key Performance Indicators |
9 Ghana Energy Saving & Fluorescent Market - Opportunity Assessment |
9.1 Ghana Energy Saving & Fluorescent Market Opportunity Assessment, By Sources, 2022 & 2032F |
9.2 Ghana Energy Saving & Fluorescent Market Opportunity Assessment, By Applications, 2022 & 2032F |
10 Ghana Energy Saving & Fluorescent Market - Competitive Landscape |
10.1 Ghana Energy Saving & Fluorescent Market Revenue Share, By Companies, 2025 |
10.2 Ghana Energy Saving & Fluorescent Market Competitive Benchmarking, By Operating and Technical Parameters |
11 Company Profiles |
12 Recommendations |
13 Disclaimer |
Global Go To Market Strategy - 2030
Export potential enables firms to identify high-growth global markets with greater confidence by combining advanced trade intelligence with a structured quantitative methodology. The framework analyzes emerging demand trends and country-level import patterns while integrating macroeconomic and trade datasets such as GDP and population forecasts, bilateral import–export flows, tariff structures, elasticity differentials between developed and developing economies, geographic distance, and import demand projections. Using weighted trade values from 2020–2024 as the base period to project country-to-country export potential for 2030, these inputs are operationalized through calculated drivers such as gravity model parameters, tariff impact factors, and projected GDP per-capita growth. Through an analysis of hidden potentials, demand hotspots, and market conditions that are most favorable to success, this method enables firms to focus on target countries, maximize returns, and global expansion with data, backed by accuracy.
By factoring in the projected importer demand gap that is currently unmet and could be potential opportunity, it identifies the potential for the Exporter (Country) among 190 countries, against the general trade analysis, which identifies the biggest importer or exporter.
To discover high-growth global markets and optimize your business strategy:
Click Here
Pricing
- Single User License$ 1,995
- Department License$ 2,400
- Site License$ 3,120
- Global License$ 3,795

Leadership Perspectives from Industry Events
Search
Thought Leadership and Analyst Meet


Our Clients
6WResearch In News
- India Air Conditioner Market Set for Strong Rebound in 2026 After Weather-Led Correction and GST-Driven Recovery: 6Wresearch
- ADAS in India: How Automatic Emergency Braking, Blind Spot Detection & Driver Monitoring are Transforming Road Safety
- Doha a strategic location for EV manufacturing hub: IPA Qatar
- Demand for luxury TVs surging in the GCC, says Samsung
- Empowering Growth: The Thriving Journey of Bangladesh’s Cable Industry
- Demand for luxury TVs surging in the GCC, says Samsung
Latest Reports
- Poland Fire Protection Systems Market (2026-2032)
- Cape Verde Portable Hand-Thrown Extinguisher Market (2026-2032)
- Canada Portable Hand-Thrown Extinguisher Market (2026-2032)
- Cameroon Portable Hand-Thrown Extinguisher Market (2026-2032)
- Burundi Portable Hand-Thrown Extinguisher Market (2026-2032)
- Burkina Faso Portable Hand-Thrown Extinguisher Market (2026-2032)
- Bulgaria Portable Hand-Thrown Extinguisher Market (2026-2032)
- Brunei Portable Hand-Thrown Extinguisher Market (2026-2032)
- Botswana Portable Hand-Thrown Extinguisher Market (2026-2032)
- Bosnia and Herzegovina Portable Hand-Thrown Extinguisher Market (2026-2032)
Industry Events and Analyst Meet

HIMTEX 2026

India Refining Summit 2026

India EV Show 2026

EV tech India Expo 2026

Auto Tech Asia 2026
Whitepaper
- Middle East & Africa Commercial Security Market Click here to view more.
- Middle East & Africa Fire Safety Systems & Equipment Market Click here to view more.
- GCC Drone Market Click here to view more.
- Middle East Lighting Fixture Market Click here to view more.
- GCC Physical & Perimeter Security Market Click here to view more.