Ghana Fire Clay Market (2026-2032) Outlook | Forecast, Growth, Industry, Trends, Value, Size, Revenue, Companies, Analysis & Share
Market Forecast By Product (Flint, Semi-Flint, Semi-Plastic Fire, Plastic Fire), By Application (Fire Bricks, Utensils, Frances, Other), By End User (Residential, Commercial, Industrial, Others) And Competitive Landscape
| Product Code: ETC325016 | Publication Date: Aug 2022 | Updated Date: Jul 2026 | Product Type: Market Research Report | |
| Publisher: 6Wresearch | Author: Shubham Padhi | No. of Pages: 75 | No. of Figures: 35 | No. of Tables: 20 |
Ghana Fire Clay Market Size, Share & Growth Rate
The Ghana Fire Clay Market was estimated at USD 909 Million in 2025 and is projected to reach USD 1303 Million by 2032, growing at a CAGR of 5.3% from 2026 to 2032. This growth trajectory is largely fueled by a surge in infrastructure development and urbanization, which have escalated the demand for fire-resistant materials in construction and manufacturing. Additionally, as industries expand, the need for high-performance ceramic products and refractory solutions is becoming increasingly prominent.
Ghana Fire Clay Market Year-wise Growth Rate and Key Drivers
This graph highlights how the Ghana Fire Clay Market has steadily grown over the years, supported by major growth factors.
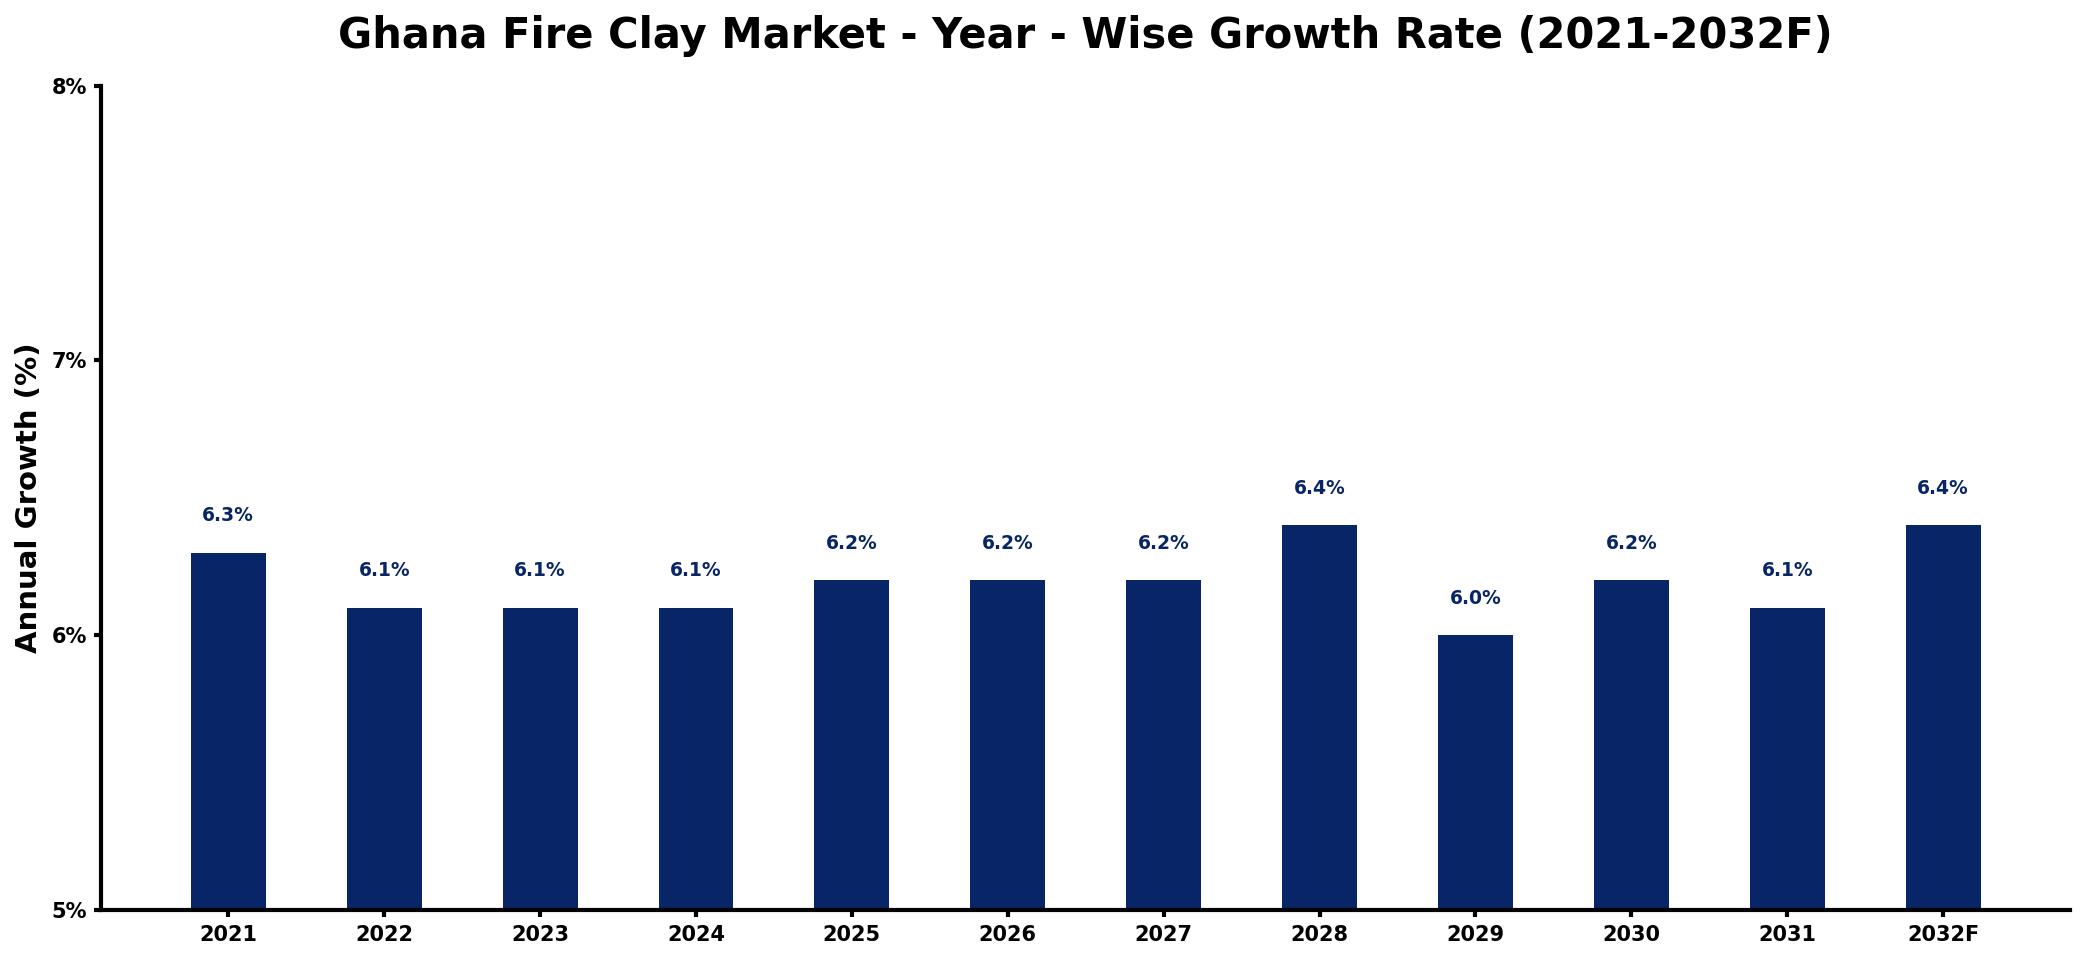
The table below presents the year‑wise growth rates along with the key drivers influencing the market
| Year | Growth Rate | Major Drivers |
| 2021 | 6.3% | Construction sector demand surge |
| 2022 | 6.1% | Increased infrastructure projects funding |
| 2023 | 6.1% | Rising industrial applications expansion |
| 2024 | 6.1% | Growing export market opportunities |
| 2025 | 6.2% | Investment in manufacturing technologies |
| 2026 | 6.2% | Higher domestic consumption rates |
| 2027 | 6.2% | Emerging markets driving demand |
| 2028 | 6.4% | Sustainable building materials adoption |
| 2029 | 6.0% | Revitalized urban development initiatives |
| 2030 | 6.2% | Technological advancements in production |
| 2031 | 6.1% | Enhanced regulatory support initiatives |
| 2032 | 6.4% | Diversification of application sectors |
Note: Market size estimations and growth projections presented in this report are based on 6Wresearch's proprietary forecasting methodology, utilizing the latest available industry data, government publications, and primary research inputs.
Ghana Fire Clay Market Synopsis
In Ghana, the fire clay market is currently on an upward trajectory, reflecting the nations robust industrial growth and ambitious infrastructure projects. This material, prized for its high alumina content, is vital in producing firebricks and ceramics that can withstand extreme temperatures.
Moreover, the demand for fire clay is not only driven by traditional industries such as metallurgy and ceramics but also increasingly by modern applications in energy-efficient technologies. As Ghana works to modernize its industrial framework, fire clay plays a crucial role in ensuring durability and performance across various high-temperature applications.
Ghana Fire Clay Market Key Takeaways
- The market is driven by growing industrial activities and urbanization in Ghana.
- Fire clay's properties, including thermal insulation and durability, are essential for high-temperature applications.
- Environmental regulations are presenting challenges in clay mining and processing operations.
- Government initiatives are facilitating exploration and sustainable practices in the fire clay sector.
- Investment opportunities abound, particularly in innovative applications and processing technologies.
Evaluation of Restraints in Ghana Fire Clay Market
The Ghana Fire Clay Market faces notable restraints that could impede its full potential. Environmental regulations aimed at promoting sustainable mining practices can pose operational challenges for producers. As these regulations evolve, compliance costs may rise, creating hurdles for both established and new entrants. Furthermore, maintaining product quality and consistency is vital for manufacturers, yet it can be a complex task given the variability in raw material sources. Such quality control issues can lead to reliability concerns among end-users in sectors reliant on high-performance fire clay products.
Ghana Fire Clay Market Trends
Several trends are shaping the Ghana Fire Clay Market, reflecting both domestic needs and global influences. There is a marked increase in the application of fire clay products in eco-friendly and energy-efficient construction practices. This shift is largely driven by the growing emphasis on sustainability in the construction sector. Additionally, advancements in processing technologies are facilitating the production of higher quality, more specialized fire clay products, which can meet the evolving demands of industries.
Ghana Fire Clay Market Opportunities
The market presents significant growth and investment opportunities, particularly in the realms of research and development. Companies focusing on innovating fire clay applications, such as lightweight refractory materials and advanced ceramics, stand to gain from the increasing industrial demand. Additionally, as Ghana continues to develop its infrastructure, opportunities for collaboration between governmental initiatives and private sector investments in fire clay extraction and processing will create new avenues for market expansion.
Government Initiatives in the Ghana Fire Clay Market
The government of Ghana is actively promoting the development of the fire clay market through various supportive policies. These initiatives include providing incentives for the exploration and extraction of fire clay deposits and investing in infrastructure that enhances processing and refining operations. Additionally, the government is fostering an environment conducive to research and development, encouraging innovation that can lead to the creation of superior fire clay products and applications.
Future Insights of the Ghana Fire Clay Market
Looking ahead to 2026-2032, the Ghana Fire Clay Market is poised for robust growth, driven by continued industrialization and infrastructure development. The increasing focus on sustainable materials in construction and manufacturing will likely encourage the adoption of fire clay products. Furthermore, advancements in technology and processing methodologies will enhance product offerings, ensuring that the market meets both current and future demands.
Ghana Fire Clay Market Latest Developments (2025 - 2026)
Recent developments in the Ghana Fire Clay Market indicate a growing emphasis on sustainability within the sector. New projects are focusing on sustainable mining practices, aiming to minimize environmental impacts. Additionally, collaborations between industry stakeholders are becoming more common, targeting innovations in product development and application strategies to meet the evolving demands of the manufacturing and construction industries.
Ghana Fire Clay Market - Key Attractiveness of the Report
- 10 Years of Market Numbers
- Historical Data Starting from 2022 to 2025
- Base Year: 2025
- Forecast Data until 2032
- Key Performance Indicators Impacting the Market
- Major Upcoming Developments and Projects
Key Highlights of the Report:
- Ghana Fire Clay Market Outlook
- Market Size of Ghana Fire Clay Market, 2025
- Forecast of Ghana Fire Clay Market, 2032
- Historical Data and Forecast of Ghana Fire Clay Revenues & Volume for the Period 2022-2032F
- Ghana Fire Clay Market Trend Evolution
- Ghana Fire Clay Market Drivers and Challenges
- Ghana Fire Clay Price Trends
- Ghana Fire Clay Porter's Five Forces
- Ghana Fire Clay Industry Life Cycle
- Historical Data and Forecast of Ghana Fire Clay Market Revenues & Volume By Product for the Period 2022-2032F
- Historical Data and Forecast of Ghana Fire Clay Market Revenues & Volume By Flint for the Period 2022-2032F
- Historical Data and Forecast of Ghana Fire Clay Market Revenues & Volume By Semi-Flint for the Period 2022-2032F
- Historical Data and Forecast of Ghana Fire Clay Market Revenues & Volume By Semi-Plastic Fire for the Period 2022-2032F
- Historical Data and Forecast of Ghana Fire Clay Market Revenues & Volume By Plastic Fire for the Period 2022-2032F
- Historical Data and Forecast of Ghana Fire Clay Market Revenues & Volume By Application for the Period 2022-2032F
- Historical Data and Forecast of Ghana Fire Clay Market Revenues & Volume By Fire Bricks for the Period 2022-2032F
- Historical Data and Forecast of Ghana Fire Clay Market Revenues & Volume By Utensils for the Period 2022-2032F
- Historical Data and Forecast of Ghana Fire Clay Market Revenues & Volume By Frances for the Period 2022-2032F
- Historical Data and Forecast of Ghana Fire Clay Market Revenues & Volume By Other for the Period 2022-2032F
- Historical Data and Forecast of Ghana Fire Clay Market Revenues & Volume By End User for the Period 2022-2032F
- Historical Data and Forecast of Ghana Fire Clay Market Revenues & Volume By Residential for the Period 2022-2032F
- Historical Data and Forecast of Ghana Fire Clay Market Revenues & Volume By Commercial for the Period 2022-2032F
- Historical Data and Forecast of Ghana Fire Clay Market Revenues & Volume By Industrial for the Period 2022-2032F
- Historical Data and Forecast of Ghana Fire Clay Market Revenues & Volume By Others for the Period 2022-2032F
- Ghana Fire Clay Import Export Trade Statistics
- Market Opportunity Assessment By Product
- Market Opportunity Assessment By Application
- Market Opportunity Assessment By End User
- Ghana Fire Clay Top Companies Market Share
- Ghana Fire Clay Competitive Benchmarking By Technical and Operational Parameters
- Ghana Fire Clay Company Profiles
- Ghana Fire Clay Key Strategic Recommendations
Frequently Asked Questions About the Market Study (FAQs):
The market was estimated at USD 909 Million in 2025 and is projected to reach USD 1303 Million by 2032, growing at a CAGR of 5.3% from 2026 to 2032. This growth is driven by industrial expansion and rising demand for heat-resistant materials.
The demand for fire clay products in Ghana is largely driven by construction and industrial activities, particularly in metallurgy, ceramics, and refractory applications.
Manufacturers often grapple with maintaining quality control and addressing sustainability concerns in mining practices, which can impact the overall reliability of fire clay products.
The Ghanaian government has initiated various policies to support the fire clay market, including incentives for exploration, investment in processing technologies, and a focus on promoting research and development.
Fire clay is primarily used in producing refractory bricks, ceramics, and heat-resistant coatings, particularly in high-temperature environments such as kilns and furnaces.
6Wresearch actively monitors the Ghana Fire Clay Market and publishes its comprehensive annual report, highlighting emerging trends, growth drivers, revenue analysis, and forecast outlook. Our insights help businesses to make data-backed strategic decisions with ongoing market dynamics. Our analysts track relevent industries related to the Ghana Fire Clay Market, allowing our clients with actionable intelligence and reliable forecasts tailored to emerging regional needs.
Yes, we provide customisation as per your requirements. To learn more, feel free to contact us on sales@6wresearch.com
1 Executive Summary |
2 Introduction |
2.1 Key Highlights of the Report |
2.2 Report Description |
2.3 Market Scope & Segmentation |
2.4 Research Methodology |
2.5 Assumptions |
3 Ghana Fire Clay Market Overview |
3.1 Ghana Country Macro Economic Indicators |
3.2 Ghana Fire Clay Market Revenues & Volume, 2022 & 2032F |
3.3 Ghana Fire Clay Market - Industry Life Cycle |
3.4 Ghana Fire Clay Market - Porter's Five Forces |
3.5 Ghana Fire Clay Market Revenues & Volume Share, By Product, 2022 & 2032F |
3.6 Ghana Fire Clay Market Revenues & Volume Share, By Application, 2022 & 2032F |
3.7 Ghana Fire Clay Market Revenues & Volume Share, By End User, 2022 & 2032F |
4 Ghana Fire Clay Market Dynamics |
4.1 Impact Analysis |
4.2 Market Drivers |
4.2.1 Increasing demand for fire clay in construction and industrial sectors |
4.2.2 Growth in infrastructure development projects in Ghana |
4.2.3 Rising focus on sustainable and energy-efficient building materials |
4.3 Market Restraints |
4.3.1 Fluctuating prices of raw materials impacting production costs |
4.3.2 Competition from alternative materials like refractory bricks |
4.3.3 Regulatory challenges related to environmental standards and mining practices |
5 Ghana Fire Clay Market Trends |
6 Ghana Fire Clay Market, By Types |
6.1 Ghana Fire Clay Market, By Product |
6.1.1 Overview and Analysis |
6.1.2 Ghana Fire Clay Market Revenues & Volume, By Product, 2022-2032F |
6.1.3 Ghana Fire Clay Market Revenues & Volume, By Flint, 2022-2032F |
6.1.4 Ghana Fire Clay Market Revenues & Volume, By Semi-Flint, 2022-2032F |
6.1.5 Ghana Fire Clay Market Revenues & Volume, By Semi-Plastic Fire, 2022-2032F |
6.1.6 Ghana Fire Clay Market Revenues & Volume, By Plastic Fire, 2022-2032F |
6.2 Ghana Fire Clay Market, By Application |
6.2.1 Overview and Analysis |
6.2.2 Ghana Fire Clay Market Revenues & Volume, By Fire Bricks, 2022-2032F |
6.2.3 Ghana Fire Clay Market Revenues & Volume, By Utensils, 2022-2032F |
6.2.4 Ghana Fire Clay Market Revenues & Volume, By Frances, 2022-2032F |
6.2.5 Ghana Fire Clay Market Revenues & Volume, By Other, 2022-2032F |
6.3 Ghana Fire Clay Market, By End User |
6.3.1 Overview and Analysis |
6.3.2 Ghana Fire Clay Market Revenues & Volume, By Residential, 2022-2032F |
6.3.3 Ghana Fire Clay Market Revenues & Volume, By Commercial, 2022-2032F |
6.3.4 Ghana Fire Clay Market Revenues & Volume, By Industrial, 2022-2032F |
6.3.5 Ghana Fire Clay Market Revenues & Volume, By Others, 2022-2032F |
7 Ghana Fire Clay Market Import-Export Trade Statistics |
7.1 Ghana Fire Clay Market Export to Major Countries |
7.2 Ghana Fire Clay Market Imports from Major Countries |
8 Ghana Fire Clay Market Key Performance Indicators |
8.1 Percentage of construction projects using fire clay in Ghana |
8.2 Investment in infrastructure projects utilizing fire clay products |
8.3 Adoption rate of sustainable practices in the fire clay mining industry |
9 Ghana Fire Clay Market - Opportunity Assessment |
9.1 Ghana Fire Clay Market Opportunity Assessment, By Product, 2022 & 2032F |
9.2 Ghana Fire Clay Market Opportunity Assessment, By Application, 2022 & 2032F |
9.3 Ghana Fire Clay Market Opportunity Assessment, By End User, 2022 & 2032F |
10 Ghana Fire Clay Market - Competitive Landscape |
10.1 Ghana Fire Clay Market Revenue Share, By Companies, 2025 |
10.2 Ghana Fire Clay Market Competitive Benchmarking, By Operating and Technical Parameters |
11 Company Profiles |
12 Recommendations |
13 Disclaimer |
Global Go To Market Strategy - 2030
Export potential enables firms to identify high-growth global markets with greater confidence by combining advanced trade intelligence with a structured quantitative methodology. The framework analyzes emerging demand trends and country-level import patterns while integrating macroeconomic and trade datasets such as GDP and population forecasts, bilateral import–export flows, tariff structures, elasticity differentials between developed and developing economies, geographic distance, and import demand projections. Using weighted trade values from 2020–2024 as the base period to project country-to-country export potential for 2030, these inputs are operationalized through calculated drivers such as gravity model parameters, tariff impact factors, and projected GDP per-capita growth. Through an analysis of hidden potentials, demand hotspots, and market conditions that are most favorable to success, this method enables firms to focus on target countries, maximize returns, and global expansion with data, backed by accuracy.
By factoring in the projected importer demand gap that is currently unmet and could be potential opportunity, it identifies the potential for the Exporter (Country) among 190 countries, against the general trade analysis, which identifies the biggest importer or exporter.
To discover high-growth global markets and optimize your business strategy:
Click Here
Pricing
- Single User License$ 1,995
- Department License$ 2,400
- Site License$ 3,120
- Global License$ 3,795

Leadership Perspectives from Industry Events
Search
Thought Leadership and Analyst Meet


Our Clients
6WResearch In News
- India Export Attractiveness Tracker 2026
- India Air Conditioner Market Set for Strong Rebound in 2026 After Weather-Led Correction and GST-Driven Recovery: 6Wresearch
- ADAS in India: How Automatic Emergency Braking, Blind Spot Detection & Driver Monitoring are Transforming Road Safety
- Doha a strategic location for EV manufacturing hub: IPA Qatar
- Demand for luxury TVs surging in the GCC, says Samsung
- Empowering Growth: The Thriving Journey of Bangladesh’s Cable Industry
Latest Reports
- Qatar Access and Home Network Market (2026-2032)
- Nicaragua RPG Gaming Market (2026-2032)
- New Zealand RPG Gaming Market (2026-2032)
- Netherlands RPG Gaming Market (2026-2032)
- Nauru RPG Gaming Market (2026-2032)
- Namibia RPG Gaming Market (2026-2032)
- Mozambique RPG Gaming Market (2026-2032)
- Montenegro RPG Gaming Market (2026-2032)
- Mongolia RPG Gaming Market (2026-2032)
- Monaco RPG Gaming Market (2026-2032)
Industry Events and Analyst Meet

EV India Expo 2026

HIMTEX 2026

India Refining Summit 2026

India EV Show 2026

EV tech India Expo 2026
Whitepaper
- Middle East & Africa Commercial Security Market Click here to view more.
- Middle East & Africa Fire Safety Systems & Equipment Market Click here to view more.
- GCC Drone Market Click here to view more.
- Middle East Lighting Fixture Market Click here to view more.
- GCC Physical & Perimeter Security Market Click here to view more.