Ghana Nano Copper Oxide Market (2026-2032) Outlook | Analysis, Forecast, Value, Share, Companies, Growth, Trends, Size, Industry & Revenue
Market Forecast By Type (Powder, Dispersed), By Application (Electricals & Electronics, Paints & Coatings, Catalysts, Energy Storage) And Competitive Landscape
| Product Code: ETC197708 | Publication Date: May 2022 | Updated Date: Jun 2026 | Product Type: Market Research Report | |
| Publisher: 6Wresearch | Author: Ravi Bhandari | No. of Pages: 60 | No. of Figures: 40 | No. of Tables: 7 |
Ghana Nano Copper Oxide Market Size, Share & Growth Rate
The Ghana Nano Copper Oxide Market was estimated at USD 558 Million in 2025 and is projected to reach USD 802 Million by 2032, growing at a CAGR of 5.3% from 2026 to 2032. This growth trajectory is primarily driven by the expanding applications of nano copper oxide across various sectors, including electronics, healthcare, and agriculture. Additionally, the rise in research and development aimed at innovating new applications for nano copper oxide is further fueling this market momentum.
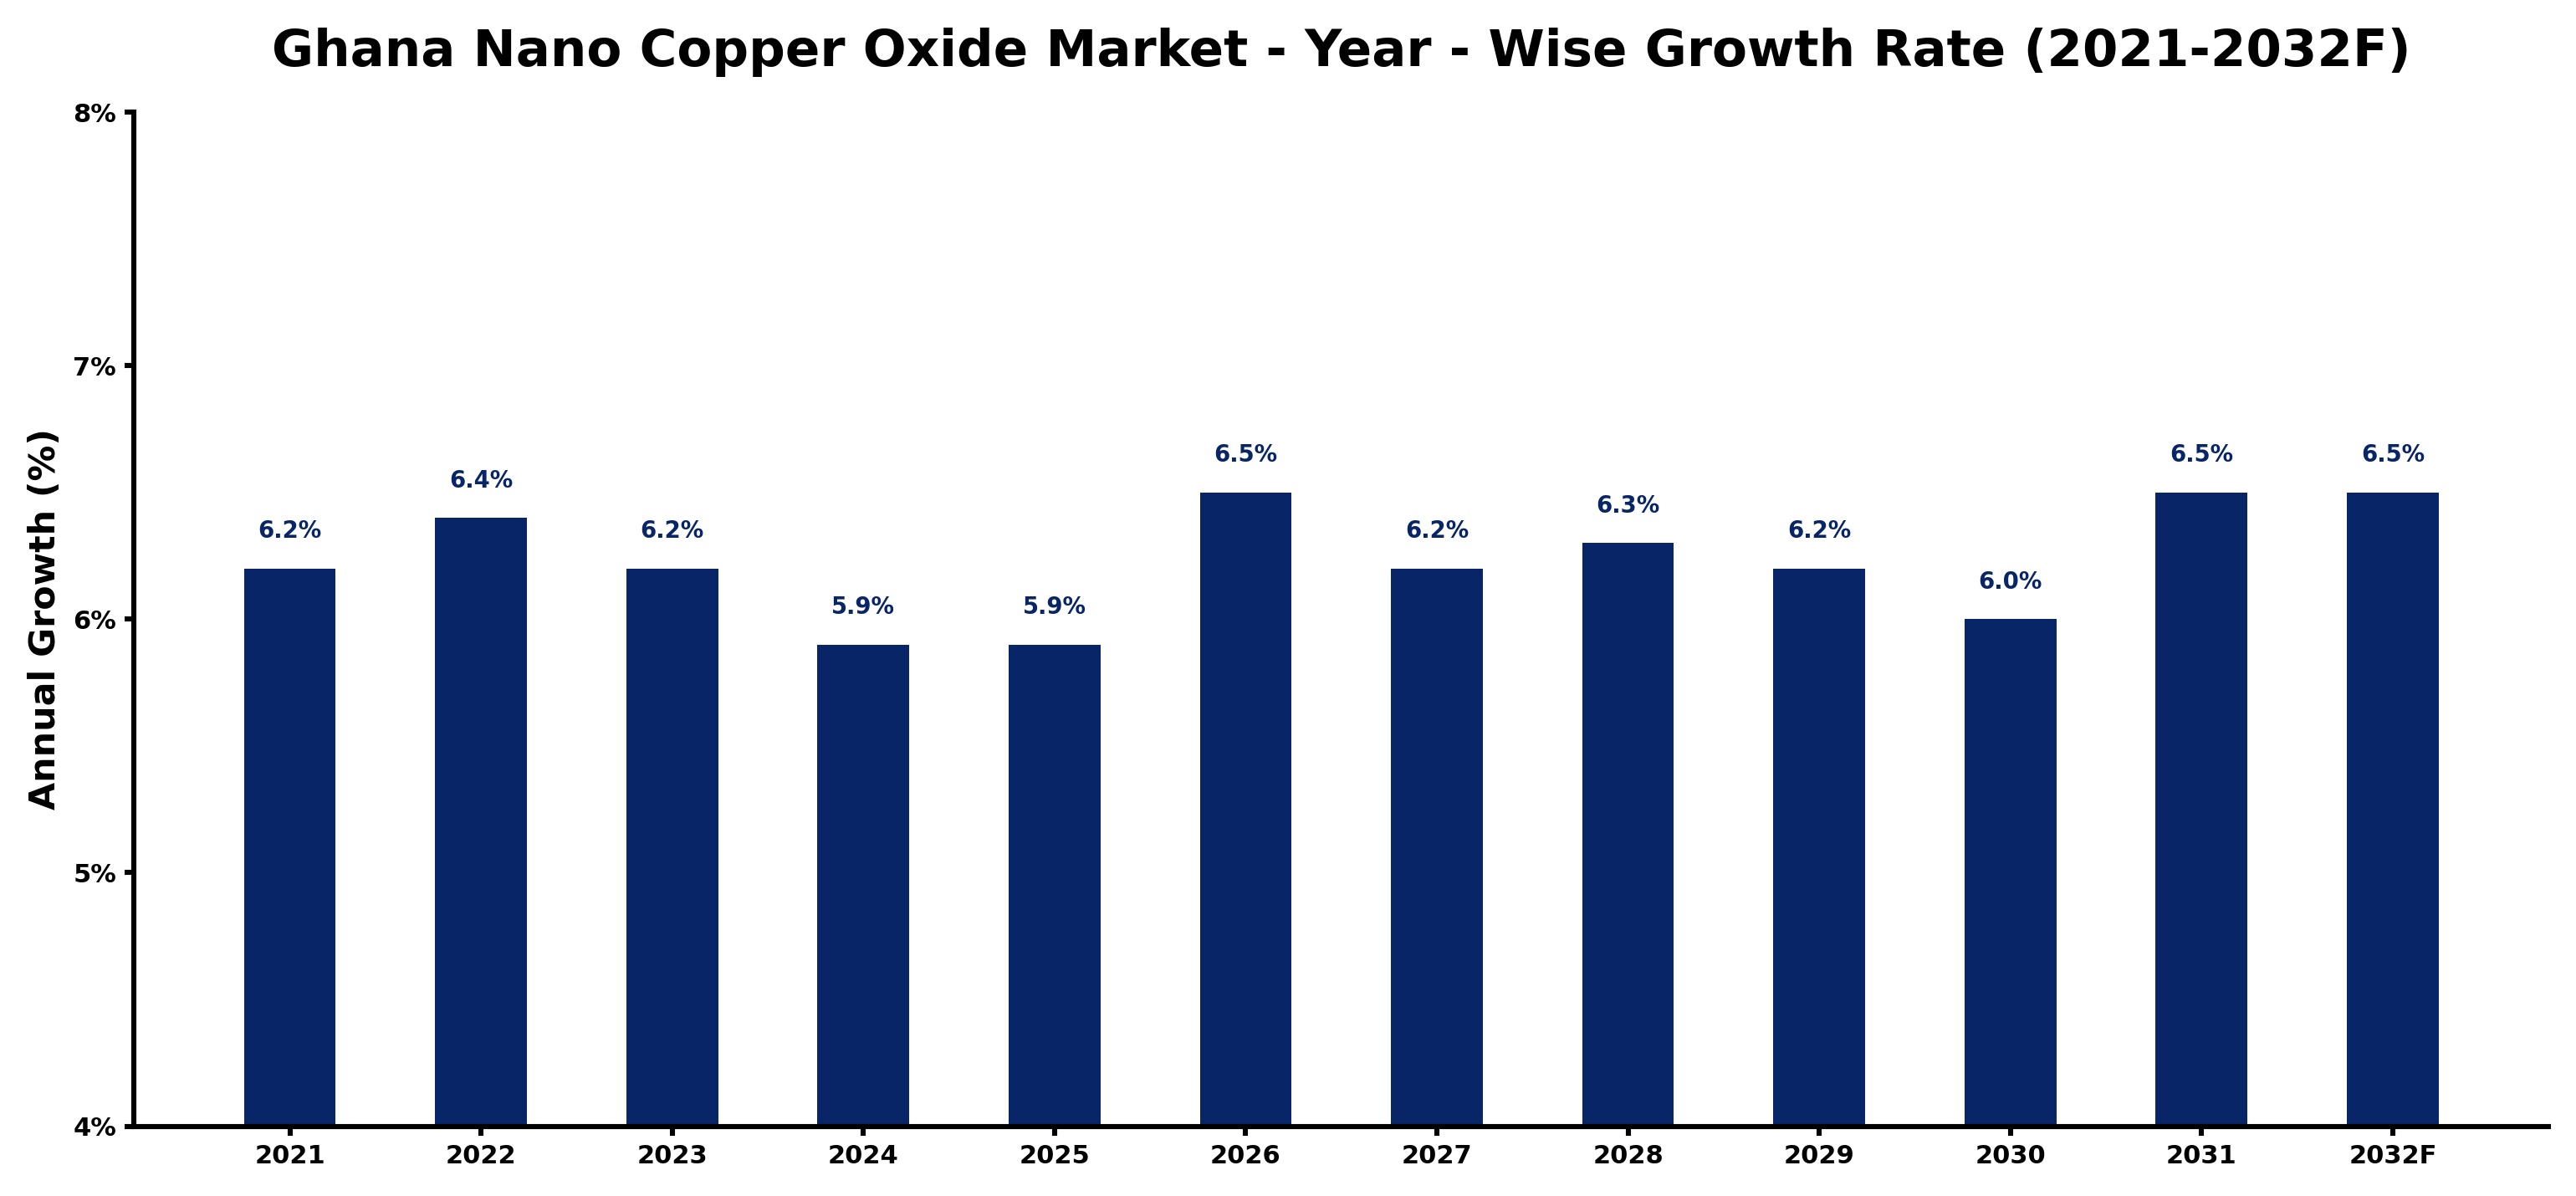
Ghana Nano Copper Oxide Market Growth Rate Analysis (2021-2032)
The Ghana Nano Copper Oxide market has exhibited stable growth, marked by a 6.2% increase in 2021, followed by a slight rise to 6.4% in 2022. This upward trend can be attributed to growing industrial applications and heightened consumer demand across sectors such as electronics and materials science. Although the growth dipped to 5.9% in both 2024 and 2025, likely due to supply chain disruptions and fluctuating raw material costs, the market rebounded to 6.5% in 2026, driven by increased investments in clean technology and energy transition initiatives. Overall, projections for 2030 indicate a sustained interest, maintaining a growth rate of around 6.0%, bolstered by advancements in manufacturing and digitalization.
Ghana Nano Copper Oxide Market Year-wise Growth Rate and Key Drivers
This graph highlights how the Ghana Nano Copper Oxide Market has steadily grown over the past five years, supported by major growth factors.
The table below presents the year‑wise growth rates along with the key drivers influencing the market
| Year | Growth Rate | Major Drivers |
| 2021 | 6.2% | Rising demand for advanced materials |
| 2022 | 6.4% | Increased applications in electronics |
| 2023 | 6.2% | Growth in renewable energy sector |
| 2024 | 5.9% | Expansion of nanotechnology research |
| 2025 | 5.9% | Surge in automotive industry usage |
| 2026 | 6.5% | Emerging markets adopting innovations |
| 2027 | 6.2% | Healthcare sector embracing nanomaterials |
| 2028 | 6.3% | Sustainability trends driving adoption |
| 2029 | 6.2% | Government initiatives supporting research |
| 2030 | 6.0% | Consumer electronics market expanding rapidly |
| 2031 | 6.5% | Collaboration between industries increasing |
| 2032 | 6.5% | Investment in infrastructure development rising |
Note - Market size estimations and growth projections presented in this report are based on 6Wresearch’s advanced forecasting approach, validated with industry datasets as of June 2026.
Ghana Nano Copper Oxide Market Synopsis
Recent growth in the Ghana Nano Copper Oxide market has highlighted the increasing interest in advanced materials that can enhance product performance across multiple sectors. As industries pivot towards sustainable and efficient solutions, nano copper oxide has emerged as a vital component in applications ranging from antimicrobial coatings to electronic devices.
Looking ahead, the Ghana Nano Copper Oxide market is set to undergo significant transformation. With a robust emphasis on innovation and technological advancements, stakeholders are positioned to capitalize on emerging opportunities that cater to evolving customer requirements and regulatory frameworks promoting nanotechnology.
Ghana Nano Copper Oxide Market Key Takeaways
- The Ghana Nano Copper Oxide market is on a steady growth path, projected to reach USD 802 Million by 2032.
- Applications across healthcare, electronics, and agriculture are driving the demand for nano copper oxide.
- Ongoing R&D activities are essential for discovering new applications and enhancing product properties.
- Government policies are increasingly supportive of nanotechnology, aiding market expansion.
- Challenges include awareness deficits and competition from alternative materials, requiring concerted efforts from industry stakeholders.
Evaluation of Restraints in Ghana Nano Copper Oxide Market
Despite its growth potential, the Ghana Nano Copper Oxide market faces several constraints that may hinder its full realization. Limited awareness among potential users about the benefits of nano copper oxide affects adoption rates. Moreover, the high production costs and lack of consistent quality standards pose significant barriers. Compounded by the limited infrastructure for research and development, these factors necessitate robust educational initiatives and collaborative efforts between industry and regulatory bodies to enhance understanding and streamline processes in the market.
Ghana Nano Copper Oxide Market Trends
Several current and emerging trends are influencing the Ghana Nano Copper Oxide market. There is a growing emphasis on sustainable production methods, as companies strive to meet the increasing demand for eco-friendly materials. Additionally, advancements in manufacturing technologies are improving the efficiency and effectiveness of nano copper oxide applications. The push for innovative solutions in industries such as healthcare and electronics is further accelerating the market's evolution.
Ghana Nano Copper Oxide Market Opportunities
Investment opportunities in the Ghana Nano Copper Oxide market are abundant, particularly in sectors such as electronics, healthcare, and construction. As industries increasingly seek advanced materials that offer both performance benefits and environmental advantages, nano copper oxide is well-positioned to meet this demand. Stakeholders who focus on R&D and collaborate with government initiatives are likely to unlock substantial growth potential.
Government Initiatives in the Ghana Nano Copper Oxide Market
Government policies in Ghana are playing a crucial role in promoting the nanotechnology sector, including the nano copper oxide market. Initiatives focus on fostering research and innovation while ensuring environmental sustainability and safety. Regulatory frameworks are being established to govern the production and use of nanomaterials, along with funding programs aimed at supporting R&D efforts. These governmental actions are creating a conducive environment for companies to thrive in the nano copper oxide space.
Future Insights of the Ghana Nano Copper Oxide Market
The outlook for the Ghana Nano Copper Oxide market between 2026 and 2032 appears promising. Increased investments in R&D will likely drive advancements in applications across various industries, particularly in electronics and healthcare. As the demand for eco-friendly solutions continues to rise, the adoption of nano copper oxide is expected to gain momentum, further positioning it as a key material in emerging technologies. This evolution will create numerous opportunities for manufacturers and suppliers alike.
Ghana Nano Copper Oxide Market Latest Developments (May 2025 - June 2026)
Recent developments in the Ghana Nano Copper Oxide market indicate a shift towards more innovative applications and enhanced production techniques. Companies are increasingly investing in sustainable practices and are actively exploring partnerships to bolster their R&D efforts. Moreover, several organizations are working closely with governmental bodies to address regulatory challenges and promote the safe usage of nanomaterials, laying the groundwork for future market growth.
Ghana Nano Copper Oxide Market - Key Attractiveness of the Report
- 10 Years of Market Numbers
- Historical Data Starting from 2022 to 2025
- Base Year: 2025
- Forecast Data until 2032
- Key Performance Indicators Impacting the Market
- Major Upcoming Developments and Projects
Key Highlights of the Report:
- Ghana Nano Copper Oxide Market Outlook
- Market Size of Ghana Nano Copper Oxide Market, 2025
- Forecast of Ghana Nano Copper Oxide Market, 2032
- Historical Data and Forecast of Ghana Nano Copper Oxide Revenues & Volume for the Period 2022-2032F
- Ghana Nano Copper Oxide Market Trend Evolution
- Ghana Nano Copper Oxide Market Drivers and Challenges
- Ghana Nano Copper Oxide Price Trends
- Ghana Nano Copper Oxide Porter's Five Forces
- Ghana Nano Copper Oxide Industry Life Cycle
- Historical Data and Forecast of Ghana Nano Copper Oxide Market Revenues & Volume By Type for the Period 2022-2032F
- Historical Data and Forecast of Ghana Nano Copper Oxide Market Revenues & Volume By Powder for the Period 2022-2032F
- Historical Data and Forecast of Ghana Nano Copper Oxide Market Revenues & Volume By Dispersed for the Period 2022-2032F
- Historical Data and Forecast of Ghana Nano Copper Oxide Market Revenues & Volume By Application for the Period 2022-2032F
- Historical Data and Forecast of Ghana Nano Copper Oxide Market Revenues & Volume By Electricals & Electronics for the Period 2022-2032F
- Historical Data and Forecast of Ghana Nano Copper Oxide Market Revenues & Volume By Paints & Coatings for the Period 2022-2032F
- Historical Data and Forecast of Ghana Nano Copper Oxide Market Revenues & Volume By Catalysts for the Period 2022-2032F
- Historical Data and Forecast of Ghana Nano Copper Oxide Market Revenues & Volume By Energy Storage for the Period 2022-2032F
- Ghana Nano Copper Oxide Import Export Trade Statistics
- Market Opportunity Assessment By Type
- Market Opportunity Assessment By Application
- Ghana Nano Copper Oxide Top Companies Market Share
- Ghana Nano Copper Oxide Competitive Benchmarking By Technical and Operational Parameters
- Ghana Nano Copper Oxide Company Profiles
- Ghana Nano Copper Oxide Key Strategic Recommendations
Ghana Nano Copper Oxide Market - Frequently Asked Questions
The growth is fueled by increasing demand for advanced materials in electronics, healthcare, and agriculture, alongside ongoing R&D efforts to discover new applications.
The market was estimated at USD 558 Million in 2025 and is projected to reach USD 802 Million by 2032, reflecting a CAGR of 5.3% from 2026 to 2032.
Trends include a shift towards sustainable production methods and advancements in manufacturing technologies aimed at improving application efficiencies.
Major challenges include limited awareness about nano copper oxide benefits, high production costs, and regulatory hurdles that need addressing for market expansion.
Government initiatives are promoting research and innovation while ensuring regulatory compliance, thus creating a favorable environment for market participants.
Opportunities lie in the demand for advanced materials in electronics, healthcare, and construction, especially for companies focused on R&D and innovation.
6Wresearch actively monitors the Ghana Nano Copper Oxide Market and publishes its comprehensive annual report, highlighting emerging trends, growth drivers, revenue analysis, and forecast outlook. Our insights help businesses to make data-backed strategic decisions with ongoing market dynamics. Our analysts track relevent industries related to the Ghana Nano Copper Oxide Market, allowing our clients with actionable intelligence and reliable forecasts tailored to emerging regional needs.
Yes, we provide customisation as per your requirements. To learn more, feel free to contact us on sales@6wresearch.com
1 Executive Summary |
2 Introduction |
2.1 Key Highlights of the Report |
2.2 Report Description |
2.3 Market Scope & Segmentation |
2.4 Research Methodology |
2.5 Assumptions |
3 Ghana Nano Copper Oxide Market Overview |
3.1 Ghana Country Macro Economic Indicators |
3.2 Ghana Nano Copper Oxide Market Revenues & Volume, 2022 & 2032F |
3.3 Ghana Nano Copper Oxide Market - Industry Life Cycle |
3.4 Ghana Nano Copper Oxide Market - Porter's Five Forces |
3.5 Ghana Nano Copper Oxide Market Revenues & Volume Share, By Type, 2022 & 2032F |
3.6 Ghana Nano Copper Oxide Market Revenues & Volume Share, By Application, 2022 & 2032F |
4 Ghana Nano Copper Oxide Market Dynamics |
4.1 Impact Analysis |
4.2 Market Drivers |
4.2.1 Growth in the electronics industry, leading to increased demand for nano copper oxide for electronic components. |
4.2.2 Rising investments in research and development activities to enhance the properties and applications of nano copper oxide. |
4.2.3 Government initiatives promoting the use of nanomaterials in various sectors, including healthcare and agriculture. |
4.3 Market Restraints |
4.3.1 Fluctuations in raw material prices impacting the production cost of nano copper oxide. |
4.3.2 Lack of standardized regulations and guidelines for the use of nanomaterials, leading to uncertainty among consumers. |
4.3.3 Competition from alternative materials with similar properties, affecting the market penetration of nano copper oxide. |
5 Ghana Nano Copper Oxide Market Trends |
6 Ghana Nano Copper Oxide Market, By Types |
6.1 Ghana Nano Copper Oxide Market, By Type |
6.1.1 Overview and Analysis |
6.1.2 Ghana Nano Copper Oxide Market Revenues & Volume, By Type, 2022-2032F |
6.1.3 Ghana Nano Copper Oxide Market Revenues & Volume, By Powder, 2022-2032F |
6.1.4 Ghana Nano Copper Oxide Market Revenues & Volume, By Dispersed, 2022-2032F |
6.2 Ghana Nano Copper Oxide Market, By Application |
6.2.1 Overview and Analysis |
6.2.2 Ghana Nano Copper Oxide Market Revenues & Volume, By Electricals & Electronics, 2022-2032F |
6.2.3 Ghana Nano Copper Oxide Market Revenues & Volume, By Paints & Coatings, 2022-2032F |
6.2.4 Ghana Nano Copper Oxide Market Revenues & Volume, By Catalysts, 2022-2032F |
6.2.5 Ghana Nano Copper Oxide Market Revenues & Volume, By Energy Storage, 2022-2032F |
7 Ghana Nano Copper Oxide Market Import-Export Trade Statistics |
7.1 Ghana Nano Copper Oxide Market Export to Major Countries |
7.2 Ghana Nano Copper Oxide Market Imports from Major Countries |
8 Ghana Nano Copper Oxide Market Key Performance Indicators |
8.1 Research and development expenditure dedicated to nano copper oxide enhancements. |
8.2 Number of partnerships or collaborations with key players in the electronics industry. |
8.3 Percentage of government projects utilizing nano copper oxide in various applications. |
8.4 Adoption rate of nano copper oxide in new sectors beyond electronics. |
9 Ghana Nano Copper Oxide Market - Opportunity Assessment |
9.1 Ghana Nano Copper Oxide Market Opportunity Assessment, By Type, 2022 & 2032F |
9.2 Ghana Nano Copper Oxide Market Opportunity Assessment, By Application, 2022 & 2032F |
10 Ghana Nano Copper Oxide Market - Competitive Landscape |
10.1 Ghana Nano Copper Oxide Market Revenue Share, By Companies, 2025 |
10.2 Ghana Nano Copper Oxide Market Competitive Benchmarking, By Operating and Technical Parameters |
11 Company Profiles |
12 Recommendations |
13 Disclaimer |
Global Go To Market Strategy - 2030
Export potential enables firms to identify high-growth global markets with greater confidence by combining advanced trade intelligence with a structured quantitative methodology. The framework analyzes emerging demand trends and country-level import patterns while integrating macroeconomic and trade datasets such as GDP and population forecasts, bilateral import–export flows, tariff structures, elasticity differentials between developed and developing economies, geographic distance, and import demand projections. Using weighted trade values from 2020–2024 as the base period to project country-to-country export potential for 2030, these inputs are operationalized through calculated drivers such as gravity model parameters, tariff impact factors, and projected GDP per-capita growth. Through an analysis of hidden potentials, demand hotspots, and market conditions that are most favorable to success, this method enables firms to focus on target countries, maximize returns, and global expansion with data, backed by accuracy.
By factoring in the projected importer demand gap that is currently unmet and could be potential opportunity, it identifies the potential for the Exporter (Country) among 190 countries, against the general trade analysis, which identifies the biggest importer or exporter.
To discover high-growth global markets and optimize your business strategy:
Click Here
Pricing
- Single User License$ 1,995
- Department License$ 2,400
- Site License$ 3,120
- Global License$ 3,795

Leadership Perspectives from Industry Events
Search
Thought Leadership and Analyst Meet


Our Clients
6WResearch In News
- India Air Conditioner Market Set for Strong Rebound in 2026 After Weather-Led Correction and GST-Driven Recovery: 6Wresearch
- ADAS in India: How Automatic Emergency Braking, Blind Spot Detection & Driver Monitoring are Transforming Road Safety
- Doha a strategic location for EV manufacturing hub: IPA Qatar
- Demand for luxury TVs surging in the GCC, says Samsung
- Empowering Growth: The Thriving Journey of Bangladesh’s Cable Industry
- Demand for luxury TVs surging in the GCC, says Samsung
Latest Reports
- Poland Fire Protection Systems Market (2026-2032)
- Cape Verde Portable Hand-Thrown Extinguisher Market (2026-2032)
- Canada Portable Hand-Thrown Extinguisher Market (2026-2032)
- Cameroon Portable Hand-Thrown Extinguisher Market (2026-2032)
- Burundi Portable Hand-Thrown Extinguisher Market (2026-2032)
- Burkina Faso Portable Hand-Thrown Extinguisher Market (2026-2032)
- Bulgaria Portable Hand-Thrown Extinguisher Market (2026-2032)
- Brunei Portable Hand-Thrown Extinguisher Market (2026-2032)
- Botswana Portable Hand-Thrown Extinguisher Market (2026-2032)
- Bosnia and Herzegovina Portable Hand-Thrown Extinguisher Market (2026-2032)
Industry Events and Analyst Meet

HIMTEX 2026

India Refining Summit 2026

India EV Show 2026

EV tech India Expo 2026

Auto Tech Asia 2026
Whitepaper
- Middle East & Africa Commercial Security Market Click here to view more.
- Middle East & Africa Fire Safety Systems & Equipment Market Click here to view more.
- GCC Drone Market Click here to view more.
- Middle East Lighting Fixture Market Click here to view more.
- GCC Physical & Perimeter Security Market Click here to view more.