Ghana Power Supply Market (2026-2032) | Trends, Revenue, Industry, Analysis, Share, Outlook, Companies, Forecast, Growth, Value & Size
Market Forecast By Output Power (Power Supply With Low Output (500 W and Below), Power Supply With Medium Output (500–1,000 W), Power Supply With High Output (More Than 1,000 W)), By Type (AC-DC Power Supply, DC-DC Power Supply), By Vertical (Medical & Healthcare, Military & Aerospace, Telecommunications, Consumer Electronics, Transportation, Lighting, Food & Beverages, Industrial) And Competitive Landscape
| Product Code: ETC014236 | Publication Date: Oct 2020 | Updated Date: Jun 2026 | Product Type: Report | |
| Publisher: 6Wresearch | Author: Ravi Bhandari | No. of Pages: 70 | No. of Figures: 35 | No. of Tables: 5 |
Ghana Power Supply Market Summary
The ghana power supply market was estimated at USD 257 Million in 2025 and is projected to reach USD 339 Million by 2032, growing at a CAGR of 4.7% from 2026 to 2032.
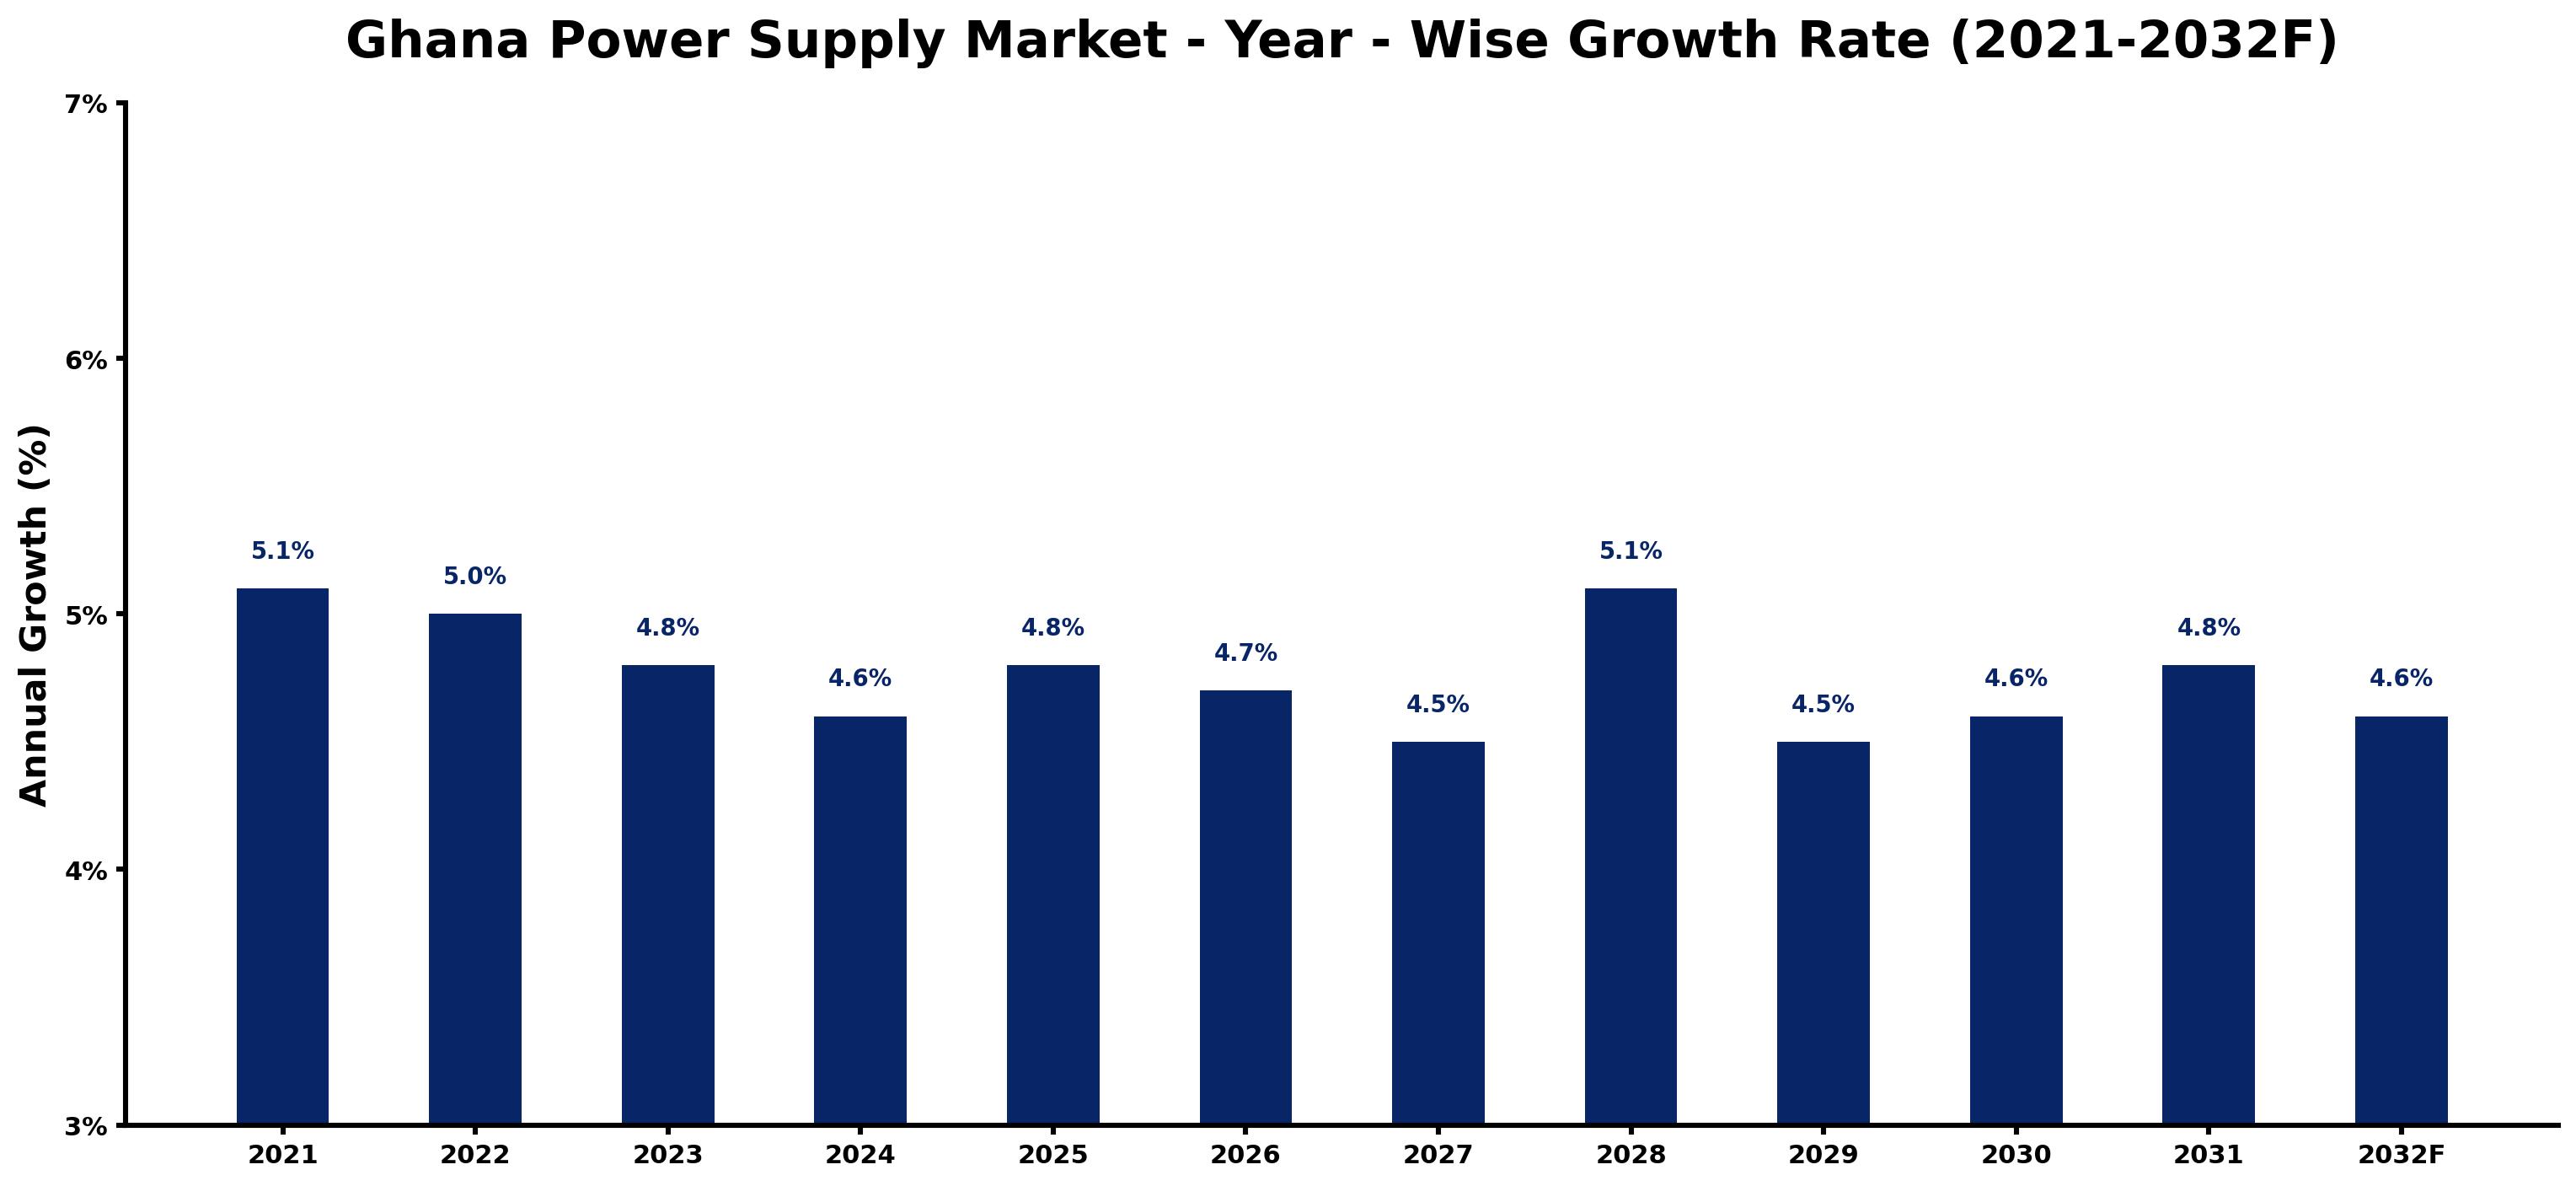
Ghana Power Supply Market Growth Rate Analysis (2021-2032)
The Ghana power supply market has exhibited stable growth, with yearly increases ranging from 4.5% to 5.1% between 2021 and 2023. In 2021, a strong uptick of 5.1% was driven by heightened investments in renewable energy infrastructure and government policies aimed at improving energy access. However, growth moderated slightly to 4.8% in 2023, reflecting potential supply chain challenges and shifts in consumer demand as urbanization continues. As we look ahead, the market is expected to stabilize around 4.6% to 4.8% through 2032, reflecting ongoing investments in digitalization and energy transition initiatives, which remain crucial in meeting the growing electricity needs of an expanding population.
Ghana Power Supply Market Year-wise Growth Rate and Key Drivers
This graph highlights how the Ghana Power Supply Market has steadily grown over the past five years, supported by major growth factors.
The table below presents the year wise growth rates along with the key drivers influencing the market
| Year | Growth Rate | Major Drivers |
| 2021 | 5.1% | Local energy initiatives began addressing energy access in rural communities and urban centers. |
| 2022 | 5.0% | Investment in renewable energy sources reflected a shift towards sustainability in power generation. |
| 2023 | 4.8% | Technological integration gained momentum, improving grid efficiency and reducing outages significantly. |
| 2024 | 4.6% | Consumer interest in off-grid solutions expanded, tapping into solar and wind resources. |
| 2025 | 4.8% | Partnerships with international energy firms increased, enhancing capacity through shared expertise. |
| 2026 | 4.7% | Financial institutions introduced green financing options, incentivizing renewable energy projects nationwide. |
| 2027 | 4.5% | Decentralized energy systems gained traction, empowering communities to manage their own power needs. |
| 2028 | 5.1% | Urbanization trends heightened infrastructure demands, necessitating more reliable energy supply solutions. |
| 2029 | 4.5% | Renewable energy tariffs became more competitive, attracting both local and foreign investments. |
| 2030 | 4.6% | Public awareness campaigns effectively increased consumer engagement in energy conservation practices. |
| 2031 | 4.8% | Technological advancements in battery storage showcased significant improvements in energy reliability. |
| 2032 | 4.6% | Collaborative policy frameworks emerged, aligning public and private efforts towards sustainable energy goals. |
Note - Market size estimations and growth projections presented in this report are based on 6Wresearch's advanced forecasting approach, validated with industry datasets as of June 2026.
Ghana Power Supply Market Synopsis
The Ghana Power Supply Market is projected to reach 4.7% and witness significant growth during the forecast period (2026-2032). This market encompasses a comprehensive range of solutions, including generators, transformers, and switchgear, essential for the efficient delivery of electricity from various generation sources to end-users. The ongoing expansion of generation capacity and transmission infrastructure, combined with critical electrification projects, serves as a robust foundation for this growth trend.
Ghana Power Supply Market Growth Drivers
The growth of the Ghana power supply market is chiefly propelled by several interrelated factors. Key drivers include:
- The persistent increase in electricity demand stemming from rising population figures, urbanization, and overall economic development, which has led to heightened energy consumption across various sectors.
- Significant investments by power supply companies and utilities, aimed at enhancing infrastructure capabilities, expanding generation capacity, and modernizing the electrical grid to accommodate the surging electricity requirements.
- The expansion of industrial and commercial activities necessitates more reliable power sources, amplifying the pressure on the existing infrastructure and pushing for improvements in supply capabilities.
- Government initiatives promoting energy efficiency and integration of renewable energy sources are paving the way for innovative solutions that can address the challenges of supply stability and environmental sustainability.
- The strategic development of partnerships across the energy sector that focus on collaborative efforts for infrastructure modernization and resilience building in the power supply landscape.
Ghana Power Supply Market Challenges and Restraints
Despite the positive outlook, the Ghana power supply market faces notable challenges that can impede its progress. Major issues include:
- Infrastructure constraints that limit the ability to deliver reliable electricity, particularly in rural and underserved areas, where demand is increasing but supply remains inadequate.
- Fluctuations in electricity demand that create instability in supply, necessitating robust demand forecasting and management strategies to prevent disruptions.
- The requirement for substantial investment in the construction and upgrading of generation, transmission, and distribution infrastructure, which is often hindered by limited access to financing and regulatory barriers.
- Seasonal variations in demand can result in supply disruptions, particularly during peak times, requiring careful strategic planning among utilities and regulators.
- Equipment failures and fuel shortages pose additional challenges, highlighting the need for resilient systems and contingency plans to ensure continuous electricity supply.
Ghana Power Supply Market Government Investment and Initiatives
The Ghanaian government recognizes the imperative role of a stable and sustainable power supply in fostering economic growth and improving the quality of life for its citizens. To support the power supply market, a variety of policies and initiatives have been established, focusing on:
- Expanding generation capacity through investments in both traditional and renewable energy sources, ensuring a diverse energy mix that can support future demand.
- Modernizing transmission and distribution infrastructure to enhance efficiency, reduce losses, and improve the overall reliability of power supply to end-users.
- Promoting renewable energy technologies through incentives and regulatory frameworks to encourage private sector participation, thereby reducing dependence on fossil fuels.
- Implementing policies aimed at enhancing efficiency and affordability within the power sector, ensuring that energy remains accessible to all socio-economic classes.
- Engaging in public-private partnerships that leverage private investment to support infrastructure projects, ultimately driving the resilience and accessibility of the power supply framework.
Ghana Power Supply Market Latest Developments (May 2025 - June 2026)
In the time frame from May 2025 to June 2026, notable developments are shaping the Ghana power supply market. Key trends observed during this period include:
- Acceleration in the implementation of infrastructure projects aimed at enhancing power generation capabilities, particularly in renewable energy sectors such as solar and wind energy.
- Increased focus on energy efficiency initiatives, driven by regulatory reforms aimed at mandating utilities to adopt smarter grid technologies and practices.
- Expansion of electrification projects targeting rural communities, with government and international funding facilitating wider access to reliable electricity.
- Strengthening collaboration between government agencies and private stakeholders to address the issues of financing and project delays, facilitating a more conducive environment for infrastructure development.
- Growing emphasis on integrating energy storage solutions to enhance stability and reliability in the power supply amidst fluctuating demand patterns.
Ghana Power Supply Market - Key Attractiveness of the Report
- 10 Years of Market Numbers
- Historical Data Starting from 2022 to 2025
- Base Year: 2025
- Forecast Data until 2032
- Key Performance Indicators Impacting the Market
- Major Upcoming Developments and Projects
Key Highlights of the Report:
- Ghana Power Supply Market Outlook
- Market Size of Ghana Power Supply Market, 2025
- Forecast of Ghana Power Supply Market, 2032
- Historical Data and Forecast of Ghana Power Supply Revenues & Volume for the Period 2022-2032F
- Ghana Power Supply Market Trend Evolution
- Ghana Power Supply Market Drivers and Challenges
- Ghana Power Supply Price Trends
- Ghana Power Supply Porter's Five Forces
- Ghana Power Supply Industry Life Cycle
- Historical Data and Forecast of Ghana Power Supply Market Revenues & Volume By Output Power for the Period 2022-2032F
- Historical Data and Forecast of Ghana Power Supply Market Revenues & Volume By Power Supply With Low Output (500 W and Below) for the Period 2022-2032F
- Historical Data and Forecast of Ghana Power Supply Market Revenues & Volume By Power Supply With Medium Output (500?1,000 W) for the Period 2022-2032F
- Historical Data and Forecast of Ghana Power Supply Market Revenues & Volume By Power Supply With High Output (More Than 1,000 W) for the Period 2022-2032F
- Historical Data and Forecast of Ghana Power Supply Market Revenues & Volume By Type for the Period 2022-2032F
- Historical Data and Forecast of Ghana Power Supply Market Revenues & Volume By AC-DC Power Supply for the Period 2022-2032F
- Historical Data and Forecast of Ghana Power Supply Market Revenues & Volume By DC-DC Power Supply for the Period 2022-2032F
- Historical Data and Forecast of Ghana Power Supply Market Revenues & Volume By Vertical for the Period 2022-2032F
- Historical Data and Forecast of Ghana Power Supply Market Revenues & Volume By Medical & Healthcare for the Period 2022-2032F
- Historical Data and Forecast of Ghana Power Supply Market Revenues & Volume By Military & Aerospace for the Period 2022-2032F
- Historical Data and Forecast of Ghana Power Supply Market Revenues & Volume By Telecommunications for the Period 2022-2032F
- Historical Data and Forecast of Ghana Power Supply Market Revenues & Volume By Consumer Electronics for the Period 2022-2032F
- Historical Data and Forecast of Ghana Power Supply Market Revenues & Volume By Transportation for the Period 2022-2032F
- Historical Data and Forecast of Ghana Power Supply Market Revenues & Volume By Lighting for the Period 2022-2032F
- Historical Data and Forecast of Ghana Power Supply Market Revenues & Volume By Food & Beverages for the Period 2022-2032F
- Historical Data and Forecast of Ghana Power Supply Market Revenues & Volume By Industrial for the Period 2022-2032F
- Ghana Power Supply Import Export Trade Statistics
- Market Opportunity Assessment By Output Power
- Market Opportunity Assessment By Type
- Market Opportunity Assessment By Vertical
- Ghana Power Supply Top Companies Market Share
- Ghana Power Supply Competitive Benchmarking By Technical and Operational Parameters
- Ghana Power Supply Company Profiles
- Ghana Power Supply Key Strategic Recommendations
Frequently Asked Questions About the Market Study (FAQs):
The growth is primarily driven by increasing electricity demand due to population growth, urbanization, and industrial expansion.
Key challenges include infrastructure constraints, demand fluctuations, and the need for substantial investment in modernization.
The government supports the sector through policies that promote capacity expansion, infrastructure improvement, and renewable energy development.
Recent trends include increased investments in renewable energy, energy efficiency initiatives, and collaborative efforts between public and private sectors.
6Wresearch actively monitors the Ghana Power Supply Market and publishes its comprehensive annual report, highlighting emerging trends, growth drivers, revenue analysis, and forecast outlook. Our insights help businesses to make data-backed strategic decisions with ongoing market dynamics. Our analysts track relevent industries related to the Ghana Power Supply Market, allowing our clients with actionable intelligence and reliable forecasts tailored to emerging regional needs.
Yes, we provide customisation as per your requirements. To learn more, feel free to contact us on sales@6wresearch.com
1 Executive Summary |
2 Introduction |
2.1 Key Highlights of the Report |
2.2 Report Description |
2.3 Market Scope & Segmentation |
2.4 Research Methodology |
2.5 Assumptions |
3 Ghana Power Supply Market Overview |
3.1 Ghana Country Macro Economic Indicators |
3.2 Ghana Power Supply Market Revenues & Volume, 2022 & 2032F |
3.3 Ghana Power Supply Market - Industry Life Cycle |
3.4 Ghana Power Supply Market - Porter's Five Forces |
3.5 Ghana Power Supply Market Revenues & Volume Share, By Output Power, 2022 & 2032F |
3.6 Ghana Power Supply Market Revenues & Volume Share, By Type, 2022 & 2032F |
3.7 Ghana Power Supply Market Revenues & Volume Share, By Vertical, 2022 & 2032F |
4 Ghana Power Supply Market Dynamics |
4.1 Impact Analysis |
4.2 Market Drivers |
4.3 Market Restraints |
5 Ghana Power Supply Market Trends |
6 Ghana Power Supply Market, By Types |
6.1 Ghana Power Supply Market, By Output Power |
6.1.1 Overview and Analysis |
6.1.2 Ghana Power Supply Market Revenues & Volume, By Output Power, 2022-2032F |
6.1.3 Ghana Power Supply Market Revenues & Volume, By Power Supply With Low Output (500 W and Below), 2022-2032F |
6.1.4 Ghana Power Supply Market Revenues & Volume, By Power Supply With Medium Output (500?1,000 W), 2022-2032F |
6.1.5 Ghana Power Supply Market Revenues & Volume, By Power Supply With High Output (More Than 1,000 W), 2022-2032F |
6.2 Ghana Power Supply Market, By Type |
6.2.1 Overview and Analysis |
6.2.2 Ghana Power Supply Market Revenues & Volume, By AC-DC Power Supply, 2022-2032F |
6.2.3 Ghana Power Supply Market Revenues & Volume, By DC-DC Power Supply, 2022-2032F |
6.3 Ghana Power Supply Market, By Vertical |
6.3.1 Overview and Analysis |
6.3.2 Ghana Power Supply Market Revenues & Volume, By Medical & Healthcare, 2022-2032F |
6.3.3 Ghana Power Supply Market Revenues & Volume, By Military & Aerospace, 2022-2032F |
6.3.4 Ghana Power Supply Market Revenues & Volume, By Telecommunications, 2022-2032F |
6.3.5 Ghana Power Supply Market Revenues & Volume, By Consumer Electronics, 2022-2032F |
6.3.6 Ghana Power Supply Market Revenues & Volume, By Transportation, 2022-2032F |
6.3.7 Ghana Power Supply Market Revenues & Volume, By Lighting, 2022-2032F |
6.3.8 Ghana Power Supply Market Revenues & Volume, By Industrial, 2022-2032F |
6.3.9 Ghana Power Supply Market Revenues & Volume, By Industrial, 2022-2032F |
7 Ghana Power Supply Market Import-Export Trade Statistics |
7.1 Ghana Power Supply Market Export to Major Countries |
7.2 Ghana Power Supply Market Imports from Major Countries |
8 Ghana Power Supply Market Key Performance Indicators |
9 Ghana Power Supply Market - Opportunity Assessment |
9.1 Ghana Power Supply Market Opportunity Assessment, By Output Power, 2022 & 2032F |
9.2 Ghana Power Supply Market Opportunity Assessment, By Type, 2022 & 2032F |
9.3 Ghana Power Supply Market Opportunity Assessment, By Vertical, 2022 & 2032F |
10 Ghana Power Supply Market - Competitive Landscape |
10.1 Ghana Power Supply Market Revenue Share, By Companies, 2025 |
10.2 Ghana Power Supply Market Competitive Benchmarking, By Operating and Technical Parameters |
11 Company Profiles |
12 Recommendations |
13 Disclaimer |
Global Go To Market Strategy - 2030
Export potential enables firms to identify high-growth global markets with greater confidence by combining advanced trade intelligence with a structured quantitative methodology. The framework analyzes emerging demand trends and country-level import patterns while integrating macroeconomic and trade datasets such as GDP and population forecasts, bilateral import–export flows, tariff structures, elasticity differentials between developed and developing economies, geographic distance, and import demand projections. Using weighted trade values from 2020–2024 as the base period to project country-to-country export potential for 2030, these inputs are operationalized through calculated drivers such as gravity model parameters, tariff impact factors, and projected GDP per-capita growth. Through an analysis of hidden potentials, demand hotspots, and market conditions that are most favorable to success, this method enables firms to focus on target countries, maximize returns, and global expansion with data, backed by accuracy.
By factoring in the projected importer demand gap that is currently unmet and could be potential opportunity, it identifies the potential for the Exporter (Country) among 190 countries, against the general trade analysis, which identifies the biggest importer or exporter.
To discover high-growth global markets and optimize your business strategy:
Click Here
Pricing
- Single User License$ 1,995
- Department License$ 2,400
- Site License$ 3,120
- Global License$ 3,795

Leadership Perspectives from Industry Events
Search
Thought Leadership and Analyst Meet


Our Clients
6WResearch In News
- India Air Conditioner Market Set for Strong Rebound in 2026 After Weather-Led Correction and GST-Driven Recovery: 6Wresearch
- ADAS in India: How Automatic Emergency Braking, Blind Spot Detection & Driver Monitoring are Transforming Road Safety
- Doha a strategic location for EV manufacturing hub: IPA Qatar
- Demand for luxury TVs surging in the GCC, says Samsung
- Empowering Growth: The Thriving Journey of Bangladesh’s Cable Industry
- Demand for luxury TVs surging in the GCC, says Samsung
Latest Reports
- Poland Fire Protection Systems Market (2026-2032)
- Cape Verde Portable Hand-Thrown Extinguisher Market (2026-2032)
- Canada Portable Hand-Thrown Extinguisher Market (2026-2032)
- Cameroon Portable Hand-Thrown Extinguisher Market (2026-2032)
- Burundi Portable Hand-Thrown Extinguisher Market (2026-2032)
- Burkina Faso Portable Hand-Thrown Extinguisher Market (2026-2032)
- Bulgaria Portable Hand-Thrown Extinguisher Market (2026-2032)
- Brunei Portable Hand-Thrown Extinguisher Market (2026-2032)
- Botswana Portable Hand-Thrown Extinguisher Market (2026-2032)
- Bosnia and Herzegovina Portable Hand-Thrown Extinguisher Market (2026-2032)
Industry Events and Analyst Meet

HIMTEX 2026

India Refining Summit 2026

India EV Show 2026

EV tech India Expo 2026

Auto Tech Asia 2026
Whitepaper
- Middle East & Africa Commercial Security Market Click here to view more.
- Middle East & Africa Fire Safety Systems & Equipment Market Click here to view more.
- GCC Drone Market Click here to view more.
- Middle East Lighting Fixture Market Click here to view more.
- GCC Physical & Perimeter Security Market Click here to view more.