Ghana Urea Formaldehyde Market (2026-2032) Outlook | Size, Forecast, Share, Analysis, Companies, Trends, Growth, Value, Revenue & Industry
Market Forecast By End-users (Automobiles, Electrical Appliances, Home Appliances (Furniture), Agriculture, Others), By Applications (Adhesives, Particle board, Plywood, Roofing mats, Others) And Competitive Landscape
| Product Code: ETC093135 | Publication Date: Jun 2021 | Updated Date: Jun 2026 | Product Type: Report | |
| Publisher: 6Wresearch | Author: Ravi Bhandari | No. of Pages: 70 | No. of Figures: 35 | No. of Tables: 5 |
Ghana Urea Formaldehyde Market Size, Share & Growth Rate
The Ghana Urea Formaldehyde Market was estimated at USD 429 Million in 2025 and is projected to reach USD 603 Million by 2032, growing at a CAGR of 5.0% from 2026 to 2032. This growth is primarily fueled by the increasing demand from the wood processing and construction industries, where urea formaldehyde resins are essential for producing high-quality engineered wood products. Additionally, the automotive sector is increasingly recognizing the advantages of these resins, further propelling market dynamics in Ghana.
Ghana Urea Formaldehyde Market Growth Rate Analysis (2021-2032)
The Ghana Urea Formaldehyde market showcased a stable growth pattern, with a yearly growth rate of 6.0% in 2021 followed by 5.6% in 2022. This slight decline was attributed to fluctuations in raw material availability and shifting consumer demands. However, the market rebounded with a growth of 6.1% in 2023, driven by increased investments in manufacturing and enhanced industrial applications, particularly in the construction and automotive sectors. Projections indicate steady growth rates, stabilizing around 5.9% in 2024 and 2025. By 2028, growth is expected to reach 6.1%, supported by ongoing infrastructure projects and a digitalization push, ultimately strengthening demand for Urea Formaldehyde in Ghana's evolving economy.
Ghana Urea Formaldehyde Market Year-wise Growth Rate and Key Drivers
This graph highlights how the Ghana Urea Formaldehyde Market has steadily grown over the past five years, supported by major growth factors.
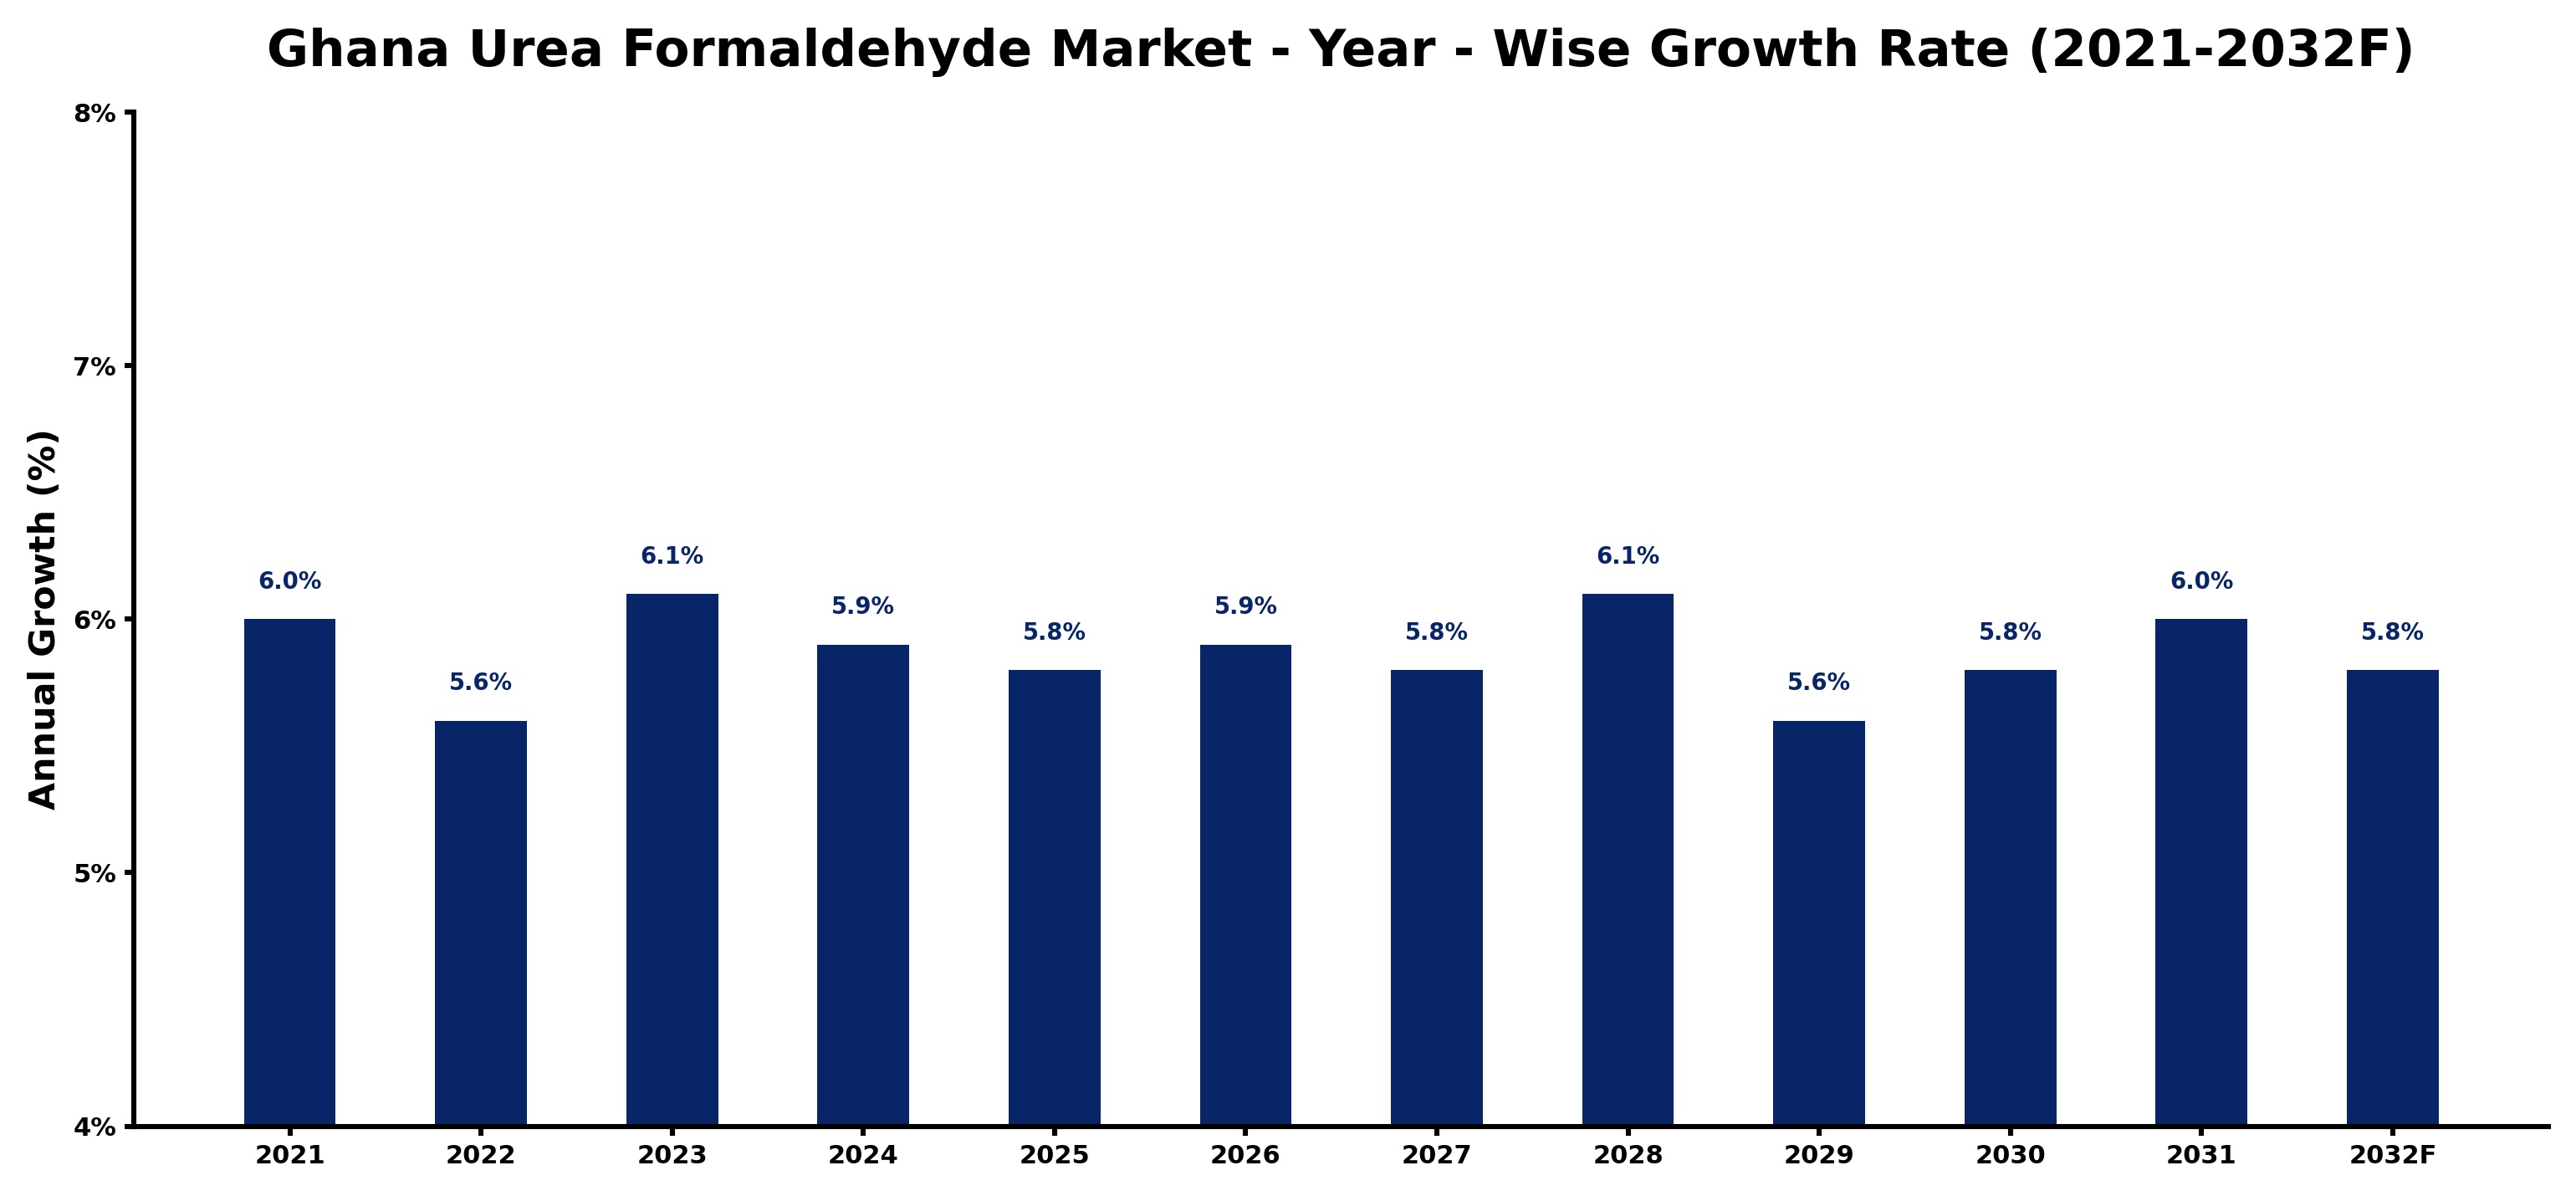
The table below presents the year‑wise growth rates along with the key drivers influencing the market
| Year | Growth Rate | Major Drivers |
| 2021 | 6.0% | Domestic urea formaldehyde production capacity enhancements boost export competitiveness |
| 2022 | 5.6% | Improved local supply chains boosted urea formaldehyde production efficiency |
| 2023 | 6.1% | Local furniture manufacturing surge boosts urea formaldehyde resin consumption |
| 2024 | 5.9% | Local manufacturers boost urea formaldehyde production for export markets |
| 2025 | 5.8% | Improved production efficiency boosts urea formaldehyde manufacturing capacity |
| 2026 | 5.9% | Factory upgrades boosted local urea formaldehyde production efficiencies |
| 2027 | 5.8% | Strategic infrastructure investments boost local urea formaldehyde production capacity |
| 2028 | 6.1% | Export driven fertilizer demand boosted urea formaldehyde production capacity |
| 2029 | 5.6% | New manufacturing plants boost urea formaldehyde production capabilities |
| 2030 | 5.8% | Investment in local urea formaldehyde production boosts supply chain resilience |
| 2031 | 6.0% | New manufacturing technologies boosted urea formaldehyde production efficiency |
| 2032 | 5.8% | Manufacturing investments in local urea formaldehyde plants bolster output |
Note - Market size estimations and growth projections presented in this report are based on 6Wresearch’s advanced forecasting approach, validated with industry datasets as of June 2026.
Ghana Urea Formaldehyde Market Synopsis
Recently, the Ghana urea formaldehyde market has shown robust momentum, driven by a surge in wood product manufacturing and construction activity. However, as regulatory scrutiny around formaldehyde emissions intensifies, the market is transitioning towards sustainable practices while maintaining its growth trajectory.
Looking ahead, stakeholders are adapting to consumer preferences for eco-friendly alternatives and enhanced indoor air quality. This shift represents both a challenge and an opportunity for manufacturers to innovate and align with governmental policies promoting sustainable industry practices.
Ghana Urea Formaldehyde Market Key Takeaways
- Strong growth forecast due to rising demand in wood processing and construction sectors.
- Government policies are increasingly promoting sustainable practices in urea formaldehyde production.
- Environmental concerns about formaldehyde emissions are shaping market dynamics.
- Innovations in bonding technology are paving the way for competitive advantages.
- The automotive industry’s adoption of urea formaldehyde resins is creating new market avenues.
Evaluation of Restraints in Ghana Urea Formaldehyde Market
Despite the promising growth, the Ghana urea formaldehyde market faces significant restraints. Heightened environmental regulations related to formaldehyde emissions are influencing both production processes and product formulation. Manufacturers must navigate these regulations while also addressing public concerns regarding product toxicity and indoor air quality. Additionally, competition from alternative adhesive materials poses a threat, forcing traditional players to innovate or risk losing market share.
Ghana Urea Formaldehyde Market Trends
One of the most significant trends is the increasing emphasis on sustainability and reduced environmental impact in manufacturing processes. Companies are exploring advancements in low-emission resins and adhesives as a response to consumer preferences. Moreover, the integration of technology in production, such as automated systems for better quality control, is becoming prevalent. This trend is complemented by the growing recognition of urea formaldehyde’s versatility across various applications, from construction to automotive sectors.
Ghana Urea Formaldehyde Market Opportunities
Genuine opportunities exist in developing eco-friendly alternatives and enhancing existing product formulations to meet stricter regulatory requirements. There is a growing market for modified urea formaldehyde resins that maintain performance while minimizing emissions. Additionally, leveraging technological innovations to improve manufacturing efficiency presents a viable path for companies to capitalize on the upward market trend.
Government Initiatives in the Ghana Urea Formaldehyde Market
The Ghanaian government is proactively addressing environmental concerns through a range of initiatives aimed at promoting sustainable practices within the urea formaldehyde market. This includes the enforcement of emission standards and support for research into alternative resins. Furthermore, financial incentives are being offered to manufacturers adopting greener production processes, striking a balance between industrial growth and environmental stewardship.
Future Insights of the Ghana Urea Formaldehyde Market
Looking ahead to 2026-2032, the Ghana urea formaldehyde market is poised for a dynamic evolution. The anticipated growth will likely be influenced by ongoing innovations in adhesive technologies and a stronger emphasis on sustainability. As consumer preferences shift toward greener products, companies that successfully adapt will find ample opportunities for expansion. Furthermore, collaboration between industry stakeholders and regulatory bodies will play a crucial role in shaping a sustainable market landscape.
Ghana Urea Formaldehyde Market Latest Developments (May 2025 - June 2026)
In the recent months, there has been a notable shift toward integrating advanced technologies into the production processes within the Ghana urea formaldehyde market. Manufacturers are increasingly investing in research and development aimed at creating low-emission products. Additionally, industry forums have emphasized the importance of regulatory compliance, leading to collaborative efforts among stakeholders to meet emerging environmental standards.
Ghana Urea Formaldehyde Market - Key Attractiveness of the Report
- 10 Years of Market Numbers
- Historical Data Starting from 2022 to 2025
- Base Year: 2025
- Forecast Data until 2032
- Key Performance Indicators Impacting the Market
- Major Upcoming Developments and Projects
Key Highlights of the Report:
- Ghana Urea Formaldehyde Market Outlook
- Market Size of Ghana Urea Formaldehyde Market, 2025
- Forecast of Ghana Urea Formaldehyde Market, 2032
- Historical Data and Forecast of Ghana Urea Formaldehyde Revenues & Volume for the Period 2022-2032F
- Ghana Urea Formaldehyde Market Trend Evolution
- Ghana Urea Formaldehyde Market Drivers and Challenges
- Ghana Urea Formaldehyde Price Trends
- Ghana Urea Formaldehyde Porter's Five Forces
- Ghana Urea Formaldehyde Industry Life Cycle
- Historical Data and Forecast of Ghana Urea Formaldehyde Market Revenues & Volume By End-users for the Period 2022-2032F
- Historical Data and Forecast of Ghana Urea Formaldehyde Market Revenues & Volume By Automobiles for the Period 2022-2032F
- Historical Data and Forecast of Ghana Urea Formaldehyde Market Revenues & Volume By Electrical Appliances for the Period 2022-2032F
- Historical Data and Forecast of Ghana Urea Formaldehyde Market Revenues & Volume By Home Appliances (Furniture) for the Period 2022-2032F
- Historical Data and Forecast of Ghana Urea Formaldehyde Market Revenues & Volume By Agriculture for the Period 2022-2032F
- Historical Data and Forecast of Ghana Urea Formaldehyde Market Revenues & Volume By Others for the Period 2022-2032F
- Historical Data and Forecast of Ghana Urea Formaldehyde Market Revenues & Volume By Applications for the Period 2022-2032F
- Historical Data and Forecast of Ghana Urea Formaldehyde Market Revenues & Volume By Adhesives for the Period 2022-2032F
- Historical Data and Forecast of Ghana Urea Formaldehyde Market Revenues & Volume By Particle board for the Period 2022-2032F
- Historical Data and Forecast of Ghana Urea Formaldehyde Market Revenues & Volume By Plywood for the Period 2022-2032F
- Historical Data and Forecast of Ghana Urea Formaldehyde Market Revenues & Volume By Roofing mats for the Period 2022-2032F
- Historical Data and Forecast of Ghana Urea Formaldehyde Market Revenues & Volume By Others for the Period 2022-2032F
- Ghana Urea Formaldehyde Import Export Trade Statistics
- Market Opportunity Assessment By End-users
- Market Opportunity Assessment By Applications
- Ghana Urea Formaldehyde Top Companies Market Share
- Ghana Urea Formaldehyde Competitive Benchmarking By Technical and Operational Parameters
- Ghana Urea Formaldehyde Company Profiles
- Ghana Urea Formaldehyde Key Strategic Recommendations
Ghana Urea Formaldehyde Market - Frequently Asked Questions
The market is experiencing robust growth, driven by the wood processing and construction sectors, despite facing challenges from environmental regulations.
Key factors include the growing demand for engineered wood products, the automotive industry's adoption, and a push for cost-effective adhesive solutions.
The market is projected to reach USD 603 Million by 2032, growing at a CAGR of 5.0% from 2026 to 2032.
The government is implementing regulations to enforce emission standards, supporting research into alternatives, and providing incentives for sustainable practices.
As consumers increasingly demand eco-friendly products, manufacturers are pressured to innovate and offer low-emission alternatives, shaping market dynamics.
6Wresearch actively monitors the Ghana Urea Formaldehyde Market and publishes its comprehensive annual report, highlighting emerging trends, growth drivers, revenue analysis, and forecast outlook. Our insights help businesses to make data-backed strategic decisions with ongoing market dynamics. Our analysts track relevent industries related to the Ghana Urea Formaldehyde Market, allowing our clients with actionable intelligence and reliable forecasts tailored to emerging regional needs.
Yes, we provide customisation as per your requirements. To learn more, feel free to contact us on sales@6wresearch.com
1 Executive Summary |
2 Introduction |
2.1 Key Highlights of the Report |
2.2 Report Description |
2.3 Market Scope & Segmentation |
2.4 Research Methodology |
2.5 Assumptions |
3 Ghana Urea Formaldehyde Market Overview |
3.1 Ghana Country Macro Economic Indicators |
3.2 Ghana Urea Formaldehyde Market Revenues & Volume, 2022 & 2032F |
3.3 Ghana Urea Formaldehyde Market - Industry Life Cycle |
3.4 Ghana Urea Formaldehyde Market - Porter's Five Forces |
3.5 Ghana Urea Formaldehyde Market Revenues & Volume Share, By End-users, 2022 & 2032F |
3.6 Ghana Urea Formaldehyde Market Revenues & Volume Share, By Applications, 2022 & 2032F |
4 Ghana Urea Formaldehyde Market Dynamics |
4.1 Impact Analysis |
4.2 Market Drivers |
4.3 Market Restraints |
5 Ghana Urea Formaldehyde Market Trends |
6 Ghana Urea Formaldehyde Market, By Types |
6.1 Ghana Urea Formaldehyde Market, By End-users |
6.1.1 Overview and Analysis |
6.1.2 Ghana Urea Formaldehyde Market Revenues & Volume, By End-users, 2022-2032F |
6.1.3 Ghana Urea Formaldehyde Market Revenues & Volume, By Automobiles, 2022-2032F |
6.1.4 Ghana Urea Formaldehyde Market Revenues & Volume, By Electrical Appliances, 2022-2032F |
6.1.5 Ghana Urea Formaldehyde Market Revenues & Volume, By Home Appliances (Furniture), 2022-2032F |
6.1.6 Ghana Urea Formaldehyde Market Revenues & Volume, By Agriculture, 2022-2032F |
6.1.7 Ghana Urea Formaldehyde Market Revenues & Volume, By Others, 2022-2032F |
6.2 Ghana Urea Formaldehyde Market, By Applications |
6.2.1 Overview and Analysis |
6.2.2 Ghana Urea Formaldehyde Market Revenues & Volume, By Adhesives, 2022-2032F |
6.2.3 Ghana Urea Formaldehyde Market Revenues & Volume, By Particle board, 2022-2032F |
6.2.4 Ghana Urea Formaldehyde Market Revenues & Volume, By Plywood, 2022-2032F |
6.2.5 Ghana Urea Formaldehyde Market Revenues & Volume, By Roofing mats, 2022-2032F |
6.2.6 Ghana Urea Formaldehyde Market Revenues & Volume, By Others, 2022-2032F |
7 Ghana Urea Formaldehyde Market Import-Export Trade Statistics |
7.1 Ghana Urea Formaldehyde Market Export to Major Countries |
7.2 Ghana Urea Formaldehyde Market Imports from Major Countries |
8 Ghana Urea Formaldehyde Market Key Performance Indicators |
9 Ghana Urea Formaldehyde Market - Opportunity Assessment |
9.1 Ghana Urea Formaldehyde Market Opportunity Assessment, By End-users, 2022 & 2032F |
9.2 Ghana Urea Formaldehyde Market Opportunity Assessment, By Applications, 2022 & 2032F |
10 Ghana Urea Formaldehyde Market - Competitive Landscape |
10.1 Ghana Urea Formaldehyde Market Revenue Share, By Companies, 2025 |
10.2 Ghana Urea Formaldehyde Market Competitive Benchmarking, By Operating and Technical Parameters |
11 Company Profiles |
12 Recommendations |
13 Disclaimer |
Global Go To Market Strategy - 2030
Export potential enables firms to identify high-growth global markets with greater confidence by combining advanced trade intelligence with a structured quantitative methodology. The framework analyzes emerging demand trends and country-level import patterns while integrating macroeconomic and trade datasets such as GDP and population forecasts, bilateral import–export flows, tariff structures, elasticity differentials between developed and developing economies, geographic distance, and import demand projections. Using weighted trade values from 2020–2024 as the base period to project country-to-country export potential for 2030, these inputs are operationalized through calculated drivers such as gravity model parameters, tariff impact factors, and projected GDP per-capita growth. Through an analysis of hidden potentials, demand hotspots, and market conditions that are most favorable to success, this method enables firms to focus on target countries, maximize returns, and global expansion with data, backed by accuracy.
By factoring in the projected importer demand gap that is currently unmet and could be potential opportunity, it identifies the potential for the Exporter (Country) among 190 countries, against the general trade analysis, which identifies the biggest importer or exporter.
To discover high-growth global markets and optimize your business strategy:
Click Here
Pricing
- Single User License$ 1,995
- Department License$ 2,400
- Site License$ 3,120
- Global License$ 3,795

Leadership Perspectives from Industry Events
Search
Thought Leadership and Analyst Meet


Our Clients
6WResearch In News
- India Air Conditioner Market Set for Strong Rebound in 2026 After Weather-Led Correction and GST-Driven Recovery: 6Wresearch
- ADAS in India: How Automatic Emergency Braking, Blind Spot Detection & Driver Monitoring are Transforming Road Safety
- Doha a strategic location for EV manufacturing hub: IPA Qatar
- Demand for luxury TVs surging in the GCC, says Samsung
- Empowering Growth: The Thriving Journey of Bangladesh’s Cable Industry
- Demand for luxury TVs surging in the GCC, says Samsung
Latest Reports
- Poland Fire Protection Systems Market (2026-2032)
- Cape Verde Portable Hand-Thrown Extinguisher Market (2026-2032)
- Canada Portable Hand-Thrown Extinguisher Market (2026-2032)
- Cameroon Portable Hand-Thrown Extinguisher Market (2026-2032)
- Burundi Portable Hand-Thrown Extinguisher Market (2026-2032)
- Burkina Faso Portable Hand-Thrown Extinguisher Market (2026-2032)
- Bulgaria Portable Hand-Thrown Extinguisher Market (2026-2032)
- Brunei Portable Hand-Thrown Extinguisher Market (2026-2032)
- Botswana Portable Hand-Thrown Extinguisher Market (2026-2032)
- Bosnia and Herzegovina Portable Hand-Thrown Extinguisher Market (2026-2032)
Industry Events and Analyst Meet

HIMTEX 2026

India Refining Summit 2026

India EV Show 2026

EV tech India Expo 2026

Auto Tech Asia 2026
Whitepaper
- Middle East & Africa Commercial Security Market Click here to view more.
- Middle East & Africa Fire Safety Systems & Equipment Market Click here to view more.
- GCC Drone Market Click here to view more.
- Middle East Lighting Fixture Market Click here to view more.
- GCC Physical & Perimeter Security Market Click here to view more.