Global Power Rental Market Highlights
| Market Size (2025) | USD 10.3 Billion |
| Forecast Size (2032) | USD 15.6 Billion |
| CAGR | 7.00% |
| Base Year | 2025 |
| Forecast Period | 2026-2032 |
| Largest Region | North America |
| Fastest Growing Region | Asia |
| Largest Segment | Diesel |
| Fastest Growing Segment | Natural Gas |
| Leading Companies | Aggreko, Caterpillar Inc., United Rentals, Cummins Inc., General Electric |
Global Power Rental Market Size & Growth Rate (2026-2032)
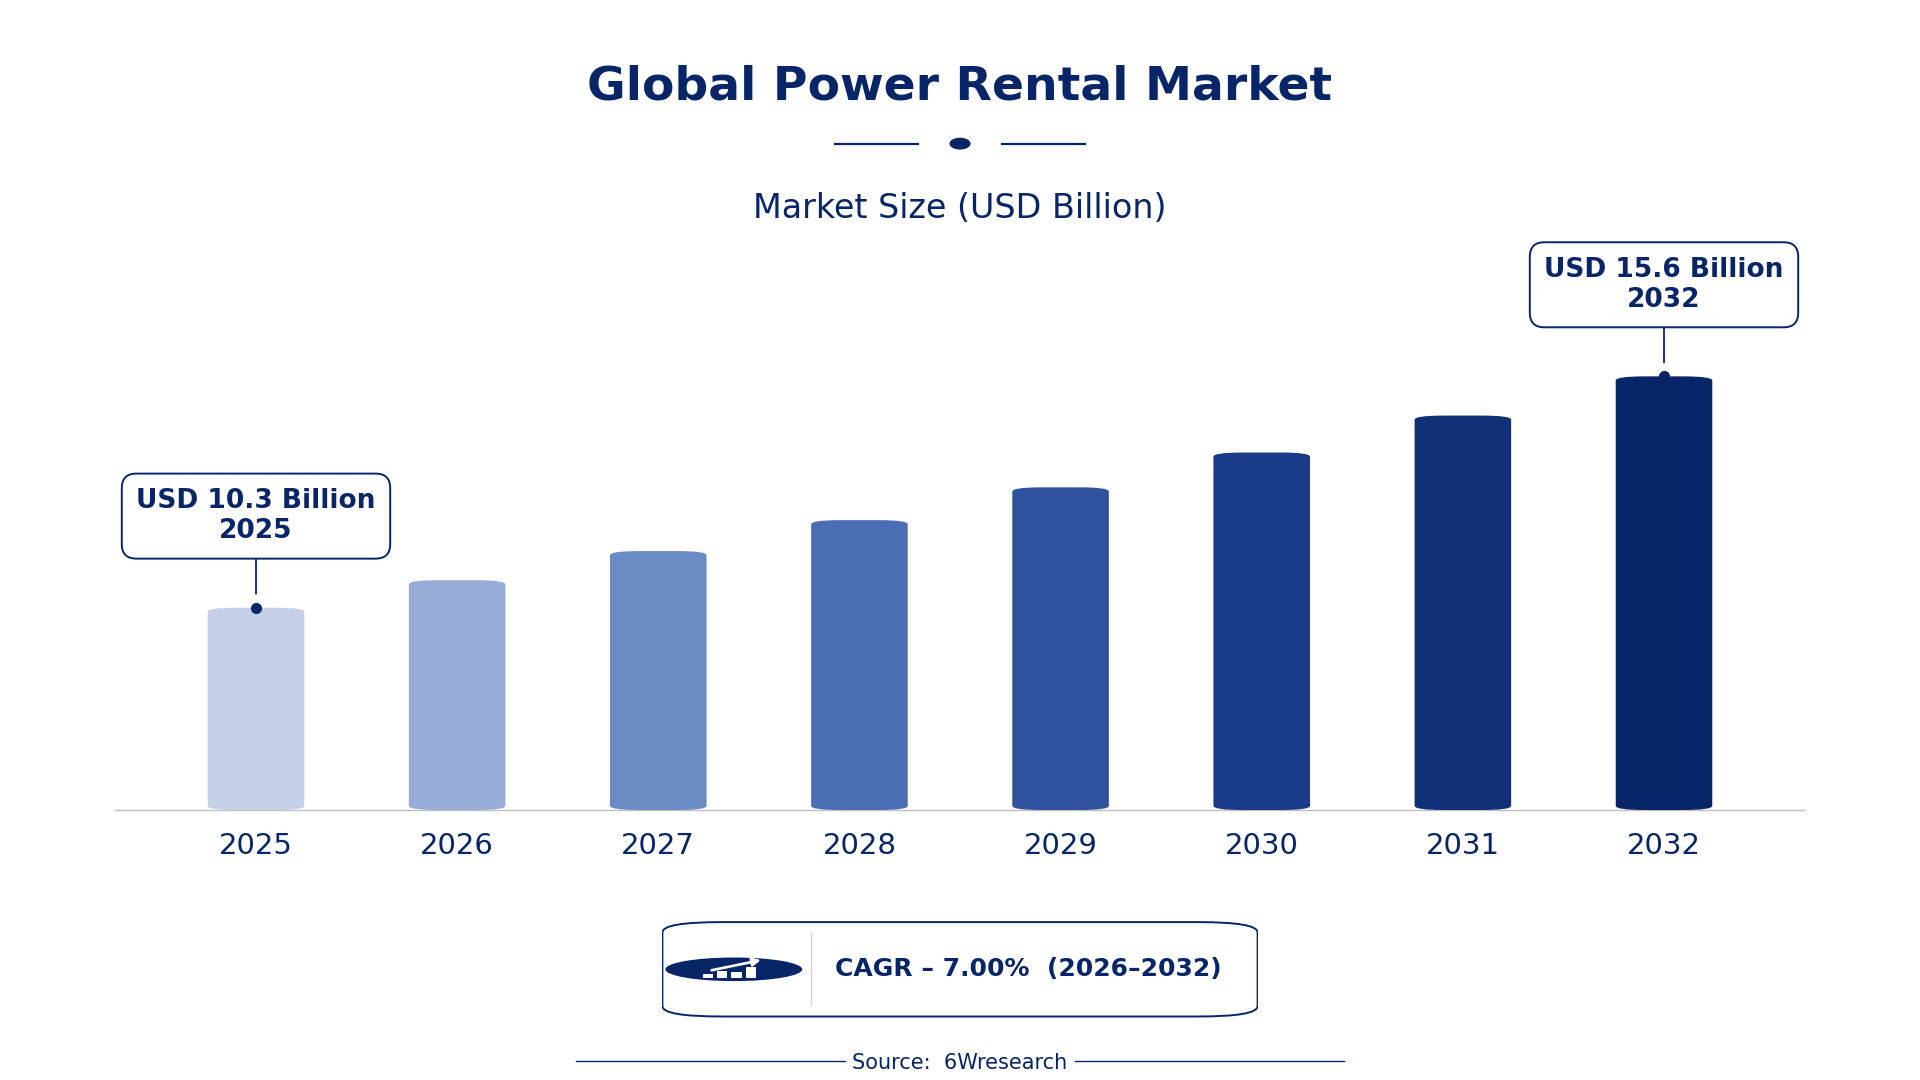
The Global Power Rental Market was estimated at USD 10.3 Billion in 2025 and is projected to reach USD 15.6 Billion by 2032, growing at a CAGR of 7.00% from 2026 to 2032.
Global Power Rental Market Synopsis
The Global Power Rental Market is experiencing a transformative shift fueled by increased short-term and backup power requirements in sectors like construction and oil & gas. An upsurge in infrastructure projects and industrial initiatives in emerging economies is propelling firms to opt for rental solutions that bridge power gaps during critical periods.
Additionally, the emphasis on sustainability is revamping traditional rental approaches, steering toward cleaner energy options, especially gas-powered systems. This market's uniqueness lies in its adaptability to immediate energy needs, differentiating it from stable supply contexts faced by permanent energy infrastructure.
Global Power Rental Market Year-wise Growth Rate and Key Drivers
This graph illustrates the annual growth rates of the Global Power Rental Market from 2022 to 2032, highlighting a steady upward trajectory and projected expansion over the forecast period.
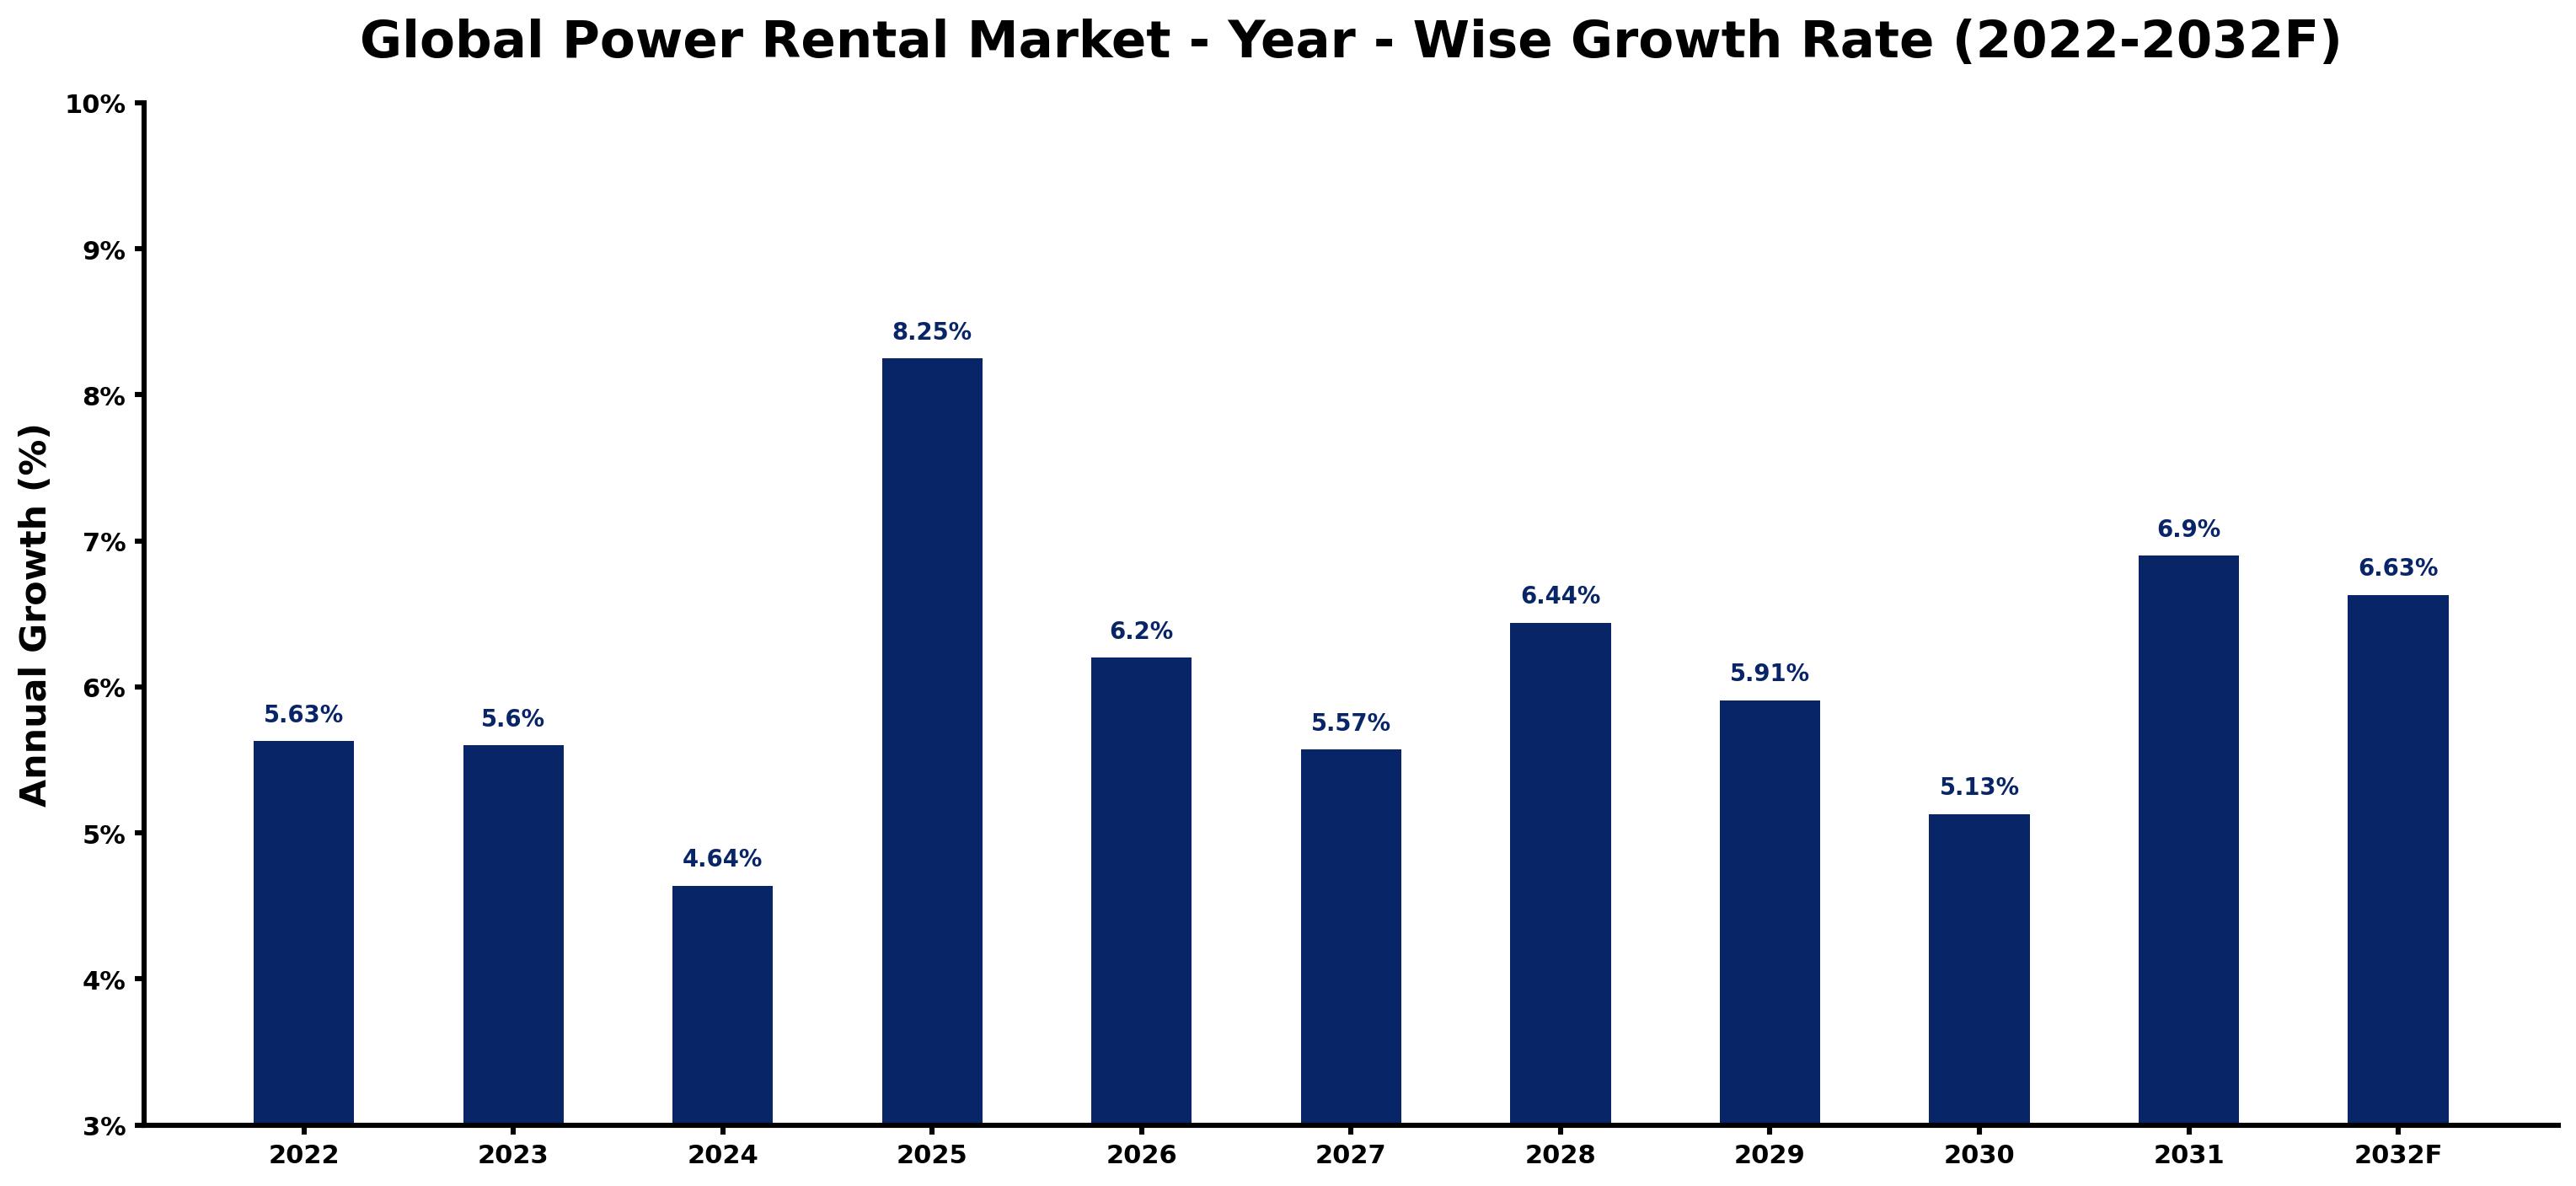
The table below presents the year‑wise growth rates along with the key drivers influencing the market
| Year | Growth Rate (%) | Major Drivers |
| 2022 | 5.63 | In North America, supply chain dynamics are stabilizing the power rental sector. |
| 2023 | 5.6 | Shifting competitive strategies among utility companies are enhancing power rental offerings. |
| 2024 | 4.64 | Advancements in energy storage systems are increasing efficiency in power rental solutions. |
| 2025 | 8.25 | Rental companies are expanding their fleets to meet growing customer needs in power. |
| 2026 | 6.2 | While end-users demand more flexible energy solutions, power rental options expand significantly. |
| 2027 | 5.57 | Regulatory changes requiring increased renewable capacity are driving power rental investments. |
| 2028 | 6.44 | Fluctuating fuel prices are impacting the viability of traditional power rental systems. |
| 2029 | 5.91 | LNG terminals are enhancing power rental capabilities by supporting diverse energy sources. |
| 2030 | 5.13 | A shift toward vertical integration among rental firms changes competitive dynamics in power. |
| 2031 | 6.9 | Utilities are prioritizing sustainability initiatives, influencing power rental service offerings. |
| 2032 | 6.63 | A growing skilled labor shortage is challenging the power rental sector's growth trajectory. |
Note - Market size estimations and growth projections presented in this report are based on 6Wresearch's proprietary research methodology, combining internal industry data, secondary research, and primary validation, updated periodically to reflect current market conditions. As markets evolve rapidly, figures for certain industries may vary slightly and are intended as informed estimates rather than absolute figures. For the most current market sizing, we recommend validating figures with a 6Wresearch analyst.
Global Power Rental Market Key Takeaways
Below are some of the specific key takeaways from the market, including:
- The North America region accounts for approximately 48% of the total market share in 2025, influenced by robust industrial activities.
- Aggreko's revenue from power rental solutions reached USD 1.5 Billion in 2024, indicating strong market penetration.
- Natural gas-powered rental systems are projected to grow at a significant CAGR of 8.5% from 2026 to 2032, highlighting the shift towards cleaner energy sources.
- The construction sector will see a notable increase, with a projected contribution of 30% to market growth due to ongoing projects globally.
Evaluation of Restraints in Global Power Rental Market
Despite the optimistic outlook, the Global Power Rental Market faces key restraints including high operational and maintenance costs. For instance, the average maintenance cost for diesel generators can surge up to USD 0.50 per operational hour, impacting overall profitability for rental firms. Moreover, stringent regulatory frameworks on emissions, such as the EPA’s Tier 4 regulations in the U.S., require significant investment in technology upgrades, adding another layer of challenge. Such factors could deter smaller firms and limit their competitive edge in the market.
Global Power Rental Market Trends
Three prominent trends are reshaping the Global Power Rental Market. First, a marked increase in the use of advanced monitoring technologies, such as IoT solutions, is improving operational efficiency, with companies like Caterpillar leveraging these technologies to enhance reliability and reduce downtime. Second, the integration of hybrid power systems, blending traditional diesel with renewable sources, is gaining traction. For example, in 2022, United Rentals launched a hybrid portable power solution designed to lower emissions. Third, a rise in prefabricated modular systems is revolutionizing project delivery timelines in sectors like construction, allowing quicker deployments and cost efficiencies.
Global Power Rental Market Opportunities
Looking ahead, the Global Power Rental Market is poised for noteworthy opportunities, particularly in renewable energy applications and data centers. Companies like Siemens are exploring hybrid systems combining solar and diesel to create efficient power solutions tailored for industries transitioning away from fossil fuels. For example, Siemens’ recent project with a major utility is expected to yield energy savings of 20% annually. Additionally, investment in backup power for critical infrastructure, especially in healthcare and IT sectors, signals a clear revenue prospect worth approximately USD 4 billion through 2032, as demand for reliable power continues to rise.
Global Power Rental Market by Fuel Type
As of 2025, Diesel systems are leading the Global Power Rental Market, commanding approximately 60% market share. Meanwhile, Natural Gas systems are the fastest-growing segment, with an expected CAGR of 8.5% from 2026 to 2032. Diesel systems continue to be favored for their extensive applications and performance reliability, particularly in construction and industrial settings. However, Natural Gas is quickly gaining popularity due to regulatory pressures for cleaner emissions and lower operational costs, making it an attractive alternative for short-term rentals.
Global Power Rental Market by Equipment
Generators lead the equipment segment of the Global Power Rental Market, representing around 70% of the total share in 2025. Conversely, Load Banks are the fastest-growing equipment type, projected to achieve a CAGR of 9.0% from 2026 to 2032. Generators are preferred due to their versatility across multiple applications, including construction and events, while Load Banks are seeing increased adoption in testing and commissioning applications, especially in data center operations.
Global Power Rental Market by Power Rating
In terms of power rating, systems in the 501-2500 kW range dominate the Global Power Rental Market with a share of approximately 55% in 2025. However, systems rated above 2500 kW are projected to grow at a CAGR of 8.0% from 2026 to 2032. The popularity of mid-range systems centers on their efficiency for larger construction and industrial projects, while the increasing complexity of projects and demand for high-capacity solutions are driving the growth of larger systems, particularly in oil & gas applications.
Global Power Rental Market by Application
In the application segment, Standby Power solutions account for the largest share at approximately 65% as of 2025. Peak Shaving applications are expected to grow at a CAGR of 8.7% from 2026 to 2032. Standby Power remains vital for critical infrastructures that require reliable backup during outages, while Peak Shaving solutions are increasingly sought after by industries aiming to reduce energy costs and manage demand during peak periods effectively.
Global Power Rental Market by End User
Utilities are the leading end user in the Global Power Rental Market, capturing about 45% of the total market share in 2025. The Oil & Gas sector, however, is forecasted to exhibit the fastest growth with a CAGR of 9.5% from 2026 to 2032. Utilities heavily rely on rental solutions for reliable backup during outages, especially in regions with unstable power grids, while the Oil & Gas industry's expanding operations and exploration activities demand flexible and powerful rental solutions to meet fluctuating energy requirements.
Global Power Rental Market by Region
North America is the largest region for the Global Power Rental Market, accounting for approximately 48% of the share in 2025. Conversely, Asia is expected to be the fastest-growing market, with a CAGR of 8.0% from 2026 to 2032. North America's substantial industrial base and infrastructure projects drive ongoing demand, while Asia's rapid economic development and urbanization are significantly amplifying the need for rental power solutions, particularly in construction and manufacturing.
Government Initiatives in the Global Power Rental Market
The regulatory environment around the Global Power Rental Market is heavily influenced by government programs aimed at enhancing energy reliability and sustainability. Policies are emerging to promote cleaner energy sources and overall efficiency improvements in power supply systems, creating opportunities for rental companies to adapt and innovate.
- The U.S. Environmental Protection Agency (EPA) has implemented the Clean Power Plan, effective from 2015, focusing on reducing carbon emissions from power plants!
- The Indian Ministry of Power launched the National Electric Mobility Mission Plan in 2019, aimed at increasing electric vehicle support infrastructure, indirectly benefiting the power rental segment by boosting power storage and rental needs!
- The European Commission's “Green Deal” initiative, announced in December 2019, aims to make Europe the first climate-neutral continent by 2050, transforming investment landscapes for power rental systems towards sustainability!
- The Australian Renewable Energy Agency is investing AUD 800 million in clean energy funding through various projects scheduled for roll out between 2020 and 2025, fostering growth in cleaner power rental solutions!
Future Insights of the Global Power Rental Market
The Global Power Rental Market is set to experience structural changes driven by advancements in hybrid power systems. Companies like Cummins Inc. are investing in integrated solutions that combine renewable sources with conventional systems, enhancing efficiency and sustainability. As sectors increasingly prioritize environmental compliance, we expect a notable shift toward natural gas and hybrid systems, especially with natural gas-powered rentals projected to achieve a CAGR of 8.5% through 2032. The emphasis on cleaner energy options is reshaping future supplier-customer relationships, with demand for adaptability remaining crucial.
Global Power Rental Market Latest Developments
Recent initiatives within the Global Power Rental Market showcase significant moves by key players aimed at enhancing market competitiveness and responding to evolving energy needs. Below are noteworthy developments:
- Aggreko has recently completed an expansion of its fleet with the addition of advanced hybrid generators, positioning the company for long-term market growth through cleaner emissions and faster deployment.
- United Rentals is ongoing with its collaboration to develop microgrid solutions aimed at enhancing power reliability for critical construction projects, addressing the increasing need for resilient infrastructure.
- Cummins Inc. is set to launch a new line of natural gas generators by early 2024, expanding its product offerings to cater to the growing demand for environmentally friendly power solutions.
- General Electric is planning significant investments in digital power management technologies expected to be implemented by late 2023, further strengthening its competitive edge in efficiency and operational reliability.
Global Power Rental Market Key Players and Industry Positioning
The Global Power Rental Market is relatively fragmented, with several key players actively competing on various fronts, including technological advancements, service offerings, and geographic reach. Each company has carved out a distinct position within the market, focused on enhancing its capabilities through unique strategies.
| Leading Company | Core Strength | Strategic Focus |
|---|---|---|
| Aggreko | Extensive fleet of diverse power generation equipment | Hybrid and renewable energy solutions |
| Caterpillar Inc. | Robust engine technology and support services | Advanced monitoring and IoT integration |
| United Rentals | Integrated rental service across diverse sectors | Rapid deployment and microgrid solutions |
| Cummins Inc. | Leadership in engine and power technology | Natural gas systems and emissions reduction |
| General Electric | Digital power management expertise | Efficiency improvements through technology |
The competitive dynamics in the Global Power Rental Market are evolving, with companies increasingly focusing on technological partnerships to innovate offerings that meet both operational efficiency and sustainability requirements.
Key Attractiveness of the Report
- 10 Years of Market Numbers
- Historical Data Starting from 2022 to 2025
- Base Year: 2025
- Forecast Data until 2032
- Key Performance Indicators Impacting the Market
- Major Upcoming Developments and Projects
Key Highlights of the Report:
- Global Power Rental Market Overview
- Global Power Rental Market Outlook
- Global Power Rental Market Forecast
- Historical Data of Global Power Rental Revenues for the Period 2022-2032
- Global Power Rental Market Size and Forecast of Revenues, Until 2032
- Historical Data of Global Power Rental Market Revenues, By Types, for the Period 2022-2032
- Market Size & Forecast of Global Power Rental Market Revenues, By Types, until 2032
- Historical Data of Global Power Rental Market Revenues, By KVA ratings, for the Period 2022-2032
- Market Size & Forecast of Global Power Rental Market Revenues, By KVA rating, until 2032
- Historical Data of Global Power Rental Market Revenues, By End-User Applications, for the Period 2022-2032
- Market Size & Forecast of Global Power Rental Market Revenues, By End-User Applications, until 2032
- Historical Data of North America Power Rental Market Revenues, for the Period 2022-2032
- Market Size & Forecast of North America Power Rental Market Revenues, until 2032
- Historical Data of Europe Power Rental Market Revenues, for the Period 2022-2032
- Market Size & Forecast of Europe Power Rental Market Revenues, until 2032
- Historical Data of APAC Power Rental Market Revenues, for the Period 2022-2032
- Market Size & Forecast of APAC Power Rental Market Revenues, until 2032
- Historical Data of the Middle East & Africa Power Rental Market Revenues, for the Period 2022-2032
- Market Size & Forecast of the Middle East & Africa Power Rental Market Revenues, until 2032
- Historical Data of Latin America Power Rental Market Revenues, for the Period 2022-2032
- Market Size & Forecast of Latin America Power Rental Market Revenues, until 2032
- Market Drivers and Restraints
- Global Power Rental Market Trends and Industry Life Cycle
- Global Power Rental Market Share, By Regions
- Global Power Rental Market Share, By Players
- Global Power Rental Market Overview on Competitive Benchmarking
- Company Profiles
- Key Strategic Recommendations
Markets Covered
The Global Power Rental Market report provides a detailed analysis of the following market segments:
By Regions and Countries:
- North America
- Europe
- LATAM
- Middle East
- Asia
- Africa
By Fuel Type:
- Diesel
- Natural Gas
By Equipment:
- Generators
- Transformers
- Load Banks
By Power Rating:
- Up to 50 kW
- 51“500 kW
- 501-2500 kW
- Above 2500 kW
By Application:
- Standby power
- Peak shaving
- Base load/ continuous power
By End User:
- Utilities
- Oil & gas
- Construction
- Manufacturing
- Metal & Mining
- IT
- Data centers
- Corporate & Retail






































