Greece Connector Market (2026-2032) | Outlook, Share, Analysis, Revenue, Segmentation, Industry, Companies, Growth, Value, Forecast, Trends & Size
Market Forecast By Product (PCB Connectors, IO Connectors, Circular Connectors, Fiber Optic Connectors, RF Coaxial Connectors, Others), By End Use (Telecom, Transportation, Automotive, Industrial, Computer & Peripherals, Others) And Competitive Landscape
| Product Code: ETC5176132 | Publication Date: Nov 2023 | Updated Date: Mar 2026 | Product Type: Market Research Report | |
| Publisher: 6Wresearch | Author: Bhawna Singh | No. of Pages: 60 | No. of Figures: 30 | No. of Tables: 5 |
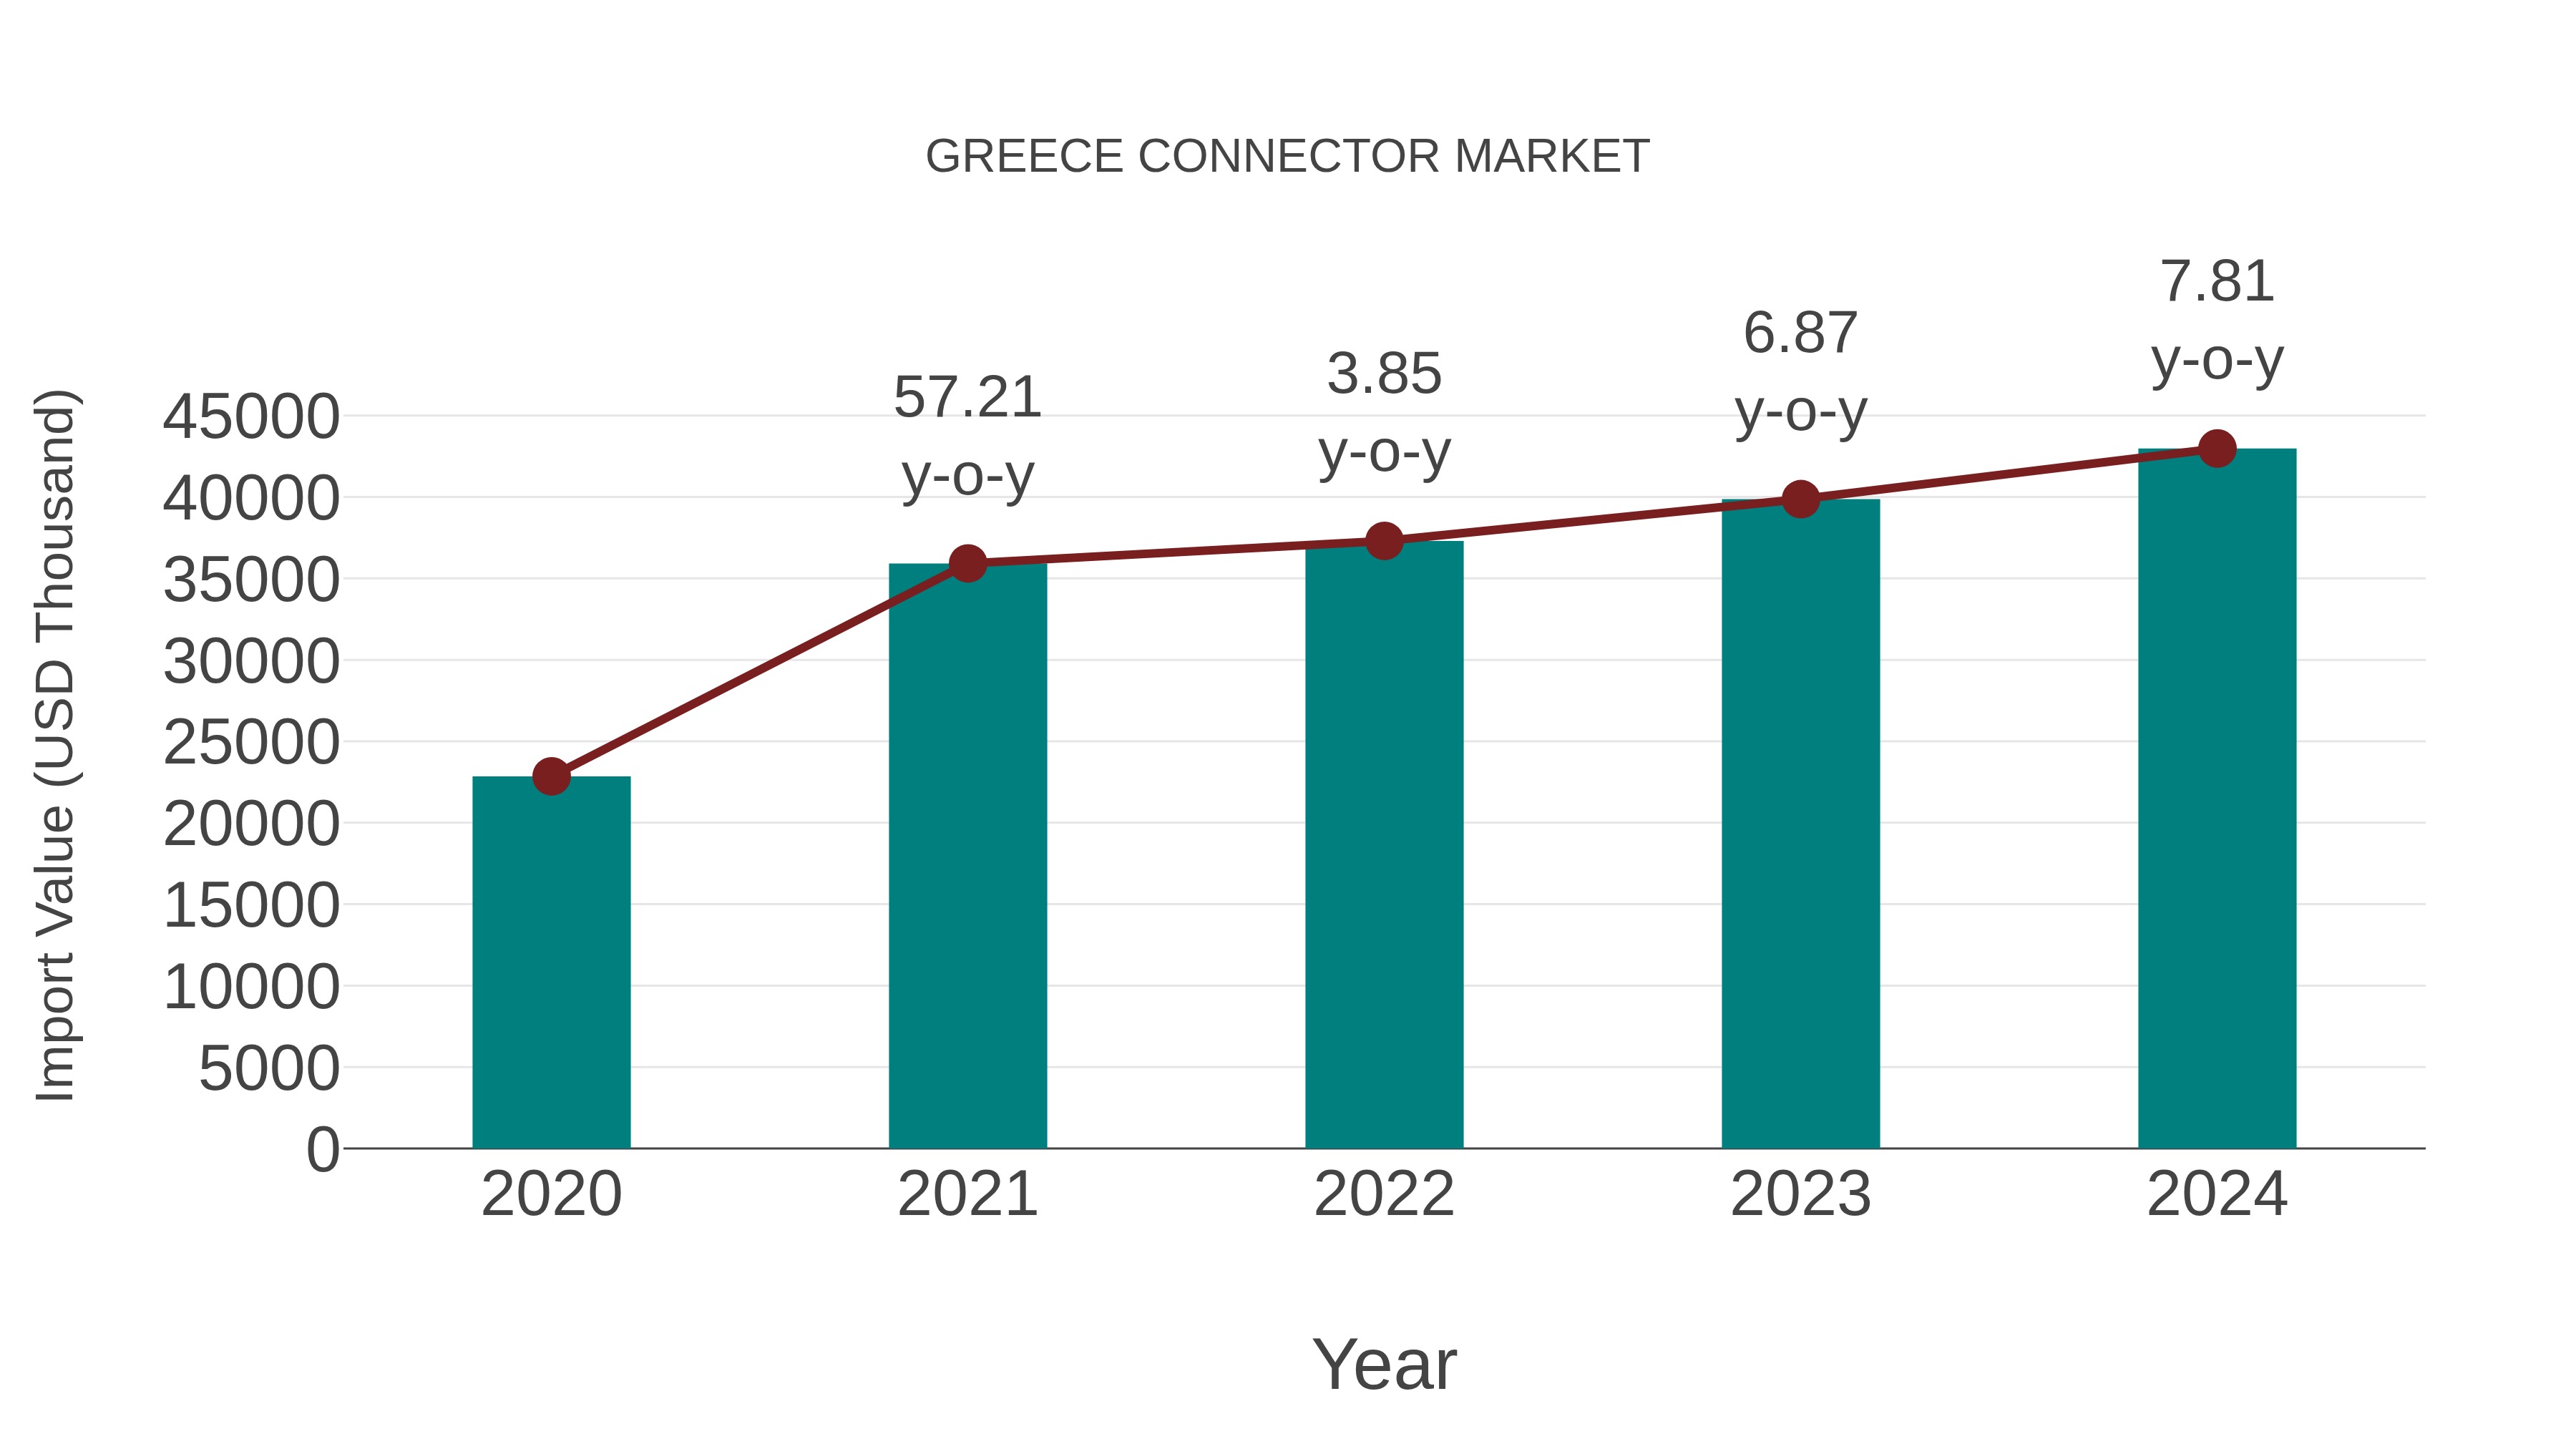
Greece Connector Market: Import Trend Analysis
In the Greece connector market, the import trend exhibited notable growth, with a 7.81% increase from 2023 to 2024. The compound annual growth rate (CAGR) for imports over the period 2020-2024 stood at 17.11%. This surge in import momentum can be attributed to increased demand for connectors driven by technological advancements and expanding applications in various industries.
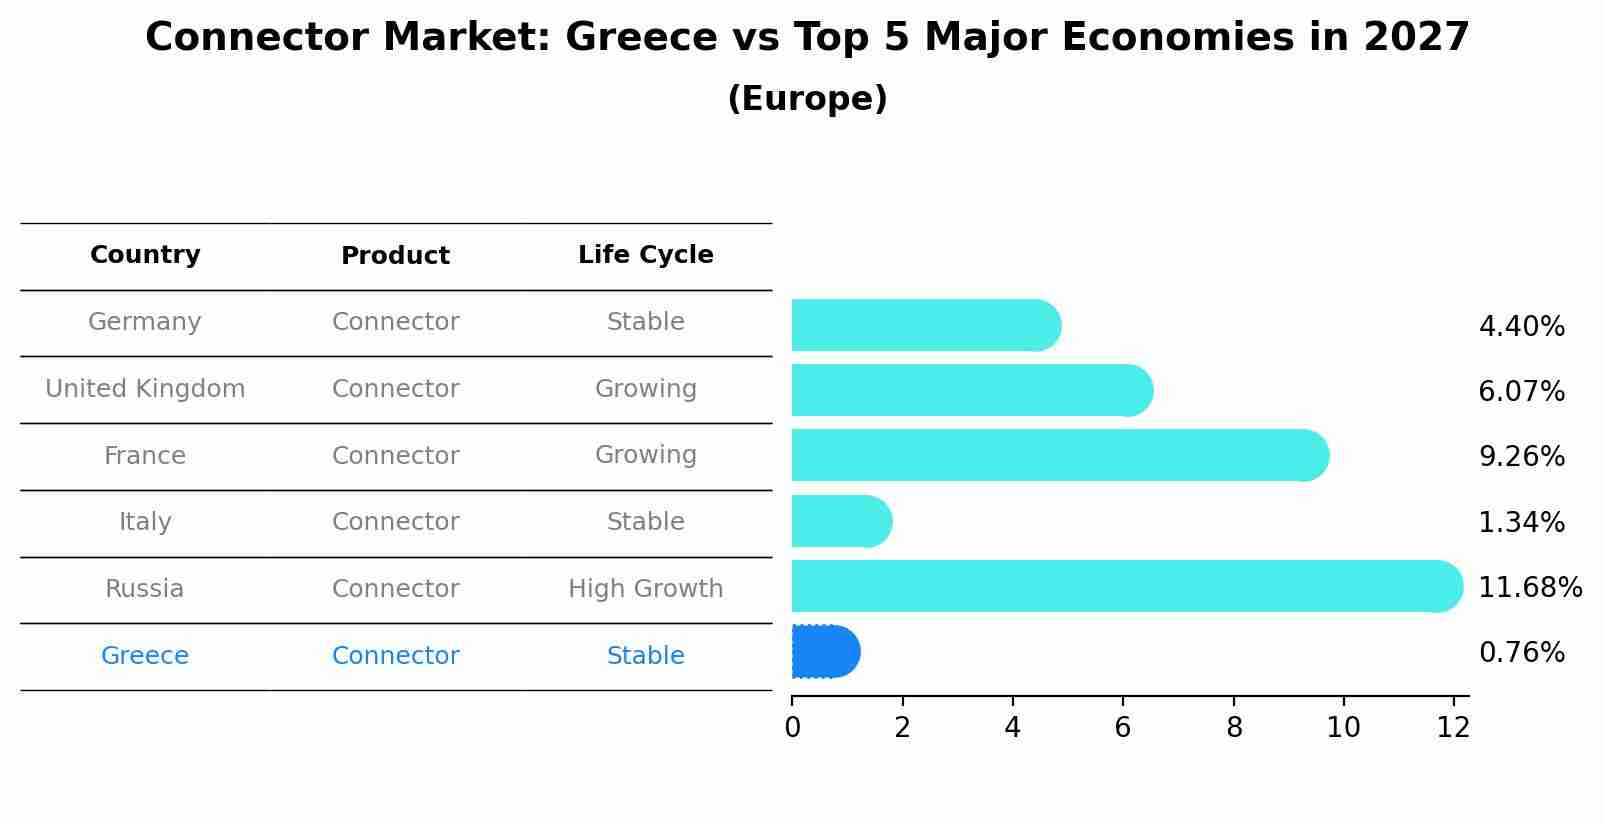
Connector Market: Greece vs Top 5 Major Economies in 2027 (Europe)
In the Europe region, the Connector market in Greece is projected to expand at a stable growth rate of 0.76% by 2027. The largest economy is Germany, followed by United Kingdom, France, Italy and Russia.
Greece Connector Market Overview
The connector market in Greece is expanding as demand for efficient and reliable electrical and electronic connectors rises across various industries, including automotive, telecommunications, and electronics. These connectors are critical components in ensuring proper functionality and connectivity in electronic devices. With Greeces focus on technological advancements, the connector market is expected to grow.
Drivers of the market
The connector market in Greece is growing as industries like automotive, telecommunications, and consumer electronics increasingly require advanced connector solutions. The demand for high-performance connectors is rising as more electronic devices, machinery, and infrastructure projects are introduced. As the automotive sector transitions toward electric vehicles (EVs), the need for specialized connectors that support EV charging infrastructure also boosts market growth. Furthermore, the expansion of the telecommunications network in Greece, particularly for 5G, drives the need for advanced connectors.
Challenges of the market
The connector market in Greece faces challenges due to the growing demand for smaller, more efficient connectors capable of supporting increasingly complex electronic systems. The need for innovation in the face of rapid technological advancements, coupled with price pressures from international competitors, adds to the market`s complexity.
Government Policy of the market
The connector market in Greece is influenced by government policies that encourage the use of advanced technology in electronic devices, automotive manufacturing, and renewable energy. Regulations that support infrastructure development, smart grid systems, and energy-efficient technologies contribute to the demand for high-performance connectors.
Key Highlights of the Report:
- Greece Connector Market Outlook
- Market Size of Greece Connector Market, 2025
- Forecast of Greece Connector Market, 2032
- Historical Data and Forecast of Greece Connector Revenues & Volume for the Period 2022-2032F
- Greece Connector Market Trend Evolution
- Greece Connector Market Drivers and Challenges
- Greece Connector Price Trends
- Greece Connector Porter`s Five Forces
- Greece Connector Industry Life Cycle
- Historical Data and Forecast of Greece Connector Market Revenues & Volume By Product for the Period 2022-2032F
- Historical Data and Forecast of Greece Connector Market Revenues & Volume By PCB Connectors for the Period 2022-2032F
- Historical Data and Forecast of Greece Connector Market Revenues & Volume By IO Connectors for the Period 2022-2032F
- Historical Data and Forecast of Greece Connector Market Revenues & Volume By Circular Connectors for the Period 2022-2032F
- Historical Data and Forecast of Greece Connector Market Revenues & Volume By Fiber Optic Connectors for the Period 2022-2032F
- Historical Data and Forecast of Greece Connector Market Revenues & Volume By RF Coaxial Connectors for the Period 2022-2032F
- Historical Data and Forecast of Greece Connector Market Revenues & Volume By Others for the Period 2022-2032F
- Historical Data and Forecast of Greece Connector Market Revenues & Volume By End Use for the Period 2022-2032F
- Historical Data and Forecast of Greece Connector Market Revenues & Volume By Telecom for the Period 2022-2032F
- Historical Data and Forecast of Greece Connector Market Revenues & Volume By Transportation for the Period 2022-2032F
- Historical Data and Forecast of Greece Connector Market Revenues & Volume By Automotive for the Period 2022-2032F
- Historical Data and Forecast of Greece Connector Market Revenues & Volume By Industrial for the Period 2022-2032F
- Historical Data and Forecast of Greece Connector Market Revenues & Volume By Computer & Peripherals for the Period 2022-2032F
- Historical Data and Forecast of Greece Connector Market Revenues & Volume By Others for the Period 2022-2032F
- Greece Connector Import Export Trade Statistics
- Market Opportunity Assessment By Product
- Market Opportunity Assessment By End Use
- Greece Connector Top Companies Market Share
- Greece Connector Competitive Benchmarking By Technical and Operational Parameters
- Greece Connector Company Profiles
- Greece Connector Key Strategic Recommendations
Greece Connector Market (2026-2032): FAQs
6Wresearch actively monitors the Greece Connector Market and publishes its comprehensive annual report, highlighting emerging trends, growth drivers, revenue analysis, and forecast outlook. Our insights help businesses to make data-backed strategic decisions with ongoing market dynamics. Our analysts track relevent industries related to the Greece Connector Market, allowing our clients with actionable intelligence and reliable forecasts tailored to emerging regional needs.
Yes, we provide customisation as per your requirements. To learn more, feel free to contact us on sales@6wresearch.com
1 Executive Summary |
2 Introduction |
2.1 Key Highlights of the Report |
2.2 Report Description |
2.3 Market Scope & Segmentation |
2.4 Research Methodology |
2.5 Assumptions |
3 Greece Connector Market Overview |
3.1 Greece Country Macro Economic Indicators |
3.2 Greece Connector Market Revenues & Volume, 2022 & 2032F |
3.3 Greece Connector Market - Industry Life Cycle |
3.4 Greece Connector Market - Porter's Five Forces |
3.5 Greece Connector Market Revenues & Volume Share, By Product, 2022 & 2032F |
3.6 Greece Connector Market Revenues & Volume Share, By End Use, 2022 & 2032F |
4 Greece Connector Market Dynamics |
4.1 Impact Analysis |
4.2 Market Drivers |
4.2.1 Increasing demand for electronic devices and appliances in Greece |
4.2.2 Growing adoption of advanced technologies requiring connectors |
4.2.3 Expansion of industries such as automotive, telecommunications, and healthcare in Greece |
4.3 Market Restraints |
4.3.1 Economic uncertainty and fluctuations impacting overall market growth |
4.3.2 Intense competition from domestic and international connector manufacturers |
4.3.3 Regulatory challenges and compliance requirements affecting market entry and operations |
5 Greece Connector Market Trends |
6 Greece Connector Market Segmentations |
6.1 Greece Connector Market, By Product |
6.1.1 Overview and Analysis |
6.1.2 Greece Connector Market Revenues & Volume, By PCB Connectors, 2022-2032F |
6.1.3 Greece Connector Market Revenues & Volume, By IO Connectors, 2022-2032F |
6.1.4 Greece Connector Market Revenues & Volume, By Circular Connectors, 2022-2032F |
6.1.5 Greece Connector Market Revenues & Volume, By Fiber Optic Connectors, 2022-2032F |
6.1.6 Greece Connector Market Revenues & Volume, By RF Coaxial Connectors, 2022-2032F |
6.1.7 Greece Connector Market Revenues & Volume, By Others, 2022-2032F |
6.2 Greece Connector Market, By End Use |
6.2.1 Overview and Analysis |
6.2.2 Greece Connector Market Revenues & Volume, By Telecom, 2022-2032F |
6.2.3 Greece Connector Market Revenues & Volume, By Transportation, 2022-2032F |
6.2.4 Greece Connector Market Revenues & Volume, By Automotive, 2022-2032F |
6.2.5 Greece Connector Market Revenues & Volume, By Industrial, 2022-2032F |
6.2.6 Greece Connector Market Revenues & Volume, By Computer & Peripherals, 2022-2032F |
6.2.7 Greece Connector Market Revenues & Volume, By Others, 2022-2032F |
7 Greece Connector Market Import-Export Trade Statistics |
7.1 Greece Connector Market Export to Major Countries |
7.2 Greece Connector Market Imports from Major Countries |
8 Greece Connector Market Key Performance Indicators |
8.1 Percentage of revenue from new product innovations |
8.2 Adoption rate of high-speed connectors in key industries |
8.3 Customer satisfaction score for connector quality and reliability |
8.4 Average time-to-market for new connector products |
8.5 Percentage of market penetration in emerging sectors such as renewable energy and IoT |
9 Greece Connector Market - Opportunity Assessment |
9.1 Greece Connector Market Opportunity Assessment, By Product, 2022 & 2032F |
9.2 Greece Connector Market Opportunity Assessment, By End Use, 2022 & 2032F |
10 Greece Connector Market - Competitive Landscape |
10.1 Greece Connector Market Revenue Share, By Companies, 2025 |
10.2 Greece Connector Market Competitive Benchmarking, By Operating and Technical Parameters |
11 Company Profiles |
12 Recommendations | 13 Disclaimer |
Global Go To Market Strategy - 2030
Export potential enables firms to identify high-growth global markets with greater confidence by combining advanced trade intelligence with a structured quantitative methodology. The framework analyzes emerging demand trends and country-level import patterns while integrating macroeconomic and trade datasets such as GDP and population forecasts, bilateral import–export flows, tariff structures, elasticity differentials between developed and developing economies, geographic distance, and import demand projections. Using weighted trade values from 2020–2024 as the base period to project country-to-country export potential for 2030, these inputs are operationalized through calculated drivers such as gravity model parameters, tariff impact factors, and projected GDP per-capita growth. Through an analysis of hidden potentials, demand hotspots, and market conditions that are most favorable to success, this method enables firms to focus on target countries, maximize returns, and global expansion with data, backed by accuracy.
By factoring in the projected importer demand gap that is currently unmet and could be potential opportunity, it identifies the potential for the Exporter (Country) among 190 countries, against the general trade analysis, which identifies the biggest importer or exporter.
To discover high-growth global markets and optimize your business strategy:
Click Here
Pricing
- Single User License$ 1,995
- Department License$ 2,400
- Site License$ 3,120
- Global License$ 3,795

Leadership Perspectives from Industry Events
Search
Thought Leadership and Analyst Meet


Our Clients
6WResearch In News
- India Export Attractiveness Tracker 2026
- India Air Conditioner Market Set for Strong Rebound in 2026 After Weather-Led Correction and GST-Driven Recovery: 6Wresearch
- ADAS in India: How Automatic Emergency Braking, Blind Spot Detection & Driver Monitoring are Transforming Road Safety
- Doha a strategic location for EV manufacturing hub: IPA Qatar
- Demand for luxury TVs surging in the GCC, says Samsung
- Empowering Growth: The Thriving Journey of Bangladesh’s Cable Industry
Latest Reports
- Nicaragua RPG Gaming Market (2026-2032)
- New Zealand RPG Gaming Market (2026-2032)
- Netherlands RPG Gaming Market (2026-2032)
- Nauru RPG Gaming Market (2026-2032)
- Namibia RPG Gaming Market (2026-2032)
- Mozambique RPG Gaming Market (2026-2032)
- Montenegro RPG Gaming Market (2026-2032)
- Mongolia RPG Gaming Market (2026-2032)
- Monaco RPG Gaming Market (2026-2032)
- Micronesia RPG Gaming Market (2026-2032)
Industry Events and Analyst Meet

EV India Expo 2026

HIMTEX 2026

India Refining Summit 2026

India EV Show 2026

EV tech India Expo 2026
Whitepaper
- Middle East & Africa Commercial Security Market Click here to view more.
- Middle East & Africa Fire Safety Systems & Equipment Market Click here to view more.
- GCC Drone Market Click here to view more.
- Middle East Lighting Fixture Market Click here to view more.
- GCC Physical & Perimeter Security Market Click here to view more.